
 ?Mathematical formulae have been encoded as MathML and are displayed in this HTML version using MathJax in order to improve their display. Uncheck the box to turn MathJax off. This feature requires Javascript. Click on a formula to zoom.
ABSTRACT
To assess the in vitro activity of three phenolic acids (ferulic acid, p-hydroxybenzoic acid, vanillic acid) and two flavonols (quercetin, rutin) on mycelial growth and mycotoxin accumulation of Fusarium graminearum (FG), F. langsethiae (FL) and F. poae (FP), two different approaches were chosen. First, grains from oat varieties were inoculated with a suspension of three FL isolates to determine the influence of phenolic compounds on the accumulation of mycotoxins. The oat variety Zorro showed a tendency for lower accumulation of T-2/HT-2, diacetoxyscirpenol and neosolaniol. Second, a mycelium growth assay was conducted to follow FG, FL and FP growth on cereal based media supplemented with phenolic compounds. Increasing concentrations of ferulic acid substantially inhibited growth of FG and FL, while FP growth was reduced to 57%. In contrast, p-hydroxybenzoic acid, vanillic acid, quercetin, and rutin slightly stimulated mycelium growth. Results about mycotoxin production in cereal based media were less conclusive.
GRAPHICAL ABSTRACT
Introduction
One of the most noxious cereal diseases is caused by a complex of toxigenic species from the genus Fusarium (Osborne and Stein Citation2007). Depending on the cereal type, the species spectrum differs. However, F. graminearum (FG) was shown to be the main species occurring in barley and wheat (Osborne and Stein Citation2007; Schöneberg et al. Citation2016), while F. poae (FP) and F. langsethiae (FL) frequently occur in oats (Hofgaard et al. Citation2016; Schöneberg et al. Citation2018a). Furthermore, an infection with Fusarium species results in the contamination of cereals with health-threatening mycotoxins. These are mainly type A and type B trichothecenes such as T-2 and HT-2, or nivalenol (NIV) and deoxynivalenol (DON) (Desjardins Citation2006).
As part of a daily diet, oats can reduce the risk of cardiovascular diseases, diabetes and some forms of cancer due to the rich content of beta-glucans and soluble dietary fibres (Clemens and van Klinken Citation2014). Moreover, the phytochemical profile of oats includes phenolic compounds with antioxidant properties such as ferulic acid (Emmons et al. Citation1999; Adom and Liu Citation2002). These compounds can bind free radicals and thus lower the risk of chronic diseases (Dykes and Rooney Citation2007). Phenolic compounds are secondary metabolites with various purposes such as pigmentation and resistance to pathogens in plants (Lattanzio et al. Citation2006). The abundance and composition of these compounds in cereal grains is contributed to by both constitutive or induced synthesis and is highly variable depending on the species, variety and environmental conditions (Adom and Liu Citation2002; Lattanzio et al. Citation2006). The majority of phenolic compounds are bound to the cell wall (Adom and Liu Citation2002), indicating that they are a part of the preformed general defense system against potential pathogens (Stuper-Szablewska et al. Citation2017). However, the exact mechanism of their antifungal activity is not fully understood. With respect to toxigenic species, it has been hypothesised that reactive oxygen radicals reduce peroxide stress, which was in turn shown to enhance DON accumulation (Ponts et al. Citation2007; Gauthier et al. Citation2015).
Phenolic acids are predominant in cereal grain extracts and are derivatives of either cinnamic acid or benzoic acid. They include, in descending quantity, ferulic acid, p-hydroxybenzoic acid and vanillic acid (Dykes and Rooney Citation2007; Van Hung Citation2016). The objectives of this study were i) to elucidate the in vitro effect of endogenous phenolic acids and flavonols in oat grains on the potential reduction of mycotoxins produced by FL and ii) to examine the dose dependent effect of these substances incorporated into agar medium on the growth and mycotoxin production of FG, FP and FL.
Materials & methods
Origin of fungal material
All Fusarium strains were isolated from barley or oat samples collected in Switzerland and known to produce DON (FG), NIV (FP) or T-2/HT-2 (FL). The geographic origin, year and host from which the strains were isolated are indicated in . Isolates were stored as single conidia isolates in 50% glycerol at −70°C.
Table 1. Fusarium strains used in this study.
Preparation of conidia suspensions
The inoculum used for the inoculation of different oat varieties was prepared as described by Vogelgsang et al. (Citation2008) with modifications described by Schöneberg et al. (Citation2018b). In brief, seven day old FL cultures were grown on potato dextrose agar (PDA; Oxoid, Basingstoke, UK) and conidia were washed from the plates with 0.0125% Tween® 20 (Sigma-Aldrich, Darmstadt, Germany) and adjusted to a final concentration of 2 × 10⁶ conidia ml−1. The final conidia suspension used for the inoculation of the different oat grain varieties consisted of a mixture of the three FL strains () in equal proportions to mimic a population.
Inoculation and incubation of oat grains
Seeds of four commercially available and recommended spring oat varieties were chosen: Canyon, Gaillette, Husky and Zorro. Gaillette and Zorro are black hulled varieties, whereas Canyon and Husky are white and yellow hulled varieties, respectively.
Grain samples of 25 g of each variety were transferred to 175 ml flat-based polycarbonate Erlenmeyer flasks (FalconTM, Becton Dickinson, Franklin Lakes, NJ, USA). Prior to autoclaving for 20 min at 121°C, 20 ml of deionised water were added into each flask. After cooling down to room temperature, 2.5 ml of the FL spore suspension was added under sterile conditions. For control treatments, 2.5 ml of 0.0125% Tween® 20 were added. Subsequently, the flasks were placed in an incubator (RUMED, Rubarth Apparate GmbH, Laatzen, Germany) at 18°C in the dark, in a randomised complete block design, consisting of four blocks (replicates).
After three weeks, the colonised oat kernels were placed in 10 × 15 cm plastic trays under a laminar flow to dry for 24 h. Subsequently, all samples were gradually freeze dried from −40°C to −25°C at 0.2 mbar in an Ultra Low Temperature Upright Freezer (FormaTM 981/982, Thermo Fisher Scientific, Waltham, MA, USA). Dried samples were milled (sieve size 0.25 mm) in an Ultra Centrifugal Mill (ZM 200, Retsch, Haan, Germany) and stored at −20°C. The experiment was conducted twice.
Mycelium growth and mycotoxin content on cereal-based media
In order to assess the response of FG, FL and FP to three phenolic acids and two flavonoids, a mycelium growth assay was performed. All compounds, ferulic acid, p-hydroxybenzoic acid, vanillic acid, quercetin and rutin (Sigma Aldrich Chemie GmbH, Buchs, Switzerland), were tested at three concentrations against each fungal species (). The intermediate concentration roughly represents the average content of total phenolic acids and flavonoids in cereals reported in the literature (Mattila et al. Citation2005), although contents listed in publications vary considerably as phytochemical compositions are strongly influenced by environmental factors, genotype, agricultural practice and milling method (e.g. Dykes and Rooney Citation2007; Atanasova-Penichon et al. Citation2016; Stuper-Szablewska et al. Citation2017).
Table 2. Concentrations of phenolic acids and flavonoids incorporated in cereal based agar in an in vitro experiment and their average content ranges (± standard error) in cereals according to a review by Mattila et al. (Citation2005).
As a basis medium, cereal flour agar (Kokkonen et al. Citation2012) was used and modified depending on the host from which the respective Fusarium species was isolated. For FL and FP, 40 g milled oats (variety Wiland) and for FG, 40 g milled barley (variety Cassia) were used instead of 40 g milled wheat. Prior to incorporating the different compounds, media were autoclaved for 15 min at 121°C and subsequently cooled to 50°C.
Stock solutions were prepared for the different compounds. P-hydroxybenzoic acid and vanillic acid were dissolved in 95% ethanol to a concentration of 20 g l−1. Quercetin and rutin were dissolved in 95% dimethyl sulfoxide (DMSO) (Sigma Aldrich Chemie GmbH) to a concentration of 20 g l−1. Forty µl of stock solutions were added to 800 ml agar to achieve a final concentration of 1 mg kg−1, and stirred for 2 min at 40°C. To achieve an end concentration of 10 mg kg−1 and 100 mg kg−1, the process was executed with a 10 times and 100 times higher volume of the stock solution, respectively. Solid ferulic acid was added directly to the autoclaved, liquid cereal agar: For a final concentration of 100 mg kg−1, 0.08 g ferulic acid was dissolved in 800 ml agar by stirring for 5 min at 40°C. Ten times and 50 times higher amounts of ferulic acid were added to obtain a final concentration of 1000 mg kg−1 and 5000 mg kg−1, respectively. For ferulic acid, due to the limited aqueous solubility, only a 50 times higher amount compared with the lowest concentration was used. The ethanol solvent control for the vanillic acid and p-hydroxybenzoic acid had a final concentration of 0.48%, whereas the solvent control of DMSO for quercetin and rutin treatments contained 0.5% DMSO. In addition, a control treatment without solvent was included. Each Petri dish (Ø 94 mm, without vents; Greiner Bio-One GmbH, Frickenhausen, Germany) was filled with 20 ml liquid agar, left to solidify and stored at 5°C in the dark.
Mycelial plugs were obtained from seven day old Fusarium cultures grown on PDA (18°C 12h near ultraviolet (NUV)/12h darkness), using a sterile cork borer (ø 5 mm). The plugs were placed in the centre of a fresh plate with the mycelial side facing the agar. Incubation was for seven days at 18°C in the dark. The assay consisted of a randomised, complete block design, with blocks representing the tested fungi and three repetitions of each factor combination. The experiment was repeated three times.
Mycelial growth was assessed on a daily basis for seven days starting at day one post inoculation. All plates were photographed with a digital camera (EOS 700D, Canon, Tokyo, Japan) and the daily growth area (mm2) was calculated using image processing software (ImageJ). Diameters were used to determine the mean growth area in mm2.
The growth increase in mm2 (ΔA) was determined as the difference between the average growth area measured at the estimated beginning of the linear phase of fungal growth (two days post inoculation) and the end point of the assay (seven days post inoculation). Inhibition of fungal growth was expressed as percent growth reduction and calculated as follows:
A stimulation of growth is therefore expressed as negative percentage.
The percentage of mycotoxin (M) reduction by treatments was calculated using the following equation:
Sample preparation for mycotoxin analysis and phenolic compounds
Oat grain varietal experiment: For the extraction of mycotoxins and phenolic compounds from oat grains, five gram milled sample was transferred in 50 ml self-standing centrifuge tubes (SARSTEDT AG & Co. KG, Nümbrecht, Germany). About 20 ml extraction solvent (acetonitrile/water/acetic acid (v/v/v), 79:20:1) were added to the tubes and shaken for 90 min on an orbital shaker at 120 rpm. Subsequently, the samples were placed upright for sedimentation. All extracts were diluted 1:10 in chromatography vials with the aid of the extraction solvent and adjusted to a total volume of 1 ml per vial.
Mycelium growth and mycotoxin content on cereal-based media: seven days post inoculation, a sterile cork borer was used to randomly sample six mycelial plugs from actively growing mycelium. Plugs were weighed and stored at –20°C in sterile 2 ml Eppendorf tubes. A volume of 1 ml extraction solvent was pipetted directly onto the mycelial plugs and tubes were placed in an orbital shaker (Typ LSR-V, Adolf Kühner AG, Birsfelden, Switzerland) for 2 h at 180 rpm. Samples were transferred to chromatography vials and diluted 1:10 with extraction solvent.
Liquid chromatography-tandem mass spectrometry analysis
LC-MS/MS used in this work was validated for the simultaneous quantitative determination of multiple analytes from various types of matrices with high starch or water contents (Malachova et al. Citation2014).
All analytes were detected and quantified using a QTrap 5500 LC-MS/MS System (Applied Biosystems, Foster City, CA, USA) equipped with a TurboV ion source for electrospray ionisation (ESI). Chromatographic separation was performed at 25°C on a Gemini®C18-column, 150 × 4.6 mm, 5 μm particle size, equipped with a C18 security guard cartridge, 4×3 mm (Phenomenex, Torrance, CA, USA) in gradient elution mode. For quantification, mycotoxin and phenolic compound standards served as external calibrators. The limits of detection (LOD) were determined as three times the baseline noise. To evaluate the performance of the multi toxin method, blank agar and oat meal control samples were spiked with defined target toxins and phenolic compounds and analysed together with the inoculated treatment samples. The recovery values of the spiked samples ranged between 80% and 112%. The performance of the method is verified by regular participation in proficiency tests organised by BIPEA (Gennevilliers, France). All 12 results submitted for oats were in the satisfactory range of −2 < z < 2.
Statistical analysis
Statistical analysis was performed with R Studio, version 3.3.0 (R Core Team Citation2015). Linear mixed effects regression analyses were performed with the packages nlme (Pinheiro et al. Citation2016) and lme4 (Bates et al. Citation2015). To assess potential violation of linear modelling assumptions, the data were visually inspected for normality and homoscedasticity by creating diagnostic residual plots and Q-Q plots. To meet linear assumptions for data transformation, the boxcox function of the package MASS (Ripley et al. Citation2013) based on a test of Box and Cox (Citation1964) was used. The chosen transformations of the different response variables for the respective experiments are shown in .
Table 3. Transformations for mycotoxins and phenolic compounds to meet linearity assumptions. Data from an experiment with grains of four oat varieties (Canyon, Husky, Gaillette and Zorro) inoculated with Fusarium langsethiae under controlled environment and from an in vitro mycelial growth experiment on cereal based agar supplemented with different phenolic compounds inoculated with F. graminearum, F. langsethiae and F. poae. Y = measured response variable.
Several analyses of variance (ANOVA) were carried out after performing linear mixed effects analyses on the relationship between various transformed response variables. For the oat grain varietal experiment, the response variable was the respective detected mycotoxin and two categorical variables, treatment (FL inoculated vs. control) and oat variety as well as the interaction between them. For the mycelium growth experiment, the response variables were growth increase (ΔA), detected mycotoxins and the two categorical variables, phenolic compound concentration and treatment (phenolic compound vs. control) as well as the interaction, separately for each fungal species. The variables treatment (inoculated vs. control), variety and the respective interaction for the oat grain varietal experiment, as well as phenolic compound concentration and treatment (different fungal species) including the respective interaction for the mycelium growth experiment were set as fixed effects in the linear mixed effects model. Block and experiment repetition which account for the variation of the response variables were set as random effects.
For the oat grain varietal experiment, the effect of the variety on the mycotoxin contents was assessed using a covariance analysis (ANCOVA) with the covariates ferulic acid, p-hydroxybenzoic acid and quercetin. The covariates were selected with forward variable selection. If significant effects were detected in both ANOVA and ANCOVA, post-hoc analysis was performed with the package lsmeans (Lenth Citation2016) according to the multiple comparison procedure of Tukey (Citation1949) (significance value α = 0.05). For figures, SigmaPlot© Version 13.0.0.83 (Systat Software Inc., San Jose, CA) was used and untransformed data were plotted.
Results
Oat grain varietal experiment
A total of 16 mycotoxins were detected in oat grain samples from the inoculated treatments. Only those associated with FL were considered in the statistical analysis, resulting in 13 detected mycotoxins. These were grouped into type A trichothecenes and ‘other’ Fusarium mycotoxins according to Desjardins (Citation2006). Additionally, four phenolic compounds were identified in the control and three in the inoculated treatment, respectively. Six samples (four control and two inoculated treatments) were excluded from the analysis due to severe contamination with unidentified fungal species.
The studied oat varieties revealed significant differences in their phenolic compound content (p < 0.001), except for p-hydroxybenzoic acid in the controls (). Significantly, up to two times higher concentrations of ferulic acid were measured in the control treatment in kernels of the black oat varieties Gaillette and Zorro compared with the yellow or white varieties Canyon and Husky (both p < 0.001) (). The inoculation with FL caused a reduction of all compounds in all varieties (). The reduction relative to the control ranged from 96 to 100% for ferulic acid, and from 97 to 100% for p-hydroxybenzoic acid. A complete reduction following FL inoculation was observed for vanillic acid in all varieties. The lowest reduction was observed for quercetin, ranging from 67 to 90%.
Figure 1. Amounts of ferulic acid, p-hydroxybenzoic acid, vanillic acid and quercetin in grains from four oat varieties (Canyon, Gaillette, Husky and Zorro) in the non-inoculated control (n = 28) and after inoculation with Fusarium langsethiae (FL) (n = 30). Measurements were conducted after three weeks incubation at 18°C in the dark. Pooled data of two experiments were used. Error bars represent the standard error of the means. Comparisons of the phenolic compounds were made between values of the different oat grain varieties within the same treatment groups (Control, FL inoculated). Values of oat grain varieties with the same letters are not significantly different (α = 0.05).
Despite the overall reduction, FL inoculated grains of the black hulled oat variety Zorro had a significantly higher concentration of ferulic acid compared with the white hulled variety Canyon (p = 0.004) and the yellow hulled variety Husky (p < 0.001). Furthermore, FL inoculated grains of the black-hulled variety Gaillette showed a significantly higher ferulic acid concentration compared with the variety Husky (p = 0.007) ().
In the control treatment, vanillic acid concentrations were significantly higher in grains from black oat varieties (36ʹ300 µg kg−1 Gaillette [p < 0.001] and 28ʹ700 µg kg−1 Zorro [p < 0.001]) compared with the varieties Canyon and Husky. In contrast, grains from the oat varieties Canyon and Husky contained higher concentrations of p-hydroxybenzoic acid (6ʹ400 µg kg−1 and 5ʹ700 µg kg−1) than grains from the black oat varieties (). However, this effect was only significant between the varieties Zorro and Canyon (p = 0.012) and Zorro and Husky (p = 0.008) and only in grains from the inoculated treatment. Grains from the black oat variety Zorro contained the highest amount of quercetin both in the inoculated (140 µg kg−1; p < 0.001) as well as in the control treatment (420 µg kg−1; p < 0.001), compared with grains from all other varieties ().
ANCOVA showed that the oat variety had a significant effect on the content of all mycotoxins except for diacetoxyscirpenol (DAS) (). The covariates ferulic acid and p-hydroxybenzoic acid had no significant effect on any mycotoxin, whereas quercetin had a minor but significant decreasing effect on neosolaniol (NEO) (p = 0.03) and DAS (p = 0.02) ().
Table 4. P-values from hypothesis testing through a covariance analysis (ANCOVA) of the mycotoxins T-2/HT-2 (sum), neosolaniol, diacetoxyscirpenol and bikaverin under controlled environment conditions in grains across four different oat varieties (Canyon, Husky, Gaillette and Zorro) artificially inoculated with F. langsethiae.
Data on acetamidobutenolide (BUT) content were omitted from further analysis since the residuals were not normally distributed despite different transformation procedures. Following artificial inoculation, the content of every detected mycotoxin varied significantly between oat varieties (p < 0.001). Grains from the black oat variety Zorro revealed the lowest amount of deacetylneosolaniol (mean: 16ʹ700 µg kg−1) compared with grains from the oat varieties Canyon (p = 0.004), Gaillette and Husky (both p < 0.001) which accumulated deacetylneosolaniol in a range from 42ʹ600 to 52ʹ500 µg kg−1 (). The same was observed for T2/HT-2, showing the lowest contamination in variety Zorro (90ʹ300 µg kg−1) (). Furthermore, for enniatin B, significantly (p < 0.001) higher values were measured in the non-inoculated grains of the variety Zorro compared with all other varieties (data not shown).
Table 5. Mean mycotoxin concentrations (µg kg−1) in grains from the four oat varieties Canyon, Gaillette, Husky and Zorro, inoculated with Fusarium langsethiae (n = 30) under controlled environmental conditions. Mean values in rows with different letters indicate significant differences between the oat varieties for the respective mycotoxin according to a Tukey test (α = 0.05).
In the group ‘other Fusarium toxins’, apicidin was the toxin with the highest concentration. In FL inoculated grains from the black oat variety Zorro, the lowest apicidin content was measured (55ʹ700 µg kg−1), compared with grains from the varieties Canyon, Gaillette and Husky, ranging from 75ʹ650 to 78ʹ000 µg kg−1. Differences, however, were not significant. Concentrations of enniatin B were overall very low, but in contrast to apicidin, the highest amount was detected in grains from the variety Zorro. Significantly lower amounts (p < 0.001) were detected in grains from Canyon, Gaillette and Husky (). For culmorin, the lowest amounts were observed in grains from the varieties Husky (p = 0.004) and Zorro (p = 0.033), followed by Canyon (p = 0.017), compared with the highest measured amount in grains from Gaillette ().
Influence of ferulic acid on mycelium growth and mycotoxin content on cereal based media
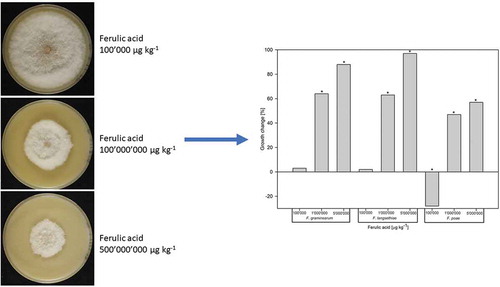
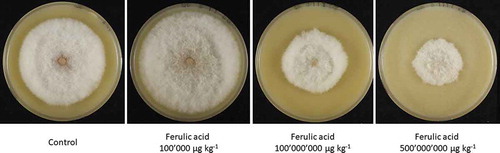
Ferulic acid had a significant influence on the growth of all Fusarium species compared with the control treatment (p < 0.001). For FG, increasing concentrations of ferulic acid significantly decreased fungal growth relative to the control treatment ranging from 3% (100ʹ000 µg kg−1, p > 0.05), 64% (1ʹ000ʹ000 µg kg−1, p < 0.001) to 88% (5ʹ000ʹ000 µg kg−1, p < 0.001). The same trend was observed for FL, with growth reductions of 2% (p > 0.05), 63% (p < 0.001) and 97% (p < 0.001), respectively (). In contrast, growth of FP increased by 28% (p < 0.001) with the lowest concentration of ferulic acid but significantly decreased with increasing concentrations, showing a 47% (p < 0.001) and 57% (p < 0.001) reduction at concentrations of 1ʹ000ʹ000 and 5ʹ000ʹ000 µg kg−1, respectively (). Furthermore, the morphology of FP colonies was visibly affected by this treatment, showing irregular growth and very dense aerial mycelium ().
Figure 2. Impact of ferulic acid supplemented to cereal based agar at different concentrations on the in vitro growth change (%) relative to the control of Fusarium graminearum, F. langsethiae and F. poae (n = 27 for each Fusarium species). Bars with negative values represent increased growth compared with the untreated control. Bars with an asterisk indicate significant differences to the control (Tukey Test α = 0.05).
Figure 3. Mycelium growth of Fusarium poae on oat meal agar without (control) and with ferulic acid at 100ʹ000, 100ʹ000ʹ000 and 5ʹ000ʹ000 µg kg−1 after seven days post inoculation at 18°C, 12h NUV/12h darkness.
Influence of p-hydroxybenzoic acid, quercetin, rutin and vanillic acid on mycelium growth
All these phenolic compound concentrations had a significant influence on fungal growth (p < 0.001). Overall and in contrast to ferulic acid, FG and FP showed an increase in growth when exposed to p-hydroxybenzoic acid, quercetin, rutin and vanillic acid, whereas FL showed mostly a decrease in growth (). For FG, p-hydroxybenzoic acid, quercetin, rutin and vanillic acid only had minor and not significant growth increasing effects, ranging from 1 to 8%. In contrast, all concentrations of phenolic compounds, except for the highest concentration (100ʹ000 µg kg−1) of rutin and vanillic acid, resulted in a significant growth decrease of FL ranging between 6 and 10% (p = 0.028 – < 0.001) ().
Figure 4. Impact of p-hydroxybenzoic acid, quercetin, rutin and vanillic acid supplemented to cereal based agar at different concentrations on the in vitro growth change (%) relative to the control of Fusarium graminearum, F. langsethiae and F. poae (n = 27 for each combination of Fusarium species and phenolic compound). Bars with negative percentage values represent increased growth compared with the untreated control. Bars with an asterisk show significant differences to the control treatment (Tukey Test α = 0.05).
For FP, the selected phenolic compounds increased growth in all treatments. P-hydroxybenzoic acid and the vanillic acid treatments enhanced growth by 6 to 10% and by 6 to 17%, respectively. For quercetin and rutin at 10ʹ000 µg kg−1 growth increased by 38 and 29%, respectively ().
Influence of ferulic acid on mycotoxin content
For FG, ferulic acid at concentrations of 1ʹ000ʹ000 and 5ʹ000ʹ000 µg kg−1 was associated with up to 85% lower aurofusarin (AUF) and up to 90% lower zearalenone (ZEA) contents. Even the lowest concentration (100ʹ000 µg kg−1) resulted in lower toxin contents of 28 and 6%, respectively ().
Table 6. Influence of different ferulic acid concentrations supplemented to cereal based agar on the mean in vitro contents of aurofusarin (AUF), zearalenone (ZEA), acetamido-butenolid (BUT), diacetoxyscirpenol (DAS), neosolaniol (NEO), T-2/HT-2 toxins (T-2/HT-2) and nivalenol (NIV) in µg kg−1 and percent reduction relative to the untreated control (%) of Fusarium graminearum, F. langsethiae and F. poae (n = 675). Negative values represent increased toxin production compared with the untreated control. Mean values in rows with different letters indicate significant differences between concentrations according to a Tukey test (α = 0.05).
For FL, almost no accumulation (98% reduction) of T-2/HT-2, DAS and NEO was associated with the highest concentration of ferulic acid. The lowest concentration resulted in a reduction of DAS, NEO and T-2/HT-2 by 50%, 43% and 44%, respectively ().
For FP, ferulic acid resulted in a reduced AUF accumulation (up to 99%), but in higher NIV contents, ranging from 33 to more than 1700%. Results for DAS were inconclusive as the lowest concentration of ferulic acid resulted in a 65% reduction, whereas higher concentrations resulted in a significant increase (). For all Fusarium species, but in particular for FP, an exceptional higher content of BUT was associated with the highest ferulic acid concentration ().
Influence of p-hydroxybenzoic acid, quercetin, rutin and vanillic acid on mycotoxin content
For FG, p-hydroxybenzoic acid and vanillic acid resulted in a significant (p < 0.001) reduction of AUF and ZEA (more than 75% relative to the control) (Supplementary Table 1 & Supplementary Table 4). However, no clear concentration response of these two phenolic compounds on mycotoxins was found. Quercetin and rutin were associated with a lower ZEA content, ranging between 40 and 65%. With regard to AUF, the highest concentrations (100ʹ000 µg kg−1 for each compound) resulted in a reduction of more than 50%, while the lower concentrations (1ʹ000 and 10ʹ000 µg kg−1) significantly stimulated AUF by more than 250% (p < 0.001) (Supplementary Table 2 & Supplementary Table 3).
For FL, p-hydroxybenzoic acid and vanillic acid resulted in significantly lower (p < 0.001) DAS, NEO and T-2/HT-2 contents (≥ 75%) at all concentrations (Supplementary Table 1 & Supplementary Table 4). Quercetin and rutin were associated with lower mycotoxin contents between 30 and 70%. However, significant lower amounts (p < 0.001) were only measured with the highest quercetin concentration for DAS and NEO (Supplementary Table 2 & Supplementary Table 3).
For FP, all concentrations of p-hydroxybenzoic acid and vanillic acid resulted in a significant reduction (p < 0.001) of AUF, DAS and NIV (≥ 75%). However, there was no linear reduction with increasing concentrations (Supplementary Table 1 & Supplementary Table 4). Quercetin and rutin showed different effects. Quercetin was associated with significantly higher DAS contents (> 200%) in the lowest (p = 0.004) and highest (p < 0.001) concentrations, whereas rutin revealed a strong inhibitory effect (p < 0.001) at all concentrations (> 90%). Both compounds resulted in > 75% reduced AUF content at the highest concentration but increased its content at the middle and low concentrations (Supplementary Table 2 & Supplementary Table 3). For NIV, quercetin resulted in a reduction of ≥ 50% at the lower concentration but in an increase of 30% at the highest concentration compared with the non-inoculated control treatment (Supplementary Table 2). With rutin, the NIV content was reduced by 33% under all concentrations (Supplementary Table 3).
Discussion
The colour of cereal hulls can range from white, yellow, reddish-brown to black caused by natural pigments such as anthocyanins in the aleurone layer of the grain (Abdel-Aal et al. Citation2006). Anthocyanins as well as tocopherols and carotenoids were reported for their antioxidant activity (Boutigny et al. Citation2008). With respect to mycotoxins, it is known that type A trichothecenes accumulate in the oat hull (Edwards et al. Citation2009). Hence, the fact that we observed the lowest content of deacetylneosolaniol in grains from the black hulled variety Zorro compared with grains from white and yellow hulled varieties, could possibly be a result of the antioxidant pigment composition. The antifungal activity of grain endogenous flavonoids has been assessed by Skadhauge et al. (Citation1997) in surface sterilised barley seed. They demonstrated that a dihydroquercetin accumulating barley mutant (ant 18–159) inhibited hyphal penetration of FP, FG and F. culmorum into the grain testa. The resistance was attributed to the mutants’ excessive production of dihydroquercetin due to a nonsense mutation in the gene encoding for dihydroflavonol reductase. Furthermore, wheat varieties with dark and purple coloured grains contain high amounts of ferulic acid and vanillic acid (Masisi et al. Citation2016), which is in accordance to our observations in the dark hulled oat varieties Zorro and Gaillette in the non-inoculated control treatments. However, a close negative correlation between the colour of the variety and mycotoxin accumulation could not be determined.
We observed significantly different amounts of phenolic compounds in grains from the four tested oat varieties. The significantly lower mycotoxin contents in grains from the variety Zorro compared with grains from the other varieties could be a result of the endogenous content of ferulic acid, p-hydroxybenzoic acid, vanillic acid and quercetin. For the experiment, it was necessary to autoclave oat grains before the treatments, hence, the initial content in each variety was not known because thermal processing can lead to a degradation of flavonoids (Buchner et al. Citation2006). Both, decreasing and increasing effects, were observed for phenolic acids as recently reviewed by Kadiri (Citation2017). Nevertheless, it is likely that the fungus metabolised an extensive amount of the endogenous phenolic compounds leading to the observed differences between the control and the inoculated treatment, which was also reported by Bilska et al. (Citation2018).
Quercetin had a minor but significantly decreasing effect on the content of T-2/HT-2, DAS and NEO compared with the other measured phenolic compounds and was highest in grains from the black oat variety Zorro. However, the influence of the oat variety itself on mycotoxin content was substantially higher than the effect of the phenolic compounds since lower amounts were observed in grains from the black oat variety Zorro. Antioxidant properties of flavonoids such as quercetin can interfere with mycotoxin production as has been reviewed by Atanasova-Penichon et al. (Citation2016). This finding could explain our observation of reduced T-2/HT-2, DAS and NEO levels in grains from oat varieties with higher quercetin concentrations. The effect of quercetin to inhibit mycotoxin accumulation is to some extent in accordance with the results of Bollina and Kushalappa (Citation2011). They showed that quercetin added at a concentration of 2.95 mM reduced DON production of FG in vitro. However, 2.95 mM equals 892ʹ000 µg kg−1, hence, the growth-inhibiting concentration exceeded by far the quercetin content measured in our inoculated treatment. Recently, Bilska et al. (Citation2018) observed the influence of yeast media supplemented with 400 or 800 µg kg−1 quercetin, which was below the lowest tested amount in our study, on mycotoxin production of FG and F. culmorum. Thereby, a reduction of trichothecene accumulation in media exposed to quercetin was found, which is in accordance with our results.
Further research is needed to elucidate the endogenous activity of a wide spectrum of phenolic compounds against Fusarium spp. both in harvested grains and in planta. In addition, it would be advantageous to develop a protocol where grains would not have to be autoclaved, e.g. irradiation of grains to determine the exact amount of phenolic compounds initially present.
The effect of different phenolic acids and flavonoids on growth and mycotoxin content in the mycelium growth assay using cereal based media varied largely depending on the Fusarium species and the concentration levels tested. There are a few studies available on the in vitro effect of these antioxidants on Fusarium species, however, the majority focused on FG and utilised highly different conditions and methods such as liquid cultures (Boutigny et al. Citation2009; Bollina and Kushalappa Citation2011) or suspensions instead of PDA plugs (Ponts et al. Citation2011). To our knowledge, there is no study about the effect of a FL inoculation on the phenolic compound content in oat varieties.
As reviewed by Atanasova-Penichon et al. (Citation2016), ferulic acid is considered to be the most potent phenolic acid with antifungal activity against Fusarium species, which is in accordance to our results. In fact, the most consistent overall inhibition of mycelial growth was observed with ferulic acid treatments. A stronger inhibition of mycelial growth compared with the untreated control was observed for FG and FL with increasing concentrations, whereas growth reduction of FP was less pronounced. Although FP seemed to be less susceptible to ferulic acid, colony morphology was visibly affected by the treatment, showing irregular growth and low to no colony elevation compared with the control. Although the medium ferulic acid concentration was based on published information on contents common to wheat grains, our concentration levels exceeded those applied in other in vitro assays. Ponts et al. (Citation2011) observed a 50% growth inhibition of FG at much lower concentrations of 0.7 mM (136ʹ000 µg kg−1). However, a concentration of 0.515 mM (100ʹ000 µg kg−1) resulted only in a 3% reduction, which is in line with our results for the lowest concentration. Ferruz et al. (Citation2016) found that ferulic acid inhibited FL growth at 1 mM, whereas at 0.5 mM, fungal biomass increased. The authors assumed that this increase was due to a sub-lethal dosage and possible depletion of ferulic acid by the fungus over time. Although we did not observe an increase of FL after exposure to ferulic acid, this phenomenon could be an explanation for the lower inhibitory effect of ferulic acid on FP mycelium growth.
In contrast to ferulic acid, p-hydroxybenzoic acid showed only minor growth inhibition on FG, FL and FP. Similarly, Ponts et al. (Citation2011) considered p-hydroxybenzoic acid as the least toxic substance in their experiment and suggested values of > 15 mM (2ʹ072ʹ000 µg kg−1) to cause a 50% inhibition (IC50) for FG. Likewise, minor growth reductions of FG were observed with low concentrations of p-hydroxybenzoic acid (200 to 800 mg l−1), which increased to > 60% with higher concentrations (1ʹ600 mg l−1) (Wu et al. Citation2010).
Bollina and Kushalappa (Citation2011) examined the effect of quercetin on FG growth and found an IC 50 value of 2.95 mM (1ʹ000ʹ000 µg kg−1), which surpassed the highest concentration of the current study by a factor of 10. Hence, we assume that the dosage in our investigation may have been insufficient to result in an inhibition of FG.
The influence of vanillic acid and rutin, showing either slight growth inhibition or increase depending on the substance and fungal species remains undisclosed and needs to be investigated in more detail. So far, the effects of these substances were mainly tested against soil-borne Fusarium species such as F. oxysporum (Mohamed et al. Citation2017; Zhao et al. Citation2018) and F. solani (Kalinova and Radova Citation2009). Both phenolic compounds were able to reduce growth of these fungal species, however, an increase of fusaric acid was also reported.
Regarding the effect of phenolic acids and flavonoids on the mycotoxin production, it has to be taken into account that the investigation solely allowed a brief insight into the situation seven days past inoculation. However, a potential long-term effect either suppressing or enhancing mycotoxin production cannot be excluded and should be investigated. For FG and, more profoundly, for FL, increased concentrations of ferulic acid substantially reduced most mycotoxins. For FP, and similar to the observations on mycelial growth, high concentrations of ferulic acid showed variable effects on mycotoxin accumulation, such as a reduction of AUF content, but an increase in DAS and NIV contents. This implies that FP might be more resilient to the respective phenolic compounds. While the biological activity of antioxidant phenolic acids such as ferulic acid was postulated to be inhibitory towards type A and type B trichothecenes (Boutigny et al. Citation2010; Ferruz et al. Citation2016), contradictory results reporting increasing toxin contents have also been published (Ponts et al. Citation2011).
In the current study, FP produced higher contents of type A and type B trichothecenes when exposed to increasing concentrations of ferulic acid. In contrast, the addition of p-hydroxybenzoic acid resulted in a decrease in type A and B trichothecenes, which is in line with the results reported by Ponts et al. (Citation2011). However, in our study, this effect was only observed for FP, but not for FG and FL. This indicates that FP is not as sensitive to p-hydroxybenzoic acid as FG and FL which could be due to a transformation of the acid into a less affecting substance, as observed by Kulik et al. (Citation2017). Also, a potential interference with trichothecene biosynthesis at the transcriptional level (Pani et al. Citation2016) which occurs in FG and FL, but not in FP, should be investigated. Stimulation of trichothecene biosynthesis by FG in vitro has mostly been associated with oxidative stress due to H2O2 treatment (Ponts et al. Citation2006) and with sub-lethal doses of triazole fungicides (Magan et al. Citation2002; Becher et al. Citation2010). Nevertheless, BUT was the only mycotoxin that showed a consistent pattern across all Fusarium species, with higher accumulations following exposure to increased concentrations of ferulic acid. BUT is a lactone synthesised from amino acids by trichothecene producing Fusarium species (Desjardins Citation2006). It has been subject to a very limited amount of studies and an accelerated production in relation to supplemented antioxidants has not yet been described.
With respect to quercetin and rutin and depending on the concentrations employed, increased mycotoxin production occurred in all Fusarium species. For FG and FP with quercetin and rutin treatments, the observed increase of toxin accumulations seemed to be limited to low concentrations. As the effect varied highly depending on the mycotoxin and the phenolic compound concentration, their possible role in the biochemical pathway of toxigenic fungal species is not clear but might be due to depletion of the phenolic compound or due to the induction of stress through sub-lethal concentrations.
Interestingly, FG and FP produced high amounts of AUF in all control treatments. The mycelial pigment AUF is a mycotoxin of the naphthoquinones family and amongst others responsible for the colour of Fusarium cultures (Desjardins Citation2006). Inhibition of mycelial growth leads to an accelerated production of naphthoquinones (reviewed in Medentsev and Akimenko Citation1998). High ferulic acid concentrations inhibited mycelial growth of FG and FP, however, instead of seeing an increase in AUF production it was substantially decreased with increasing concentrations of ferulic acid.
With the exception of BUT and DAS produced by FL, an inhibitory effect on mycotoxin production was observed from p-hydroxybenzoic acid and vanillic acid treatments for all Fusarium species although mycelial growth was not impaired. Indeed, a dose dependent deviation between the phenolic acid effect on growth on the one hand and the mycotoxin production on the other hand was also described by Ferruz et al. (Citation2016) and Ferrochio et al. (Citation2013). Both authors suggested that inhibitory mechanisms on mycelial growth might be independent from mechanisms that inhibit mycotoxin production.
The incubation temperature (18°C) used in our experiment was rather low, which is adequate for mycelium growth but maybe not sufficient for the production of DON and NIV by FG and FP, respectively (Hope et al. Citation2005). However, the branching point intermediate of the type B trichothecene pathway decalonectrin was measured from samples colonised with FG and FP, suggesting that DON and NIV production was possibly delayed. Hence, incubation at a range of temperatures up to 25°C and measurements after 10 or 14 days post inoculation could disclose if the inhibition of growth and mycotoxin synthesis is temperature and/or time dependent.
Most phenolic compounds tested in this study showed highly differential effects depending on the class of mycotoxin and the fungal species. As the majority of available reports focus on the effect of phenolic compounds on trichothecene biosynthesis, further investigations are needed to assess the proposed mycotoxigenesis modulating effect in other toxin pathways in vitro and in planta. More importantly, research should be extended to further Fusarium species. Following up on this study, monitoring kinetic gene expression by RT-qPCR would allow a more detailed insight into the dynamics of inhibition by phenolic compounds, especially for those exhibiting diverse effects. Furthermore, possible degradation of supplemented phenolic compounds should be controlled throughout the course of the experiment. In addition, interactions between different phenolic compounds which frequently co-occur in cereal grains deserve further investigation. For example, McKeehen et al. (Citation1999) studied the phenolic profile of six wheat varieties from heading to maturity and concluded that the accumulation of ferulic acid was positively correlated to Fusarium resistance of the variety. Moreover, the effect of induced resistance due to either a high endogenous concentration in the plant or application of a phenolic compound in low doses could be a valuable input for future breeding programmes. The clear inhibitory effect of ferulic acid on mycelial growth and mycotoxin production in this work implies its potential as a biomarker metabolite for the screening of Fusarium resistant cereal cultivars.
Supplemental Material
Download PDF (338.2 KB)Supplemental Material
Download PDF (338.9 KB)Supplemental Material
Download PDF (339.7 KB)Supplemental Material
Download PDF (338.3 KB)Acknowledgments
This work was funded by the Swiss National Science Foundation in the frame of the national research programme ‘Healthy Nutrition and Sustainable Food Production’ (NRP 69) [grant number 406940_145210].
Disclosure statement
No potential conflict of interest was reported by the authors.
Supplementary Material
Supplemental data for this article can be accessed on the publisher’s website
Additional information
Funding
Related Research Data
References
- Abdel-Aal E-SM, Young JC, Rabalski I. 2006. Anthocyanin composition in black, blue, pink, purple, and red cereal grains. J Agric Food Chem. 54:4696–4704.
- Adom KK, Liu RH. 2002. Antioxidant activity of grains. J Agric Food Chem. 50:6182–6187.
- Atanasova-Penichon V, Barreau C, Richard-Forget F. 2016. Antioxidant secondary metabolites in cereals: potential involvement in resistance to Fusarium and mycotoxin accumulation. Front Microbiol. 7.
- Bates D, Mächler M, Bolker B, Walker S. 2015. Fitting linear mixed-effects models using lme4. J Stat Softw. 67:1–48.
- Becher R, Hettwer U, Karlovsky P, Deising HB, Wirsel SGR. 2010. Adaptation of Fusarium graminearum to tebuconazole yielded descendants diverging for levels of fitness, fungicide resistance, virulence, and mycotoxin production. Phytopathol. 100:444–453.
- Bilska K, Stuper-Szablewska K, Kulik T, Buśko M, Załuski D, Jurczak S, Perkowski J. 2018. Changes in phenylpropanoid and trichothecene production by Fusarium culmorum and F. graminearum sensu stricto via exposure to flavonoids. Toxins. 10:110.
- Bollina V, Kushalappa AC. 2011. In vitro inhibition of trichothecene biosynthesis in Fusarium graminearum by resistance-related endogenous metabolites identified in barley. Mycology. 2:291–296.
- Boutigny AL, Atanasova-Penichon V, Benet M, Barreau C, Richard-Forget F. 2010. Natural phenolic acids from wheat bran inhibit Fusarium culmorum trichothecene biosynthesis in vitro by repressing Tri gene expression. Eur J Plant Pathol. Jun. 127:275–286.
- Boutigny AL, Barreau C, Atanasova-Penichon V, Verdal-Bonnin MN, Pinson-Gadais L, Richard-Forget F. 2009. Ferulic acid, an efficient inhibitor of type B trichothecene biosynthesis and Tri gene expression in Fusarium liquid cultures. Mycol Res. 113:746–753.
- Boutigny A-L, Richard-Forget F, Barreau C. 2008. Natural mechanisms for cereal resistance to the accumulation of Fusarium trichothecenes. Eur J Plant Pathol. 121:411–423.
- Box GE, Cox DR. 1964. An analysis of transformations. J Royal Stat Soc Ser B (Methodological). 26:211–252.
- Buchner N, Krumbein A, Rohn S, Kroh LW. 2006. Effect of thermal processing on the flavonols rutin and quercetin. Rapid Commun Mass Spectrom. 20:3229–3235.
- Clemens R, van Klinken BJ-W. 2014. Oats, more than just a whole grain: an introduction. Br J Nutr. 112:S1–S3.
- Core Team R. 2015. R: A language and environment for statistical computing. R foundation for statistical computing. http://www.R-project.org/.
- Desjardins AE. 2006. Fusarium mycotoxins - chemistry, genetics, and biology. St. Paul (Minnesota): APS Press.
- Dykes L, Rooney LW. 2007. Phenolic compounds in cereal grains and their health benefits. Cereal Foods World. 52:105–111.
- Edwards S, Barrier-Guillot B, Clasen PE, Hietaniemi V, Pettersson H. 2009. Emerging issues of HT-2 and T-2 toxins in European cereal production. WMJ. 2:173–179.
- Emmons CL, Peterson DM, Paul GL. 1999. Antioxidant capacity of oat (Avena sativa L.) extracts. 2. In vitro antioxidant activity and contents of phenolic and tocol antioxidants. J Agric Food Chem.. 47:4894–4898.
- Ferrochio L, Cendoya E, Farnochi MC, Massad W, Ramirez ML. 2013. Evaluation of ability of ferulic acid to control growth and fumonisin production of Fusarium verticillioides and Fusarium proliferatum on maize based media. Int J Food Microbiol. 167:215–220.
- Ferruz E, Atanasova‐Pénichon V, Bonnin‐Verdal MN, Marchegay G, Pinson‐Gadais L, Ducos C, Lorán S, Ariño A, Barreau C, Richard‐Forget F. 2016. Effects of phenolic acids on the growth and production of T-2 and HT-2 toxins by Fusarium langsethiae and F. sporotrichioides. Molecules. 21:449.
- Gauthier L, Atanasova-Penichon V, Chéreau S, Richard-Forget F. 2015. Metabolomics to decipher the chemical defense of cereals against Fusarium graminearum and deoxynivalenol accumulation. Int J Mol Sci. 16:24839–24872.
- Hofgaard IS, Aamot HU, Torp T, Jestoi M, Lattanzio VMT, Klemsdal SS, Waalwijk C, Van der Lee T, Brodal G. 2016. Associations between Fusarium species and mycotoxins in oats and spring wheat from farmers’ fields in Norway over a six-year period. WMJ. 9:365–378.
- Hope R, Aldred D, Magan N. 2005. Comparison of the effect of environmental factors on deoxynivalenol production by Fusarium culmorum and F. graminearum on wheat grain. Lett Appl Microbiol. 40:295–300.
- Kadiri O. 2017. A review on the status of the phenolic compounds and antioxidant capacity of the flour: effects of cereal processing. Int J Food Prop. 20:798–809.
- Kalinova J, Radova S. 2009. Effects of rutin on the growth of Botrytis cinerea, Alternaria alternata and Fusarium solani. Acta Phytopathol Entomol Hung. 44:39–47.
- Kokkonen M, Jestoi M, Laitila A. 2012. Mycotoxin production of Fusarium langsethiae and Fusarium sporotrichioides on cereal-based substrates. Mycotoxin Res. 28:25–35.
- Kulik T, Stuper-Szablewska K, Bilska K, Buśko M, Ostrowska-Kołodziejczak A, Załuski D, Perkowski J. 2017. Sinapic acid affects phenolic and trichothecene profiles of F. culmorum and F. graminearum sensu stricto. Toxins. 9:264.
- Lattanzio V, Lattanzio VM, Cardinali A. 2006. Role of phenolics in the resistance mechanisms of plants against fungal pathogens and insects. Phytochem: Adv Res. 661:23–67.
- Lenth RV. 2016. Least-squares means: the R package lsmeans. J Stat Softw. 69:1–33.
- Magan N, Hope R, Colleate A, Baxter ES. 2002. Relationship between growth and mycotoxin production by Fusarium species, biocides and environment. Eur J Plant Pathol. 108:685–690.
- Malachova A, Sulyok M, Beltrán E, Berthiller F, Krska R. 2014. Optimization and validation of a quantitative liquid chromatography–tandem mass spectrometric method covering 295 bacterial and fungal metabolites including all regulated mycotoxins in four model food matrices. J Chromatogr. 1362:145–156.
- Masisi K, Beta T, Moghadasian MH. 2016. Antioxidant properties of diverse cereal grains: A review on in vitro and in vivo studies. Food Chem. 196:90–97.
- Mattila P, Pihlava JM, Hellström J. 2005. Contents of phenolic acids, alkyl- and alkenylresorcinols, and avenanthramides in commercial grain products. J Agric Food Chem. 53:8290–8295.
- McKeehen JD, Busch RH, Fulcher RG. 1999. Evaluation of wheat (Triticum aestivum L.) phenolic acids during grain development and their contribution to Fusarium resistance. J Agric Food Chem. 47:1476–1482.
- Medentsev A, Akimenko V. 1998. Naphthoquinone metabolites of the fungi. Phytochem. 47:935–959.
- Mohamed MS, Saleh AM, Abdel-Farid IB, El-Naggar SA. 2017. Growth, hydrolases and ultrastructure of Fusarium oxysporum as affected by phenolic rich extracts from several xerophytic plants. Pestic Biochem Physiol. 141:57–64.
- Osborne LE, Stein JM. 2007. Epidemiology of Fusarium head blight on small-grain cereals. Int J Food Microbiol. 119:103–108.
- Pani G, Dessì A, Dallocchio R, Scherm B, Azara E, Delogu G, Migheli Q. 2016. Natural phenolic inhibitors of trichothecene biosynthesis by the wheat fungal pathogen Fusarium culmorum: A computational insight into the structure-activity relationship. PloS one. 11:e0157316.
- Pinheiro J, Bates D, DebRoy S, Sarkar D, Team RC 2016. {nlme}: linear and nonlinear mixed effects models. https://CRAN.R-project.org/package=nlme.
- Ponts N, Pinson-Gadais L, Barreau C, Richard-Forget F, Ouellet T. 2007. Exogenous H2O2 and catalase treatments interfere with Tri genes expression in liquid cultures of Fusarium graminearum. FEBS Lett. 581:443–447.
- Ponts N, Pinson-Gadais L, Boutigny A-L, Barreau C, Richard-Forget F. 2011. Cinnamic-derived acids significantly affect Fusarium graminearum growth and in vitro synthesis of type B trichothecenes. Phytopathol. 101:929–934.
- Ponts N, Pinson-Gadais L, Verdal-Bonnin M, Barreau C, Richard-Forget F. 2006. Accumulation of deoxynivalenol and its 15-acetylated form is significantly modulated by oxidative stress in liquid cultures of Fusarium graminearum. FEMS Microbiol Lett. 258:102–107.
- Ripley B, Venables B, Bates DM, Hornik K, Gebhardt A, Firth D, Ripley MB 2013. Package ‘mass’. http://www.stats.ox.ac.uk/pub/MASS4/
- Schöneberg T, Jenny E, Wettstein FE, Bucheli TD, Mascher F, Bertossa M, Musa T, Seifert K, Gräfenhan T, Keller B, Vogelgsang S. 2018a. Occurrence of Fusarium species and mycotoxins in Swiss oats - Impact of cropping factors. Eur J Agron. 92:123–132.
- Schöneberg T, Martin C, Wettstein FE, Bucheli TD, Mascher F, Bertossa M, Musa T, Keller B, Vogelgsang S. 2016. Fusarium and mycotoxin spectra in Swiss barley are affected by various cropping techniques. Food Addit Contam Part A. 33:1608–1619.
- Schöneberg T, Musa T, Forrer H-R, Mascher F, Bucheli TD, Bertossa M, Keller B, Vogelgsang S. 2018b. Infection conditions of Fusarium graminearum in barley are variety specific and different from those in wheat. Eur J Plant Pathol. 151:975–989.
- Skadhauge B, Thomsen KK, Von Wettstein D. 1997. The role of the barley testa layer and its flavonoid content in resistance to Fusarium infections. Hereditas. 126:147–160.
- Stuper-Szablewska K, Kurasiak-Popowska D, Nawracała J, Perkowski J. 2017. Response of non-enzymatic antioxidative mechanisms to stress caused by infection with Fusarium fungi and chemical protection in different wheat genotypes. Chem Ecol. 33:949–962.
- Tukey JW. 1949. Comparing individual means in the analysis of variance. Biom. 5:99–114.
- Van Hung P. 2016. Phenolic compounds of cereals and their antioxidant capacity. Crit Rev Food Sci Nutr. 56:25–35.
- Vogelgsang S, Sulyok M, Bänziger I, Krska R, Schuhmacher R, Forrer HR. 2008. Effect of fungal strain and cereal substrate on the in vitro mycotoxin production by Fusarium poae and Fusarium avenaceum. Food Addit Contam. 25:745–757.
- Wu HS, Luo J, Raza W, Liu YX, Gu MA, Chen G, Hu XF, Wang JH, Mao ZS, Shen QR. 2010. Effect of exogenously added ferulic acid on in vitro Fusarium oxysporum f. sp. niveum. Scientia Horticulturae. 124:448–453.
- Zhao Y-M, Cheng Y-X, Ma Y-N, Chen C-J, F-R X, Dong X. 2018. Role of phenolic acids from the rhizosphere soils of Panax notoginseng as a double-edge sword in the occurrence of root-rot disease. Molecules. 23:819.