
ABSTRACT
Dietary exposure to nitrate and nitrite occurs via three main sources; occurrence in (vegetable) foods, food additives in certain processed foods and contaminants in drinking water. While nitrate can be converted to nitrite in the human body, their risk assessment is usually based on single substance exposure in different regulatory frameworks. Here, we assessed the long-term combined exposure to nitrate and nitrite from food and drinking water. Dutch monitoring data (2012–2018) and EFSA data from 2017 were used for concentration data. These were combined with data from the Dutch food consumption survey (2012–2016) to assess exposure. A conversion factor (median 0.023; range 0.008–0.07) was used to express the nitrate exposure in nitrite equivalents which was added to the nitrite exposure. The uncertainty around the conversion factor was taken into account by using conversion factors randomly sampled from the abovementioned range. The combined dietary exposure was calculated for the Dutch population (1–79 years) with different exposure scenarios to address regional differences in nitrate and nitrite concentrations in drinking water. All scenarios resulted in a combined exposure above the acceptable daily intake for nitrite ion (70 µg/kg bw), with the mean exposure varying between 95–114 µg nitrite/kg bw/day in the different scenarios. Of all ages, the combined exposure was highest in children aged 1 year with an average of 250 µg nitrite/kg bw/day. Vegetables contributed most to the combined exposure in food in all scenarios, varying from 34%–41%. Food additive use contributed 8%–9% to the exposure and drinking water contributed 3%–19%. Our study is the first to perform a combined dietary exposure assessment of nitrate and nitrite while accounting for the uncertain conversion factor. Such a combined exposure assessment overarching different regulatory frameworks and using different scenarios for drinking water is a better instrument for protecting human health than single substance exposure.
GRAPHICAL ABSTRACT
Introduction
Nitrate and nitrite are important intermediates of plant nitrogen metabolism and as such are constituents (and contaminants) of vegetable foods, particularly in leafy green vegetables and root vegetables (JECFA Citation2003; EFSA Citation2017a, Citation2017b). Nitrate and nitrite can also be present in drinking water (i.e. tap water), because of the contamination of groundwater and surface water as a result of manuring and fertilisation practices (WHO Citation1998). Additionally, sodium and potassium nitrate are approved as food additives and are used as preservatives in cheese, certain meat products, and pickled herring and sprat (EC No Citation1333/2008). Nitrite is also used as a food additive in the form of sodium nitrite and potassium nitrite in meat products and certain meat preparations (EC 2008). Due to the regulation of nitrate and nitrite by these different regulatory frameworks, the total exposure of nitrate and nitrite is often not assessed, as is the consequent risk that may be involved.
Nitrate and nitrite in food and drinking water are easily absorbed in the human gastrointestinal tract. Once absorbed, nitrate is concentrated in the salivary glands and excreted in saliva where oral microflora can reduce it to nitrite (Gangolli et al. Citation1994; Dich et al. Citation1996; EFSA Citation2017b). The adverse effects of nitrate in humans are a consequence of its conversion to nitrite, as exposure to nitrite can result in the formation of met-haemoglobin. Met-haemoglobin prevents normal oxygen delivery and is normally regenerated to haemoglobin by cytochrome b5 reductase. However, the regenerative capacity of cytochrome b5 reductase may be depleted by high exposure to nitrite (via nitrate) resulting in high met-haemoglobin concentrations. Such high met-haemoglobin concentrations translate to a reduced capacity to transport oxygen to tissues potentially resulting in hypoxia (Mensinga et al. Citation2003). Nitrite, in conjunction with secondary amines from proteins, can also form nitrosamines in the acidic environment of the stomach. Several of these so-called endogenously formed nitrosamines, particularly the volatile N‐nitrosodimethylamine (NDMA) and N‐nitrosodiethylamine (NDEA), are classified as probably or highly likely carcinogenic to humans (IARC 2A; IARC Citation1987; EPA Citation2015). Such nitrosamines can also be generated in foods, e.g. in processed cured meat products and/or during high-temperature heating of meat products.
In Europe, the acceptable daily intake (ADI) level for nitrate is 3.7 mg nitrate ion/kg bw, and 0.07 mg nitrite ion/kg bw for nitrite (SCF Citation1997; EFSA Citation2017a, Citation2017b). The European Food and Safety Authority (EFSA) derived the ADI for nitrite, based on a bench mark dose (BMD) approach for elevated met-haemoglobin levels that were observed in both humans and animals (EFSA Citation2017b). The Scientific Committee on Food (SCF) derived the ADI for nitrate on a no observed adverse effect level in a 2-year rat study based on hypertrophy of the adrenal zona glomerulosa (SCF Citation1997). Yet, in a re-evaluation of nitrate in 2017, EFSA considered met-haemoglobin formation, induced by nitrite formed from nitrate excreted in the saliva, as the most critical effect of nitrate. (EFSA Citation2017a). Using the currently available human secretion rates of nitrate into the saliva and the conversion rates of nitrate to nitrite, EFSA assessed the nitrate-equivalents of the ADI for nitrite. This resulted in a value that would range between 1.05 and 9.4 nitrate ion/kg bw/day and EFSA concluded that the current ADI of 3.7 mg nitrate ion/kg bw would still be accurate.
Because of the conversion of nitrate to nitrite in food and their related toxicity, single substance risk assessment may result in an underestimation of their risk. It is therefore appropriate to combine the exposure of nitrate and nitrite for an exposure assessment. This has also been acknowledged by regulatory bodies (JECFA Citation1995), but is not yet standard practice. We performed a combined exposure assessment for the Dutch population by expressing nitrate exposure as nitrite toxicological equivalents using the range calculated by EFSA, and subsequently adding this to the nitrite exposure. By calculating the exposure to nitrite, resulting from the combined exposure to nitrate and nitrite, we will not underestimate the risk of nitrate or nitrite intake alone.
The combined exposure was estimated using the Monte Carlo Risk Assessment (MCRA) tool, which can take the uncertainties towards the nitrate conversion to nitrite into account. The combined exposure assessment of nitrate and nitrite from all dietary sources was assessed for the Dutch population aged 1–79 years. Regional differences in nitrate and nitrite concentrations we observed in Dutch drinking water. To assess the impact of these regional high concentrations on the total exposure to nitrate and nitrite, we considered multiple scenarios with varying nitrate and nitrite concentrations in drinking water. In addition, we also considered a possible future high nitrate scenario where the nitrate concentration equals the WHO, EU and the national drinking water limit of 50 mg/l (Drinkwaterbesluit Citation2011 Annexe A; EU 1998; WHO Citation2003).
Materials and methods
Concentration data
Nitrate concentrations in vegetables over the years 2012 to 2017 were obtained from the Quality Agricultural Product (KAP), which contains data obtained from the Dutch monitoring programme performed by the Netherlands Food and Consumer Product Safety Authority (NVWA). Nitrate and nitrite concentrations in the meat products ‘ham’, ‘Frankfurter sausages’, ‘boterhamworst’ (typical Dutch meat product), ‘meat balls’, ‘frikandel’ (typical Dutch meat product) and ‘hamburgers’ were obtained from a survey of the NVWA in 2018. The samples from the KAP database and NVWA survey were obtained from Dutch retail stores and distribution centres. Detailed information on the total number of samples and concentrations obtained from the KAP and NVWA survey, and a comparison to the data used by EFSA (Citation2017a) is listed in Table S1. Other nitrate and the nitrite concentrations in food that were not available in the KAP database or from the NVWA survey, such as nitrite in vegetables and fruit, were obtained from two EFSA opinions on the re-evaluation of the safety of nitrate and nitrite used as food additives (EFSA Citation2017a, Citation2017b). Recent nitrate and nitrite concentrations in drinking water were obtained from the Dutch monitoring programme for drinking water (Rewab) between 2012–2017. Similar to the strategy used by EFSA (EFSA Citation2017a, Citation2017b), a middle bound approach was used. In this approach, non-detect samples were assumed to contain nitrate or nitrite at a concentration equal to half the level of detection (LOD/2) or the level of quantification (LOQ/2), depending on the availability.
Food consumption data
Food consumption data was obtained from the Dutch National Food Consumption survey 2012–2016. This survey covers the dietary habits of the Dutch population aged 1 to 79 years (Van Rossum et al. Citation2018; VCP website) and is based on dietary consumption on two non-consecutive days of 4313 participants. The data were obtained via different ways by trained dietitians using the standardised GloboDiet software. For participants of 16 to 69 years, the dietary 24-hour recalls were performed by telephone interviews. Children in the age of 9 to 15 years were subjected to the same 24-hour recall method carried out face-to-face in the presence of parents/care takers. For participants aged 1 to 8 years and 70 to 79 years the 24-hour recalls were diary-assisted and for these children the parents were interviewees. In order to obtain all the information on the food intake, care takers (e.g. in school or day-care) filled in the diaries in addition to the parents. Portion sizes were estimated by direct indications of weight (g), volume (ml), household measures (e.g. glasses, cups, spoons) or units (e.g. egg, candy bar, tomato). A picture book was also provided to all participants as one of the ways to estimate portion sizes. Food consumption data were weighted for small deviations in socio-economic status and regional origin of the participants. The design of the food diaries and the use of food diaries in combination with a GloboDiet interview are according to recommendations in Ocké et al. (Citation2012). For more details, see Van Rossum et al. (Citation2018) and the recommended use of the food consumption data collection method in the EFSA Guidance on the EU Menu methodology (EFSA Citation2014).
Linkage food to concentration data
Nitrate and nitrite concentrations in foods are often measured in raw agricultural products. To link the concentrations in foods as measured to consumed foods, a food conversion table was used. This model was developed in 1995 (VanDooren et al. Citation1995) and has since been updated with every new food consumption survey to include new foods. The food conversion model describes the food as consumed in terms of mass percentages based on recipes (e.g. the percentages apple, raisins, sugar, wheat flour, butter and eggs in an apple pie) and translates ingredients into raw agricultural products (e.g. raisins into grapes and wheat flour into wheat). It also accounts for changes in food weight due to processing (e.g. shrinking of vegetables due to cooking) and describes processes (e.g. peeling or juicing of fruit) to be able to take into account processing factors. For nitrate, processing factors other than weight loss due to, e.g. shrinking, such as boiling, washing, grilling and deep frying that take into account loss or increase in nitrate concentration due to processing were available in the literature (Table S2). No processing factors were available for nitrite.
Estimation of conversion factors
The combined exposure to nitrate and nitrite was calculated using a conversion factor to express the nitrate concentration in nitrite-equivalents, based on the conversion factors from EFSA (EFSA Citation2017a). The ADI for nitrite of 0.07 mg nitrite ion/kg bw/day is based on a doubling of baseline met-haemoglobin blood concentrations in male rats (EFSA Citation2017b). EFSA posed in its re-evaluation of nitrate that the elevated met-haemoglobin levels would also be a relevant effect for nitrate, but that appropriate animal studies were unavailable for the derivation of a health-based guidance value. Therefore, EFSA used the animal study for nitrite, which was used to derive the HBGV, to calculate the nitrate-equivalents for the ADI of nitrite. EFSA calculated that the nitrate-equivalent of the ADI of nitrite is uncertain, but would have a value between 1.05 and 9.4 nitrate ion/kg bw/day. This corresponds to a conversion factor between 0.07/1.05 = 0.07 and 0.07/9.4 = 0.008. The limit values 0.008 and 0.07 were equated to the 2.5th and 97.5th percentile points of the conversion factor uncertainty distribution, assuming that this range of conversion factors follow a lognormal distribution. The median conversion factor for nitrate to nitrite was 0.023. If uncertainty was not considered, the intake of nitrate was multiplied by this median conversion factor to obtain the nitrite-equivalents of the intake concentrations, and subsequently added to the nitrite intake. The uncertainty around this median conversion factor was taken into account as described below. Note that in MCRA conversion factors are termed as relative potency factors.
Exposure calculations
Long-term dietary exposure assessment was modelled using version 8.2 of the MCRA tool that is available for registered users (MCRA, https://mcra.rivm.nl/). Several statistical methods for probabilistic long-term exposure (or usual intake) have been described (Nusser et al. Citation1996; Dodd et al. Citation2006; Tooze et al. Citation2010; Goedhart et al. Citation2012). All these methods estimate the distribution of long-term exposures in a population of individuals, and are based on linear models with variance components describing both the variation between individuals and the variation between days of the same individual (see, e.g. Roodenburg et al. (Citation2013) for more explanation). The Logistic Normal-Normal (LNN) model was used to calculate the intake, with age as co-variable. The LNN model can address situations with zero exposure on part of the survey days, modelling the frequencies of exposure with a logistic-normal (LN) submodel (i.e. estimating the logit of the probability of exposure) and modelling the amounts with a normal (N) submodel on an appropriately chosen scale (here the log scale). The model corrects the variation in long-term exposure between individuals for the within individual variation and therefore describes the usual intake distribution better than simple models such as the observed individual of means (OIM) method. This model is considered as the model of first choice for usual intake calculations (Goedhart et al. Citation2012; Van Klaveren et al. Citation2012). An important prerequisite for the use of LNN is that the logarithmic transformed positive daily exposure distribution is approximately normally distributed. In this study, the use of LNN modelling was justified, with some overestimation of the higher exposure percentiles as shown in Supplemental Table S3. In more detail, all daily consumption patterns were multiplied with the mean concentration of nitrite per consumed food and summed over foods consumed per day per individual. For nitrate, the same calculation was made, but additionally, the estimated exposures were multiplied by the median conversion factor. Next, the daily consumption of nitrite and nitrate expressed in nitrite-equivalents were summed per consumption day per individual. Finally, the estimated exposure on a consumption day was divided by the individual’s body weight. The LNN model (Goedhart et al. Citation2012) was then fitted to the daily exposures to estimate the long-term exposure distribution for individuals.
Some of the uncertainties regarding the input data used (concentration, food consumption, processing factors and conversion factor) were quantified using the bootstrap approach (Efron Citation1979; Efron and Tibshirani Citation1993). This approach resamples (with replacement) the original dataset to obtain a bootstrap sample (or resampled set) of again n observations, representing uncertainties due to the limited sampling size. By repeating this process many times, one obtains a large number of resampled sets, which may be considered as alternative data sets that might have been obtained during sampling from the population of interest. In the present calculation, we performed an uncertainty analysis using 100 resample cycles with 10000 iterations. The uncertainty around the conversion factor of nitrate with regards to nitrite-equivalents was accounted for by using a randomly drawn factor from the conversion factor uncertainty distribution in each of the 100 uncertainty cycles. The uncertainties were summarised by calculating a 95% uncertainty interval around the percentiles of exposure.
Exposure scenarios
Regional differences in nitrate and nitrite concentrations were observed in Dutch drinking water (data described below). There was no correlation between regional high nitrate concentration and regional high nitrite concentration. To assess the impact of these regional high concentrations on the total exposure to nitrate and nitrite, we performed multiple exposure scenarios ():
Based on the national mean concentration of nitrate (4.7 mg nitrate ion/l) and nitrite (0.005 mg nitrite ion/l) in drinking water
Based on the national mean concentration of nitrate (4.7 mg nitrate ion/l) and the highest regional mean for nitrite (0.03 mg nitrite ion/l drinking water)
Based on the highest regional mean concentration for nitrate (35 mg nitrate ion/l drinking water) and the national mean of nitrite in drinking water (0.005 mg nitrite ion/l);
Based on a possible future high concentration for nitrate of 50 mg nitrate ion/l drinking water and the national mean for nitrite in drinking water (0.005 mg nitrite ion/l; future scenario).
Table 1. Overview of nitrate and nitrite concentrations in the different exposure scenarios.
Results
Concentration data
First, the nitrate and nitrite concentration in Dutch drinking water were determined from samples from on average 185 separate drinking water production stations which are broadly distributed across the country. The data is shown as minimum, mean and maximum concentrations of all stations in the Netherlands and maximum mean concentrations in one production station over a period of 5 years (). The mean nitrate concentration in the Netherlands over the period 2012–2017 was 4.7 mg nitrate ion/l, where the mean maximum regional nitrate concentration over that period was 36 mg nitrate ion/l. The mean nitrite concentration in the Netherlands over the period 2012–2017 was 0.0054 mg nitrite ion/l, and the mean maximum regional nitrite concentration over that period was 0.03 mg nitrite ion/l.
Table 2. Overview of nitrate and nitrite concentrations in drinking water measured in on average 185 Dutch regions between 2012–2017.
Nitrate and nitrite concentrations were measured in various Dutch meat products and vegetables and described in Table S1. The highest mean nitrate and nitrite concentrations were measured in dry sausage with 29.1 mg nitrate/kg and 11.9 mg nitrite/kg. The lowest mean nitrate and nitrite concentrations measured were in frikandel with 5.9 mg nitrate/kg and 6.7 mg nitrite/kg. In vegetables, the highest mean nitrate concentration was measured in one parsley sample with 3190 mg nitrate/kg (Table S1). The mean concentration of (33 samples) lambs lettuce was 2010 mg nitrate/kg. The lowest mean nitrate concentration measured was in carrot with 73.4 mg nitrate/kg.
Exposure assessment
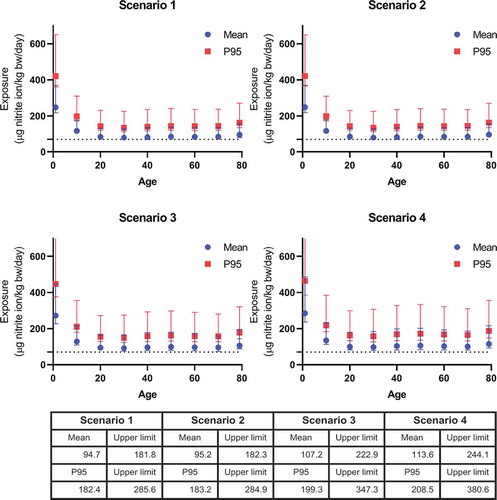
shows the mean and P95 dietary exposure (including drinking water) to nitrite resulting from the combined nitrate and nitrite exposure as a function of age. In all scenarios, the total combined dietary exposure to nitrite exceeded the ADI of 0.07 mg nitrite/kg bw/day, with a mean exceedance of 1.4–1.6-fold for the different scenarios (). Of all age groups, the combined exposure to nitrate and nitrite was highest in children aged 1 year with an average of 0.25 mg nitrite ion/kg bw/day and P95 of 0.42 mg nitrite ion/kg bw/day in scenario 1. In that scenario, the exposure of the age group 1 year was 3.5-fold (CI 3.1–5.3) the ADI. In the other scenarios, this was 3.6-fold (CI 3.1–5.3), 3.9-fold (CI 3.2–6.4), and 4.1-fold (CI 3.4–6.9) the ADI, respectively. The mean exposure in this age group was 2–2.5 higher than the mean of all age groups in the different scenarios.
Figure 1. Mean and high (upper 5th percentile) exposure to nitrite resulting from the combined exposure to nitrate and nitrite from all dietary sources (including confidence interval) as a function of age. Lower panel describes the mean total dietary exposure and upper limits across all ages (1–79 years). Scenario 1 assumes the intake of nitrate and nitrite at mean concentration in food and at the national mean concentrations in drinking water. Scenario 2 assumes the intake of nitrate and nitrite at mean concentrations in food and high regional nitrite level and the national mean concentration for nitrate in drinking water. Scenario 3 assumes the intake of nitrate and nitrite at mean concentrations in food and high regional nitrate concentration and the national mean concentration for nitrite in drinking water. Scenario 4 assumes the intake of nitrate and nitrite at mean concentrations in food and possible future high regional nitrate concentration and the current national mean level for nitrite in drinking water.
The main contributors to total and high dietary exposure percentiles (P95) estimate for nitrate and nitrite for the Dutch population are shown in , Tables S4 and S5 for the four drinking water exposure scenarios. The relative contribution is shown for the whole population (age 1–79), but did not shift when calculated for the individual age groups (data not shown).
Figure 2. The relative contribution of food groups to the total exposure of nitrite resulting from the combined dietary exposure to nitrate and nitrite from all dietary sources (food additive use, natural occurrence and as contaminant in food) for the Dutch population aged 1 − 79 years assuming four different scenarios for nitrate and nitrite concentrations in drinking water.
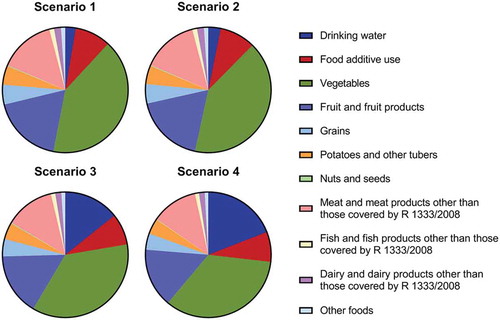
Drinking water relatively contributed 3% to the total dietary exposure of nitrate and nitrite in scenario 1. This contribution increased about 5-fold to 14% in scenario 3, increased about 7-fold to 19% in scenario 4 but did not change in scenario 2.
Food additive use relatively contributed 9% to the total exposure of nitrate and nitrite in scenario 1. This marginally changed to 8% when assuming the other exposure scenarios.
The remaining dietary exposure to nitrate and nitrite was accounted for by contaminants in food. For scenario 1, the relative contribution of this group was 88%. Vegetables accounted for the majority (41%) of this exposure, followed by fruit and fruit products (18%). The relative contributions of grains, and potatoes and other tubers were for both 5%. The contribution of meat and meat preparations where the use of nitrates and nitrites is not allowed was 15%. When assuming scenario 4, the relative contribution of vegetables decreased to 34%, whereas the contribution of the other groups only marginally changed.
In addition, the relative contribution of nitrate and nitrite to the total combined dietary exposure of nitrite was calculated for all the different exposure scenarios (Table S6). In scenario 1, the relative contribution of nitrate was 30% and nitrite was 70%. A regional high concentration for nitrite in drinking water (scenario 2) resulted in a negligible shift in relative contribution. A regional high concentration for nitrate (scenario 3) resulted in a relative contribution of 38% for nitrate and 62% for nitrite. When assuming a possible future scenario of very high regional nitrate concentrations (scenario 4), the relative contribution of nitrate was 42% and nitrite was 58%.
presents the relative contribution of food groups to the combined exposure of nitrate and nitrite within a certain regulatory framework (food additive use and contaminants in vegetables as this being the most contributing group in this category). Meat products contributed 56% to the total combined exposure due to food additive use, cheese 43%, and herring and sprat 1%. Fruiting vegetables like tomatoes and zucchini contributed most to the total exposure due to vegetables with 39%, followed by leafy vegetables with 29%. The contribution of legumes and fungi to the total exposure of nitrate and nitrite was negligible. An exposure assessment for children aged 1–3 was performed separately, but this did not result in a change of the most contributing factors, i.e. vegetables and fruit (data not shown).
Table 3. Relative contribution of food categories to the exposure of nitrite resulting from the combined exposure (mean and P95) of nitrate and nitrite due to food additive use and contaminants in vegetables for the Dutch population aged 1 − 79 years.
Discussion
As nitrate can be converted to nitrite in the human body, their risk should be assessed based on their combined exposure rather than exposure to the single compounds. In the present study, we performed such a combined exposure assessment from all dietary sources, where we accounted for the uncertainties regarding the conversion factor from nitrate to nitrite. Different exposure scenarios were performed to address the impact of regional differences of nitrate and nitrite in drinking water (). A possible future scenario using the current (inter)national maximum nitrate limit for drinking water was also considered, as currently there are concentrations in some Dutch drinking water production stations that already approach these limits (). As high nitrate concentrations did not correlate with high nitrite concentrations for regional drinking water production stations, it was considered not relevant to assume a scenario where both nitrate and nitrite concentrations in drinking water were as high as independently regionally measured (data not shown).
We estimated that the combined dietary exposure to nitrite resulting from the combined exposure to nitrate and nitrite exceeded the nitrite ADI for every scenario, with an average of 1.7-fold for all age groups and 3.5-fold for children aged 1 year. No food consumption data was available to justify an exposure assessment for children from 0 to 1 year old in the Dutch population. EFSA performed separate exposure assessments for nitrate and nitrite, and also found that exposure to nitrate as well as nitrite from all sources exceeded their respective ADI (EFSA Citation2017a, Citation2017b). In children aged 1–2.5 years (‘toddlers’), the mean dietary exposure varied between 2.3–4.2 mg nitrate ion/kg bw/day and 0.1–0.15 mg nitrite ion/kg bw/day. Across all age groups (excluding infants age 0–1 year), the mean dietary exposure varied between 1.5–2.9 mg nitrate ion/kg bw/day and 0.05–0.09 mg nitrite ion/kg bw/day. The exposure estimate for the 95th percentiles across all age groups varied between 2.6–6.2 mg nitrate ion/kg bw/day and 0.09–0.015 mg nitrite ion/kg bw/day. To compare the results from EFSA to our study, we combined their separate dietary exposure estimates to nitrate and nitrite. For this purpose, the median conversion factor of 0.02 was applied to the above mentioned mean dietary nitrate exposure estimates in all age groups to convert nitrate into nitrite-equivalents. To calculate the combined exposure, we added the nitrite ion equivalents from both exposure assessments, which resulted in a mean daily exposure to 0.15–0.23 mg nitrite ion/kg bw/day in children aged 1–2.5 years and 0.08–0.15 mg nitrite ion/kg bw/day for all ages. These estimates are in accordance with our results where we found a slightly higher combined mean daily exposure of 0.25 mg nitrite ion/kg bw/day for children aged 1 year and a comparable exposure of 0.09 mg nitrite ion/kg bw/day across all age groups in scenario 1 ().
As endogenous nitrosamine formation is also an important adverse outcome upon nitrate and nitrite digestion, we calculated the endogenous nitrosamine formation using the mathematical model developed by Health Canada (Health Canada Citation2013). Based on the highest calculated mean combined dietary exposure (0.25 mg nitrite/kg bw/day in children aged 1 year) in scenario 1, we calculated an endogenous production of 8.4 × 10⁻⁷ mg nitrosamine/kg bw/day with the model (Health Canada Citation2013). When the BMDL10 for NDMA (0.027 mg/kg bw/day for liver neoplasms; SCCS Citation2011) is divided by this intake, it corresponds to a margin of exposure (MoE) of 3.2 × 10⁴. A MoE above the threshold of 1 × 10⁴ considered of low concern for public health (EFSA Citation2012). The P95 intake for children aged 1 year in scenario 1 is equivalent to the production of 2.4 × 10⁻⁶ mg nitrosamine/kg bw/day, which corresponds to an MoE of 1.1 × 10⁴. Yet, when calculating the MoE based on the upper confidence limit of both the mean (0.37 mg/kg bw/day) and the P95 (0.651 mg/kg bw/day) intake of children aged 1 year in scenario 1, this corresponds to a MoE higher than 1 × 10⁴ for the mean intake, but a MoE of 4757 for the upper limit P95 intake. Accordingly, the MoE in scenario 4 would be 8535 and 3073 for the upper limits for the mean (0.48 mg/kg bw/day) and P95 (0.81 mg/kg bw/day) intake, respectively. These MoEs are 1.2-fold and 3.3-fold lower than the threshold of 1 × 10⁴ which indicates that when tap water concentrations of nitrate regionally reach the (inter)national limits of 50 mg/l in the future, children may be exposed to nitrate and nitrite levels that are of concern with respect to nitrosamine formation because of high background nitrate and nitrite intake by food. However, this model was developed using adult parameters and needs further validation for young children.
The exposure to nitrate and nitrite via contaminants in food was relatively the most contributing source of exposure. Although vegetables were the most dominant factor in this food category, the benefits of leafy vegetables outweigh the exposure to nitrate and nitrite from these sources according to a risk benefit assessment of EFSA in 2008 (EFSA Citation2008). Endogenous nitrosamine formation, initiated by nitrite, tends to vary due to co-ingestion with substrates for nitrosamine formation, e.g. sources of secondary amines such as fish, as well as inhibitory factors, e.g. ascorbic acid which makes it difficult to quantify the amounts of endogenous formed nitrosamines and their subsequent untoward effects. Nonetheless, Zeilmaker et al. (Citation2010) calculated the risk of combined dietary exposure to nitrate from spinach (with data from an in vitro gastrointestinal model) and protein from fish (Zeilmaker et al. Citation2010). The overall calculated margin of exposure (MoE) was higher than 10 000, which is considered of low concern for public health.
Food additives contributed approximately 9% to the total exposure of nitrate and nitrite, mainly in meat products and cheese. Interestingly, nitrites are not allowed for the use as a food additive in cheese, yet nitrite levels were measured in cheese in addition to nitrate (19.9 mg/kg nitrate vs 7.7 mg/kg nitrite, EFSA Citation2017a, Citation2017b). Considering a conversion factor of 0.02, its nitrite content is more relevant than the nitrite-equivalence of its nitrate content (0.4 mg/kg). When neglecting nitrite as a consequence of nitrate use in cheese as a food additive, the risk of the dietary contribution of authorised nitrate in cheese is underestimated.
The overall mean drinking water concentrations of nitrate in the Netherlands (4.7 mg/kg), acquired from drinking water stations broadly distributed across the country, were relatively low compared to the mean drinking water concentrations in Europe of 7.9 mg/kg as used by EFSA in 2017 (EFSA Citation2017a). As such, the relative contribution of nitrate and nitrite present at average levels in drinking water were considered low in the Dutch population. Particularly the nitrite concentrations in drinking water hardly contributed to the dietary total exposure of nitrate and nitrite (, Table S4). Regional high nitrate concentrations in drinking water however do vastly contribute to the total dietary exposure of nitrate and nitrite. Although this scenario reflect high concentrations in a few independent regions (Houthuijs et al. Citationmanuscript in preparation), it clearly shows that such a scenario should be taken into account in risk assessment of the combined exposure to nitrate and nitrite. Recently, the health and economic impact of ingesting nitrate were assessed for the U.S.A. (Temkin et al. Citation2019). It was suggested that a lower intake of nitrate via drinking water could alleviate the incidence of nitrate-associated diseases (such as colorectal cancer and adverse birth outcomes) and thereby bring economic benefits in the form of medical and indirect costs. However, nitrite and nitrate intake from other sources was not included in this calculation. Since our data shows that drinking water is not a major contributor to the total exposure and other sources may have a higher contribution, it is appropriate to consider other sources of nitrate and nitrite exposure in such a nitrate-attributable health and economic impact assessment.
Uncertainties
lists general uncertainties for exposure assessment and some more specific for nitrate and nitrite that could not be quantified. Soft drink producers and breweries often use drinking water in their products. Producers of common soft drink and beer brands sold in national stores are equally spread across the Netherlands for which the average nitrate concentrations in drinking water ranged between 0.5 and 10 mg/l or, claimed to use own wells from depths with low nitrate and nitrite concentrations. Therefore, we assumed nitrate concentrations in water used for the production of soft drinks and beer equalled the Dutch mean for drinking water. In addition, we also assumed the Dutch mean drinking water concentrations for nitrate and nitrite for mineral water consumption. Yet, information declared on some labels of the bottles stated that the water contained <1 mg/l nitrate, <0.9 mg/l nitrate, 1.5 mg/l nitrate, and 2.8 mg/l for common brands sold in the Netherlands. Nonetheless, mean Dutch drinking water concentrations were used as not all brands declared the nitrate and/or nitrite levels in their products. These assumptions may have, however, resulted in an overestimation of the actual exposure.
Table 4. Overview of uncertainties in the current exposure assessment that could not be quantified and their assessed subsequent qualitative impact on exposure.
Literature reported lower background concentrations of nitrate and nitrite in unprocessed meat, compared to those used by EFSA in their dietary assessment (EFSA Citation2017a, Citation2017b; Iacumin et al. Citation2019) and in our assessment as we used the EFSA data for this food group. Some of these concentrations are more in line with levels reported in processed meat (Larsson et al. Citation2011; Temme et al. Citation2011; Lee Citation2018). This could be a consequence of misclassification of the meat products due to differences in interpretation between different meat products and meat production processes. It can also be a result of incorrect coding of analytical data in the standard sample description of EFSA. This uncertainty can result in a potential overestimation of the actual exposure because these levels were extrapolated to the whole food category of unprocessed meat. In contrast, the concentration data for vegetable products from the Dutch monitoring program that were used in the exposure assessment was comparable to the concentration data used by EFSA (Table S1.2).
Regarding fruit juice, we used in our intake calculations EFSA’s concentration data for nitrate in fruit juice, fruit and fruit products and the EFSA’s concentrations for nitrite in fruit and food products, rather than the concentrations of the individual ingredients, because limited concentration data were available for fruits. However, such juices are often produced from concentrated juices and diluted with drinking water for the final product. As such, it is difficult to discern the nitrate and nitrite concentrations originating from the fruit, or the concentrations resulting from adding the drinking water. This may both have resulted in either underestimation or overestimation of exposure as well as the relative contribution of fruit and drinking water to the exposure.
For the risk drivers fruit and fruiting vegetables (like tomatoes) and other vegetables such as brassica, the nitrite concentration is based on a small number of samples with a relatively high percentage of non-detects for nitrite. Also, the level of quantification was relatively high. This contributes to the uncertainties around the true exposure contribution of fruiting vegetables, brassica and fruits to exposure and substitution of non-detects with half the (high) value of the level of quantification may lead to an overestimation of exposure.
As shown in , a considerable confidence interval around the exposure estimate was observed, which was due to the large range of conversion factors for nitrate. This was confirmed with a sensitivity analysis where bootstrapping not taking into account the uncertainty around the median conversion factor resulted in the smallest ratio between the CI and the mean, as compared to other factors (Table S7). In our study, we used a median conversion factor (0.023) obtained from a log normal distribution of a defined 95% confidence interval of conversion factors (0.008–0.07). The uncertainty around the median conversion factor was taken into account by rerunning the exposure calculations 100 times with a conversion factor randomly sampled from the abovementioned range for each run. This differs from the approach in previous studies that examined the combined intake of nitrate and nitrite from food (e.g. Thomson et al. Citation2007; Larsson et al. Citation2011; Lee Citation2018). Thomson et al. (Citation2007) assessed the combined intake from nitrate and nitrite in New Zealand from different sources, but used a standard nitrate to nitrite conversion factor of 5% and a standard of 20% for adults with a high rate of conversion (Thomson et al. Citation2007). Larsson et al. (2012) assessed the combined intake of nitrate and nitrite in Swedish children, but used a standard conversion factor of 5%. Lee (Citation2018) also assessed the exposure of nitrate and nitrite in cured meats in the U.S.A. without the use of conversion factors to account for endogenous nitrite formation (Lee Citation2018). No fixed factor is available for the conversion from nitrate to nitrite because of the large variation in the reported extraction of absorbed nitrate in saliva (20–25%) and conversion of nitrate to nitrite in the mouth (5–36%), from which EFSA estimated a range for the overall conversion percentage between 1% and 9%. It should be noted that this conversion factor does not take into account the differences in the molecular weight between nitrate and nitrite. Using a conversion factor of 0.74 for the lower molecular weight of nitrite, the range of conversion factors between 0.7% and 7% is obtained, which is the range of the conversion factors used in our study (see methods). Using only one standard conversion factor does therefore not take into account interindividual variation, and may underestimate exposure (e.g. a conversion factor of 5%) or overestimate exposure (e.g. a conversion factor of 20%).
As humans differ in their nitrate to nitrite conversion rates, ideally a full probabilistic approach should be performed by random sampling from a distribution of conversion factors for each individual in the consumption data base to account for this variability. Because such an approach is not available yet, we used the described intermediate approach to quantify the uncertainties around the median conversion factor (0.023). The highest value of the confidence interval includes the highest conversion rates (0.07) i.e. subjects with a high conversion of nitrate to nitrite, whereas the lowest value of the confidence interval represents a low-conversion rate (0.008), i.e. subjects with a low nitrate to nitrite conversion. Even this lowest value of the confidence interval resulted in an exceedance of the ADI ().
Recommendation for future exposure assessment
In addition to the abovementioned full probabilistic approach to account for the variability in nitrate to nitrite conversion, more research dedicated towards the conversion of nitrate to nitrite is warranted to refine future combined exposure assessments of these compounds. This is also supported by the recommendations given by EFSA (EFSA Citation2017a). If the uncertainty in the range of these conversion factors can be reduced, a more precise assessment can be performed.
We recommend obtaining more detailed information on the concentration of nitrate and nitrite in fruits, fruiting vegetables and fruit products. Because of the limited concentration data, we used concentration data reported by EFSA that were aggregated at the first classification level. As Boon et al. (Citation2009) reported a large variation in nitrate concentrations in specific fruits (with varying nitrate concentrations in orange of 0.2 mg/kg; in apple of 33 mg/kg; in strawberry of 133 mg/kg; and in papaya of 400 mg/kg), classification of these products in ‘higher’, more specific, levels of the classification system will result in more refined exposure estimates.
An exposure to a certain compound that exceeds its respective ADI may call for risk mitigation actions. When that compound falls under multiple legislations, risk managers need to know the main sources of exposure and the associated regulatory frameworks. Although the analysis in the final food consumed is generally regarded as the best method to generate concentration data for an exposure assessment due to lower uncertainties, it does not allow discrimination between ingredients. As such, the associated regulatory frameworks of the individual ingredients can often not be identified for so-called composite foods (i.e. food products made of different ingredients, such as soup consisting of ingredients like drinking water, various vegetables and meat products, each containing different amounts of, e.g. nitrate and nitrite). Using concentration data at the ingredient level allows tracing back to the main sources of exposure, as well as the associated regulatory frameworks. Using such concentration data in an exposure assessment can therefore provide risk managers with a better insight into the most effective mitigation measures.
To better assess the contribution of drinking water to the combined exposure to nitrate and nitrite, it is also useful to consider the national and/or regional nitrate and nitrite concentrations in drinking water. As the Dutch mean drinking water concentration of nitrate was approximately 1.7-fold lower compared to the concentration used by EFSA, variation in national drinking water levels in Europe can be expected. This means that the EFSA calculations may underestimate or overestimate the exposure of individual member states because of these varying national drinking water concentrations. Therefore, to allow for better evidence-based risk management decisions, scenarios reflecting the regional differences in drinking water should be taken into account as we did in the current assessment.
Conclusion
To our knowledge, this is the first study to perform a combined dietary exposure assessment of nitrate and nitrite from all sources and accounting for the uncertain conversion factor for nitrate to nitrite. Such a combined exposure assessment to nitrate and nitrite, which overarches regulatory frameworks by including all dietary sources of these compounds, together with different scenarios for regional differences in drinking water, provides a better instrument for protecting human health than single substance exposure. This provides risk managers better insight in which possible mitigation measures would be most effective to reduce exposure. For future risk assessments, we therefore greatly recommend to consider a combined dietary exposure from all sources for nitrate and nitrite taking into account the uncertainty around the conversion factor and using different scenarios for drinking water.
Supplemental Material
Download MS Word (767.3 KB)Acknowledgments
This was financially supported by program 5 of the Dutch Ministry of Public Health, Welfare and Sports. The authors would like to extend their gratitude to Polly Boon and Marco Zeilmaker of the RIVM for their helpful comments while reviewing this manuscript; to Henk van der Schee and Peter Verheijen for providing the analytical data from the NVWA; and to Harald Dik from the RIVM for providing statistical data of nitrate and nitrite levels in food.
Disclosure statement
No potential conflict of interest was reported by the author.
Supplementary material
Supplemental data for this article can be accessed on the publisher’s website.
Additional information
Funding
References
- Boon PE, Bakker MI, Van Klaveren JD, Van Rossum CTM. 2009. Risk assessment of the dietary exposure to contaminants and pesticide residues in young children in the Netherlands. National Institute for Public Health and the Environment (RIVM) Report 350070002/2009.
- Dejonckheere W, Steurbaut W, Drieghe S, Verstraete R, Braeckman H. 1994. Nitrate in food commodities of vegetable origin and the total diet in Belgium (1992–1993). Microbiol Aliments Nutr. 12:359–370.
- Dich J, Järvinen R, Knekt P, Penttilä PL. 1996. Dietary intakes of nitrate, nitrite and NDMA in the finnish mobile clinic health examination survey. Food Addit Contam. 13(5):541–552. https://www.ncbi.nlm.nih.gov/pubmed/8799716.
- Dodd KW, Guenther PM, Freedman LS, Subar AF, Kipnis V, Midthune D, Tooze JA, Krebs-Smith SM. 2006. Statistical methods for estimating usual intake of nutrients and foods: a review of the theory. J Am Diet Ass. 106:1640–1650.
- Drinkwaterbesluit. 2011 May 23. https://wetten.overheid.nl/BWBR0030111/2011-07-01#Hoofdstuk3
- Efron B. 1979. Bootstrap methods: another look at the Jackknife. Annal Stat. 7(1):1–26. https://projecteuclid.org/euclid.aos/1176344552
- Efron B, Tibshirani RJ. 1993. An introduction to the bootstrap. London: Chapman & Hall/CRC.
- [EFSA] European Food and Safety Authority. 2012. Statement on the applicability of the margin of exposure approach for the safety assessment of impurities which are both genotoxic and carcinogenic substances added to food/feed. EFSA J. 10(3):2578. https://www.efsa.europa.eu/en/efsajournal/pub/2578.
- [EFSA] European Food and Safety Authority. 2014. Guidance on the EU Menu methodology. EFSA J. 12(12):3944. https://efsa.onlinelibrary.wiley.com/doi/epdf/10.2903/j.efsa.2014.3944.
- [EFSA] European Food and Safety Authority ANS Panel. 2017a. Re-evaluation of potassium nitrate (E 251) and sodium nitrate (E 252) as food additives. EFSA J. 15(6):4787, 123. https://efsa.onlinelibrary.wiley.com/doi/epdf/10.2903/j.efsa.2017.4787.
- [EFSA] European Food and Safety Authority ANS Panel. 2017b. Re-evaluation of potassium nitrite (E 249) and sodium nitrite (E 250) as food additives. EFSA J. 15(6):4786, 157. https://efsa.onlinelibrary.wiley.com/doi/epdf/10.2903/j.efsa.2017.4786.
- [EFSA] European Food and Safety Authority CONTAM Panel. Nitrate in vegetables. EFSA J. 2008;689:1–79. http://www.efsa.europa.eu/sites/default/files/scientific_output/files/main_documents/689.pdf.
- Ekart K, Hmelak Gorenjak A, Madorran E, Lapanje S, Langerholc T. 2013. Study on the influence of food processing on nitrate levels in vegetables. EFSA supporting publication: EN-514; p. 150.
- [EPA] Environmental Protection Agency. 2015. EPA expert system OncoLogic™ 8.0.
- [EC] European Commission. 2008. Commission Regulation No 1333/2008 of the European Parliament and of the Council of 16.12.2008 on food additives: OJ L 354, 31.12.; p. 16
- [EC] European Commission. 1998. Council Directive 98/83/EC on the quality of water intended for human consumption. https://eur-lex.europa.eu/legal-content/EN/TXT/?uri=celex:01998L0083-20151027.
- Gangolli SD, Van den Brandt PA, Feron VJ, Janzowsky C, Koeman JH, Speijers GJ, Spiegelhalder B, Walker R, Wisnok JS. 1994. Nitrate, nitrite and N-nitroso compounds. Eur J Pharmacol. 292(1):1–38. https://www.ncbi.nlm.nih.gov/pubmed/7867685
- Goedhart PW, Van der Voet H, Knüppel S, Dekkers ALM, Dodd KW, Boeing H, Van Klaveren JD. 2012. A comparison by simulation of different methods to estimate the usual intake distribution for episodically consumed foods. EFSA Supporting Publications 2012:EN-299. https://efsa.onlinelibrary.wiley.com/doi/epdf/10.2903/sp.efsa.2012.EN-299.
- [HC] Health Canada. 2013. Guidelines for Canadian drinking water quality: guideline technical document – nitrate and nitrite. ISBN: 978-1-100-22999-7. http://healthycanadians.gc.ca/publications/healthy-living-vie-saine/water-nitrate-nitrite-eau/alt/water-nitrate-nitrite-eau-eng.pdf.
- Houthuijs D, Breugelmans ORP, Baken KA, Sjerps RMA, Schipper M, Van der Aa M, van Wezel AP. manuscript in preparation. Assessment of drinking water safety in the Netherlands using nationwide exposure and mortality data. Manuscript in preparation.
- Iacumin L, Cattaneo P, Zuccolo C, Galanetto S, Acquafredda A, Comi G. 2019. Natural levels of nitrites and nitrates in San Daniele dry cured ham PDO, and in meat, salt and sugna used for its production. Food Control. 100:257–261.
- [IARC] International Agency for Research on Cancer. 1987. Monographs on the evaluation of the carcinogenic risk of chemicals to humans. 1987. Some N-nitroso compounds. Vol. 17. https://monographs.iarc.fr/wp-content/uploads/2018/06/mono17.pdf.
- [JECFA] Joint FAO/WHO Expert Committee on Food Additives. 1995. Evaluation of certain food additives and contaminants, forty-fourth report of the Joint FAO/WHO Expert Committee on Food Additives. https://apps.who.int/iris/bitstream/handle/10665/37246/WHO_TRS_859.pdf;jsessionid=6C26881046D4A429A933BC2B86B37946?sequence=1.
- [JECFA] Joint FAO/WHO Expert Committee on Food Additives. 2003. Nirate and nitrite, WHO Food Additive Series 50. http://www.inchem.org/documents/jecfa/jecmono/v50je07.htm.
- Larsson K, Darnerud PO, Ilbäck N-G, Merino L. 2011. Estimated dietary intake of nitrite and nitrate in Swedish children. Food Addit Contam. 28(5):659–666.
- Lee HS. 2018. Exposure estimates of nitrite and nitrate from consumption of cured meat products by the U.S. population. Food Addit Contam. 35(1):29–39.
- Leszczynski T, Filipiak-Florkiewicz A, Cieslik E, Sikora E, Pisulewski PM. 2009. Effects of some processing methods on nitrate and nitrite changes in cruciferous vegetables. J Food Compos Anal. 22:315–321.
- [MCRA] Monte Carlo Risk Assessment 8.2. https://mcra.rivm.nl/.
- Meah MN, Harrison N, Davies A. 1994. Nitrate and nitrite in foods and the diet. Food Addit Contam. 11(4):519–532. https://www.ncbi.nlm.nih.gov/pubmed/7958118
- Mensinga TT, Speijers GJ, Meulenbelt J. 2003. Health implications of exposure to environmental nitrogenous compounds. Toxicol Rev. 22(1):44–51. https://www.ncbi.nlm.nih.gov/pubmed/14579546
- Nusser SM, Carriquiry AL, Dodd KW, Fuller WA. 1996. A semiparametric transformation approach to estimating usual daily intake distributions. J Am Stat Ass. 91:1440–1449.
- Ocké M, de Boer E, Brants H, Maly M. 2012. PANCAKE – pilot study for the assessment of nutrient intake and food consumption among kids in Europe. EFSA Supporting Publications: EN-339. https://efsa.onlinelibrary.wiley.com/doi/epdf/10.2903/sp.efsa.2012.EN-339.
- Roodenburg AJC, van Ballegooijen AJ, Dötsch-Klerk M, van der Voet H, Seidell JC. 2013. Modelling of usual nutrient intakes: potential impact of the choices programme on nutrient intakes in young Dutch adults. PLoS One. 8:e72378. doi:10.1371/journal.pone.0072378
- [SCCS] Scientific Committee on Consumer Safety. 2011. Opinion on nitrosamines and secondary amines in cosmetic products. SCCS/1458/11. https://ec.europa.eu/health/scientific_committees/consumer_safety/docs/sccs_o_090.pdf.
- [SCF] Scientific Committee for Food. 1997. Opinions of the scientific committee for food on: nitrates and nitrite 1-33. https://ec.europa.eu/food/sites/food/files/safety/docs/sci-com_scf_reports_38.pdf.
- Tamme T, Reinik M, Roasto M, Meremäe K, Kiis A. 2009. Impact of food processing and storage conditions on nitrate content in canned vegetable-based infant foods. J Food Prot. 72(8):1764–1768.
- Temkin A, Evans S, Manidis T, Campbell C, Naidenko OV. 2019. Exposure-based assessment and economic valuation of adverse birth outcomes and cancer risk due to nitrate in United States drinking water. Environ Res. in press. 176:108442. doi:10.1016/j.envres.2019.04.009.
- Temme EHM, Vandevijvere S, Vinkx C, Huybrechts I, Goeyens L, Van Oyen H. 2011. Average daily nitrate and nitrite intake in the Belgian population older than 15 years. Food Addit Contam. 28(9):1193–1204.
- Thomson BM, Nokes CJ, Cressey PJ. 2007. Intake and risk assessment of nitrate and nitrite from New Zealand foods and drinking water. Food Addit Contam. 24(2):113–121.
- Tooze JA, Kipnis V, Buckmann DW, Carroll RJ, Freedman LS, Guenther PM, Krebs-Smith SM, Subar AF, Dodd KW. 2010. A mixed-effects model approach for estimating the distribution of usual intake of nutrients: the NCI method. Stat Med. 29:2857–2868.
- Van Klaveren JD, Goedhart PW, Wapperom D, Van der Voet H. 2012. A European tool for usual intake distribution estimation in relation to data collection by EFSA. Supporting Publications 2012:EN-300.
- Van Rossum CTM, Nelis K, Wilson C, Ocké M 2018 National dietary survey in 2012-2016 on the general population aged 1-79 years in the Netherlands. EFSA Supporting Publication 2018:EN-1488; p. 25. https://efsa.onlinelibrary.wiley.com/doi/epdf/10.2903/sp.efsa.2018.EN-1488
- [VCP] Voedsel Consumptie Peiling. https://www.rivm.nl/voedselconsumptiepeiling.
- VanDooren MMH, Boeijen I, Van Klaveren JD, Van Donkersgoed G. 1995. Conversie van consumeerbare voedingsmiddelen naar primaire agrarische produkten. Institute on Food Safety Research (RIKILT). rapport 95.17.
- [WHO] World Health Organization. 1998. Guidelines for drinking-water quality. 2nd. Addendum to volume 2. Geneva: Health criteria and other supporting information. https://apps.who.int/iris/handle/10665/38551.
- [WHO] World Health Organization. 2003. Nitrate and nitrite in drinking-water. Background document for preparation of WHO Guidelines for drinking water quality. Geneva: World Health Organization (WHO/SDE/WSH/03.04/56). https://www.who.int/water_sanitation_health/dwq/GDWQ2004web.pdf.
- Zeilmaker MJ, Bakker MI, Schothorst R, Slob W. 2010. Risk assessment of N-nitrosodimethylamine formed endogenously after fish-with-vegetables meals. Toxicol Sci. 116(1):323–335.