
ABSTRACT
Feed additives require pre-market authorisation prior to their use in the EU. For the group of coccidiostats, the EU regulations authorising these products include specifications for these substances and the major components of the feed additive formulations. Feed business operators can use only feed additives that meet these criteria. The traceability of these products is supported by the allocation of specific identification numbers that need to be printed on the feed additive label along with other information. In the present study, Direct Analysis in Real Time mass spectrometry (DART-MS) was applied to investigate the correct characterisation of feed additives that contain coccidiostats as active substances. The results of the study demonstrated that this technique allows an unequivocal identification of the active substances in the feed additive formulations when combining DART with high-resolution mass spectrometry. In addition, two feed additives containing the same coccidiostat, but different excipients could be correctly classified according to their composition. The method protocol is very simple and comprises two steps, namely the extraction of the feed additives with an organic solvent and the subsequent measurement with DART-MS. For the evaluation of the MS spectra, chemometrics was applied offering an effective method for classification. Chemometric models were established with nominal masses obtained from the analysis of the samples, thus showing that these feed additives could be correctly classified even using low-resolution mass spectrometry. Moreover, we demonstrated that molecule-specific stable isotope patterns obtained with low-resolution mass spectrometry could be used as an alternative tool for the confirmation of the active substance.
Introduction
Feed additives play an important role in animal nutrition, addressing various demands such as improving the quality of feedstuffs and the health of the animals. Prior to their use in the EU, feed additives need a pre-market approval according to a procedure specified in European legislation (EU Citation2003). The decision on authorising the product is taken by the European Commission based on an opinion of the European Food Safety Authority (EFSA), focusing on the evaluation of the safety and other characteristics of the products. Moreover, the authorisation requires the availability of analytical methods suitable for official control of the correct use of these feed additives. The corresponding method evaluation is performed by the EU Reference Laboratory for Feed Additives (EURL-FA) hosted by the European Commission’s Joint Research Centre (EC Citation2005). Details of the operation of the EURL-FA are provided in a previous publication (von Holst et al. Citation2016). Feed additives are individually authorised via Commission Implementing Regulations, specifying the conditions of use such as minimum and maximum limits of the active substance in complete feedstuffs. Once these regulations have been published in the Official Journal of the EU, references to these regulations are included in the register of feed additives (EC Citation2021a), which facilitates the search for regulations authorising specific feed additives.
While the authorisation of antibiotics as feed additives is not allowed in the EU, coccidiostats and histomonostats are the only group of antimicrobials which can still be used and they form a separate category of feed additives as defined in European legislation (EU Citation2003). Feed additives containing coccidiostats are applied to fight against protozoa (EU Citation2003), which causes the parasitic disease coccidiosis especially affecting chickens and turkeys. Given these specific characteristics and the high demand for safety and efficacy, a number of important criteria are specified in the regulation authorising coccidiostats. First, the additives have a holder-specific authorisation, which means that the company which has originally submitted the corresponding application is exclusively entitled to place the product on the market. Moreover, the criteria include (a) a description of the composition such as the carrier used and the mass fraction of the target coccidiostat, reflecting the fact that these substances are placed on the market via specific preparations, (b) the minimum and maximum content of the coccidiostat in complete feedstuffs, (c) the target animals and (d) in some cases Maximum Residue Limits (MRLs) in the relevant food of animal origin. Currently, the following eleven coccidiostats are authorised within the EU: decoquinate, diclazuril, robenidine hydrochloride, halofuginone, nicarbazin and six ionophores, namely monensin sodium, lasalocid A sodium, narasin, salinomycin sodium, maduramicin ammonium alpha, and semduramicin sodium. Coccidiostats are considered as active substances authorised via fifteen different preparations, because there are different feed additives containing the same coccidiostat. For instance, diclazuril is authorised via the feed additive Coxiril with the unique feed additive number 51771 (EC Citation2015) and via Clinacox 0.5% with the feed additive number 51775 (EC Citation2010). Often these feed additives contain coccidiostat at the same mass fraction but with different carriers and other excipients.
When asking for authorisation, applicants are obliged to submit methods of analysis for the determination of the coccidiostat concerned in the feed additive preparation, pre-mixtures and complete feedstuffs. These methods are subsequently evaluated by the EURL-FA against their suitability for official control of compliance with legal limits established by European legislation and/or content specifications on labels of feed materials as required by EU legislation (EU Citation2009). Corresponding EURL-FA evaluation reports are available on-line via the EU Science Hub (EC Citation2021b). For all coccidiostats currently authorised as feed additives, standard methods of analysis in complete feedstuffs are available from the European Committee for Standardisation (CEN), the International Organization for Standardisation (ISO) or have been established via European legislation (EC Citation2009). Very recently, CEN (Citation2019) has issued a standard for a multi-analyte method based on LC-MS/MS, applicable to the determination of these coccidiostats. Corresponding methods of analysis for the determination of the individual coccidiostats in the feed additive preparations are mainly based on HPLC coupled to UV or fluorescence detection and are available via the EU Science Hub.
Prior to submitting an application for authorisation, applicants have to provide to the EURL-FA three samples of the feed additive concerned (EU Citation2003). More details on this requirement are given on the website of the JRC (EC Citation2021c).
The traceability of feed and feed ingredients throughout the feed chain is an essential element in ensuring feed safety as pointed out by Regulation (EC) No 183/2005 (EU Citation2005) setting general rules of feed hygiene. A key component to reach this goal is a set of detailed requirements for labelling feed additives (EU Citation2003) and feed material or compound feed (EU Citation2009). The label of these products must contain, among other details, the name of the feed additive, its identification number and in the case of coccidiostats also their mass fraction.
While the currently available analytical methods allow for compliance checking of label information regarding the mass fraction of the coccidiostat, corresponding tools to establish compliance with the indicated name of the feed additive and the corresponding identification number are not available yet. However, given the high demand for full product traceability in the area of feed additives, there is an urgent need for corresponding fit for purpose methods. In a previous paper, the successful application of mid- and near infrared microscopy to the differentiation of various coccidiostat-containing feed additive preparations has been demonstrated (Omar et al. Citation2015). One of the striking advantages of vibrational spectroscopy is that these techniques require minimal sample preparation. However, the simultaneous identification of the active substance of the preparation was not possible.
In the current study, we applied the specific ion source Direct Analysis in Real Time (DART) working at ambient pressure and directly coupled to high-resolution mass spectrometry (DART-MS) to the analysis of feed additives. The DART ion source was introduced by Cody et al. (Citation2005) as a rapid tool for the analysis of quite different materials. The analysis does not require extensive sample preparation and takes only a few minutes. In a typical experimental setup, the sample is extracted with a solvent and a small aliquot is placed on a sample holder between the exit of the DART source and the mass spectrometer (MS) inlet. In this region between the DART source and the MS, molecules from the sample are first thermally desorbed and sample specific ions are formed via interaction with metastable species from the DART source. These ions are subsequently analysed by the MS (Pavlovich et al. Citation2018). Given the fact that this ion source requires thermally induced desorption of molecules, the m/z working range is approximately between 50 and 1200 (Gross Citation2014). When running DART-MS in the positive ion mode, the most often observed ion is the [M+H]+ adduct and in the negative mode, [M-H]− is the predominant ion (Pavlovich et al. Citation2018). While in the majority of the cases high-resolution mass spectrometry is applied, there are also studies with low-resolution mass spectrometry as reported in a publication on the detection of major sample components of tablets for anti-malarial treatment (Bernier et al. Citation2016). There are a large number of applications of DART-MS in the area of authenticity and fraud detection, such as discrimination between wild type and farmed salmon (Fiorini et al. Citation2019), the distinction between different Triticum species (Miano et al. Citation2018) and the identification of salvia leaves at species level (Giffen et al. Citation2017). All these studies employ extensive multivariate statistics for data evaluation. In a different type of study, DART-MS has been applied for the determination of specific analytes such as drugs of abuse (Lian et al. Citation2017), mycotoxins (Busman Citation2018) and antiparasitic veterinary drugs (Martínez-Villalba et al. Citation2013).
The purpose of the current study was to evaluate the suitability of DART-MS for the analysis of feed additive preparations containing coccidiostats as the active substances. This analysis should serve two objectives, namely the identification of the active substance and the distinction of feed additive preparations with the same active substance but containing a different carrier or other excipients. The latter objective was addressed by evaluating the DART-MS fingerprints. The practical application of the method would therefore be in the area of target analysis by comparing the analytical results against the expected composition of the test material given on the label of the samples.
Materials and methods
Test material
This study used exclusively samples from already authorised feed additives. An overview of the 15 feed additives used in this study along with their composition is shown in .
Table 1. Feed additives used in this study and information, the name and composition of these products containing the active substance as target and the unique identification number as specified in the corresponding legal acts available via the EU Register of Feed Additives (European Union Citation2021a), qs: quantum satis. In addition, the chemical formula, the accurate masses of the active substances measured with the DART-HRMS system on the feed additives, the ion assignments and the mass errors are shown. The legal act contains a reference to a feed additive specific EFSA opinion, which gives a full characterisation of the active substance
In order to reflect in the study, potential variations of feed additives that could be expected under real world conditions, test materials of batches from different productions were analysed. The test materials from ‘FA group 1ʹ were obtained from the industry in 2018 and comprised feed additives from three different production batches, each of them in duplicate. In addition, test materials ‘FA group 2ʹ were analysed, which were samples from feed additive batches previously produced and submitted to the EURL-FA in 2013 and 2014.
For the fingerprinting experiments, the feed additives Coxiril and Clinacox 0.5% were selected, because they have diclazuril in common, but differ in terms of their excipients. Ninety independent measurements including the extraction of sub-samples from ‘FA group 1ʹ of Coxiril and Clinacox 0.5% were performed, since 15 sub-samples were taken from the 6 sample sachets belonging to the duplicates of the three batches, separately for each of the two feed additives. For ‘FA group 2ʹ of Clinacox 0.5%, one batch from 2013 with three sachets was available, thereby leading to 45 sub-samples (3 × 15). For ‘FA group 2ʹ of Coxiril, one batch from 2014 with three sachets and in addition a single sachet from a different batch from 2013 was available, thus leading to a total number of 60 sub-samples.
For the identification experiments of the active substance in the 15 feed additives (), a sub-sample from each feed additive was taken for analysis.
Sample preparation
Feed additive preparations are complex mixtures of substances composed of the coccidiostats and various excipients. While coccidiostats are more polar compounds, the constituents of the excipients such as carbohydrates and fats cover a broad range of polarity. In order to ensure that all these components, which may be relevant for the distinction of the feed additive preparations, are included in the study, two different extraction solvents have been applied, namely n-hexane and an acetonitrile: methanol: water (80:10:10, v/v/v) mixture, hereafter called polar solvent. This mixture is applied in our laboratory for the routine analysis of feed samples for the determination of coccidiostats and is used in the recently issued CEN standard, developed for this purpose (CEN Citation2019).
An aliquot of 100 mg of the feed additive preparation was extracted in a 2 ml polypropylene tube either with 1 ml of n-hexane or with 1 ml polar solvent. The mixture was first treated in an ultrasonic bath (Branson 5510, Branson Ultrasonics Cooperation, USA) for 5 min at room temperature and subsequently in a thermomixer (MixMate®, Eppendorf AG, Germany) for 15 min. Both extraction steps were at room temperature. After the extraction, the solutions were centrifuged at 18894 g for 5 min and the supernatant was transferred into a sealable glass vial, ready for the measurement with the DART-MS system.
Measurement and settings of the DART-MS
All measurements were done with a DART ion source (IonSense, Danvers, MA, USA) coupled to a first-generation ThermoFisher Scientific Orbitrap Exactive HCD mass spectrometer (2007) running with an Exactive Tune 1.1 and Xcalibur 2.1 data acquisition software (ThermoFisher Scientific, San Jose, CA, USA). Masses were recorded in a range from m/z 100 to m/z 1000. The accurate masses of the coccidiostats and the corresponding isotopologues profile were calculated by inserting the chemical formula given in into the free software enviPat operating via a Web interface (Loos et al. Citation2015).
The DART ion source was a SVP100 model (2013) utilised with the high-resolution mass spectrometer (HRMS) through a specialised vapour interface flange designed for such Orbitrap® instruments. A ceramic transfer tube with a length of 42 mm and a 4.75 mm internal diameter was inserted at the end of the vapour attachment. A 2 mm gap inside the vapour interface between the end of the ceramic tube and the protruding end of the capillary was needed in order to ensure that the helium gas in excess would be evacuated and proper vacuum in the instrument would be maintained. The excess of helium was removed by a supplemental external vacuum pump MZ 2NT (2012) regulated at half of its capacity (7 mbar). An angle ceramic cap was used at the edge of the DART source and the distance between the DART source and transfer tube was set at 4 mm.
The following operating conditions of the DART source were applied: helium pressure in run mode: 5 bar; nitrogen pressure in standby mode: 5 bar, run temperature: 375 °C, standby temperature: 365 °C, grid voltage: 350 V and for the HRMS: spray voltage: 1 kV; capillary temperature: 325 °C; skimmer voltage: 25 V (positive mode), – 25 V (negative mode); capillary voltage: 50 V (positive mode), – 50 V (negative mode); tube lens voltage: 100 V (positive mode), – 100 V (negative mode). The resolution for the Orbitrap Exactive was set at 50 K, the automatic gain control (AGC) at balanced (1e6), the maximum injection time at 250 ms and the scan range between 100 and 1000 m/z. Before any daily operation of the HRMS, in order to ensure high mass accuracy, the system was calibrated externally by infusion of a calibration mixture in positive (MSCAL5 Cal Mix, Merck) and negative mode (MSCAL6 Cal Mix, Merck) at a flow rate of 5 µl/min to 7 µl/min. The overall laboratory temperature was controlled at 21 ± 2 oC and the humidity ranged between 25% and 55%.
For the DART-MS measurements, a 1D transmission module for sample introduction with a commercial stainless steel (SS) mesh strip with 10 sample positions from IonSense (Danvers, MA, USA) is used. An aliquot of 5 μl of each sample extract is individually placed on the sample positions of the mesh strip, which is then placed on a mechanical arm with pre-set movement parameters. Finally, the mechanical arm with the mesh strip is gradually moved between the DART ion source and the inlet of the MS for the subsequent measurements.
When focusing on the determination of the coccidiostats in the feed additive preparations, the mass error from the corresponding accurate masses measured with the high-resolution mass spectrometer was calculated to establish whether DART-MS is fit for the intended purpose. For the evaluation of the fingerprints of the feed additive preparations, the nominal masses were used, mainly due to much easier pre-processing of the data required prior to the multivariate statistics, compared to the situation when processing data from HRMS. Nevertheless, the identification of diclazuril, which was the active substance of two specific feed additives used for the fingerprinting experiments in this study, was investigated evaluating the compound-specific isotope pattern of this analyte obtained from the nominal masses.
Data treatment and multivariate statistics
The masses (nominal or exact) from the measured mass spectra were exported automatically from the Qual browser of Xcalibur, by clicking manually on the maximum of the peak and electronically transferring to an Excel file. All ions down to 1% abundance were exported from the spectra. The data from this file were then read into MATLAB® R2018a (MathWorks, Natick, MA, USA) as matrix, in which the columns contain the sample names and the rows contain the masses. Further data pre-processing was adopted from a previous publication (Cajka et al. Citation2013) and comprised two steps, namely (1) constant sum normalisation applied on the measured intensities of all masses, individually for each sample, followed by (2) median centering and subsequently Pareto scaling applied on the normalised intensities from all samples, individually of each mass. Mass alignment and constant sum normalisation were performed using an in-house developed MATLAB® script, while median centring and Pareto scaling of the data and subsequent multivariate statistics were done with the PLS_Toolbox (Eigenvector Research, Inc. Wenatchee, WA, USA) running within the MATLAB® environment. Analysis of variance was done with a Minitab® 18 software package (Minitab, Inc. State College, PA, USA).
Results and discussion
Optimisation of the DART and Exactive Nano Spray Ionisation Source (NSI) settings
Prior to measuring the feed additives, the experimental parameters of the DART-MS were optimised. Several parameters can influence the results of the measurements and therefore experiments were done to optimise these parameters. The optimisation experiments concerned the settings of the DART ion source and the selection of the DART discharge gas. The optimisation was conducted with the aim of getting the best possible compromise of all relevant parameters for all additives analysed.
A relevant factor for a fit-for-purpose intensity of the analyte ions, which also helps achieving the correct ion identification, is the temperature of the ionisation gas. Typically, a 250–350°C temperature range is used in DART analysis. In our study, a 250–450°C temperature range was tested and a DART source run temperature of 375°C was selected as optimum compromise for all analytes.
The grid voltage was tested up to 400 V, where a general decrease in the signal intensity was observed. The optimum was demonstrated to be 350 V.
The position of the sampling on the grid was also tested since it is a critical factor. Placing the sampling on the grid as facing the DART source resulted in the most intense spectra peaks.
Furthermore, the tune parameters for the Nano Spray Ionisation Source were evaluated and optimised in order to produce the highest ion abundances at higher voltages, without causing induced fragmentation, achieving a stable spray flow. All analytes were tested in the positive and negative mode producing the ions shown in . In detail, the parameters tested were the spray voltage (0 kV – 1 kV), the capillary temperature (200°C, 250°C, 300°C, 325°C), the skimmer voltage (25 V, 35 V, 50 V), the capillary voltage (25 V, 35 V, 50 V) and the tube lens voltage (80 V, 90 V, 100 V, 120 V). The selection of the optimised values for all parameters was based on the best compromise m/z intensities for all analytes and resulted in an optimised set of settings as specified in the experimental section of this paper.
Selection of the DART discharge gas
The DART ion source can be operated with nitrogen or helium. When working with helium, electronic excited state helium atoms with a high energy of 19.8 eV are formed, thus exerting the production of reagent ions with high efficiency (Song et al. Citation2018). This characteristic makes helium a very good gas in experiments with the DART ion source. In contrast, corresponding excited atoms of nitrogen have a lower energetic level, but nitrogen is the less expensive alternative. Therefore, we measured the extracts of the test materials with both gases to investigate the impact of the use of helium and nitrogen on the corresponding mass spectra. The comparison of the obtained spectra revealed distinct differences. When measuring the n-hexane extracts of the feed additives with nitrogen, no masses of the active substances were recorded for Stenerol, Coxiril, Aviax 5%, Maxiban G160, Clinacox 0.5%, Cycostat and Cygro, while for the other products the active substances could be detected. In contrast, when measuring with helium, the active substances were identified in all products with the exception of two feed additives, namely Stenerol and Cycostat. When comparing the results of helium and nitrogen measured on the polar solutions, the differences in respect to the active substance are minor, because for nitrogen – with the exception of Maxiban – and helium, masses of the active substances in all feed additives could be recorded. Furthermore, it is also important that the mass spectra contain additional peaks linked to compounds from the excipients of the feed additive, which are relevant when conducting a fingerprinting study. The evaluation of the mass spectra of the feed additives indicated that for some of these products, such as Cygro, mass spectra obtained with helium are richer compared to nitrogen. Based on these results, we decided to carry out the subsequent experiments with helium. To reduce the consumption of helium, the DART ion source was fed with nitrogen in the stand-by mode and exclusively switched to helium when performing the measurements.
Identification of coccidiostats
Identification of coccidiostats using accurate masses
For the identification of the active substances in the various feed additives, corresponding accurate monoisotopic masses were compared with the calculated exact masses. Mass errors expressed in ppm were then calculated. The results are summarised in . For this study, the extracts obtained with the polar solvent were used, with the exception of Aviax 5%, where the n-hexane extracts showed more stable intensities of the measured ions. The majority of the coccidiostats were measured in positive MS mode, while diclazuril and 4,4ʹ-dinitrocarbanilide, which is the target analyte- for nicarbazin, had to be measured in negative MS mode. The evaluation of the spectra showed that in all cases the molecular ion could be detected, either the deprotonated molecule [M-H]−, the protonated molecule [M+H]+ or sodium adducts [M+Na]+, when measuring coccidiostats belonging to the group of ionophores. The detection of sodium adducts from ionophores corresponds to the results reported in a previous paper on the determination of this group using DART-MS (Martínez-Villalba et al. Citation2013). For the majority of the coccidiostats, peaks of the ions corresponding to the molecular mass had large intensities in the mass spectrum, while for some coccidiostats with a very high molecular mass such as maduramicin and semduramicin, the intensities of the corresponding peaks were low. Given an allowed mass deviation of 5 ppm (Dührkop et al. Citation2014), all coccidiostats with the exception of monensin sodium and lasalocid A sodium passed this criterion, since the corresponding mass errors were below 5 ppm. For the two preparations of Coxidin and Elancoban, the mass errors for monensin sodium varied between 5.9 and 7.2 ppm and therefore the identification could not be confirmed. Subsequently, the calculated abundances, related to the intensity of “M+0”, of three isotopologues of monensin sodium were compared against the corresponding theoretical values, obtaining the following results. The first value after the specific isotopologues is the measured value, while the theoretical values is in brackets: “M+1” 41.2% (40.1%); “M+2” 10.3%, (10.1%) and “M+3” 1.81% (1.89%). The same was observed for lasalocid A sodium, where the mass error was 6.9 ppm and the corresponding pattern of the isotopologues were as follows: “M+1” 36.7%, (37.7%) and “M+2” 8.5%, (8.6%) The comparison of the values showed that the theoretical and measured profile corresponded well, which further supports the correct identification of both substances.
Identification of diclazuril by the isotopologues pattern using nominal masses
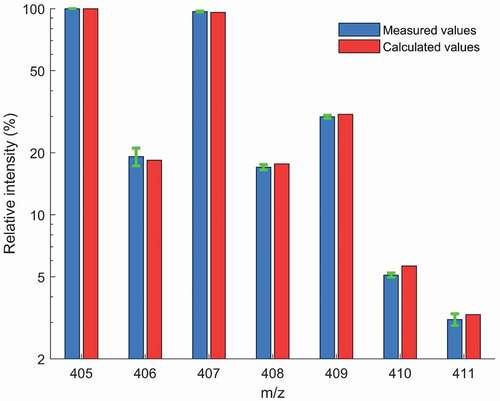
When conducting the statistical assessments of the spectra showing the nominal masses of Coxiril and Clinacox 0.5%, it was of interest to establish whether the specific stable isotope pattern of diclazuril could be used for its identification in the sample. The formula of diclazuril (C17H9Cl3N4O2) indicates the presence of three chlorine atoms, thus the corresponding abundance of 35Cl (76%) and 37Cl (24%) along with the abundance of 13C (1.1%) leads to a specific isotope distribution covering a nominal mass [M-H]− range from 405 to 411. The obtained isotope pattern was then compared with the calculated isotope pattern. In this part of the study, the polar solvent extracts measured in negative DART-MS mode from all ‘FA group 1ʹ samples of both feed additives (sample number = 180) were used and the corresponding absolute intensities were pooled, separately for the m/z values 405 to 411. For each of the 180 samples, the absolute intensities of the m/z values 406 to 411 were separately divided by the absolute intensity of m/z values 405 and the corresponding average relative intensities per m/z value were compared with the calculated relative intensities. The results as presented in show that both values match very well, thus confirming that the isotope pattern could be used as an additional tool for identification, especially when only nominal masses are available. Moreover, when looking at the results separately for each of the m/z values, very low standard deviations of the relative intensities were observed ranging from 0.74% to 10.2%. Future work will help establish identification criteria for the measured isotopologues pattern from this type of feed additives.
Figure 1. Isotope pattern of diclazuril based on nominal masses: Comparison of the average of the measured relative intensities (n = 180, plotted on logarithmic scale) with the corresponding calculated values. The standard deviation of the relative intensities are shown as error bars.
Fingerprinting of feed additive preparations
In the following, evaluations of the whole spectra obtained from the analysis of Clinacox 0.5% and Coxiril are presented. After the transformation of the mass intensities by constant sum normalisation, various thresholds were applied to establish whether the removal of masses with very low transformed intensities would have an impact on the statistical assessment. Since this was not the case, all normalised data were loaded into the PLS tool box for further data processing, Principal component analysis (PCA) was applied as an unsupervised tool to elucidate any structuring in the data set, while Partial Least Square Discriminant Analysis (PLS-DA) was used to establish whether correct assignment of samples to Clinacox 0.5% and Coxiril was possible. For the latter case, PLS-DA models were built using the sample set FA group 1, which were subsequently validated by applying these models to the independent sample set of FA group 2. The multivariate statistics was separately performed on the spectra obtained with four different treatments, namely (1) the extraction with the polar solvent and n-hexane and (2) measuring the extracts in positive-ion and negative-ion mode of the DART-MS, respectively.
Comparison of the obtained mass spectra from Clinacox 0.5% and Coxiril
Prior to subjecting the spectra to multivariate statistics, the stability of the measurements across the two samples was evaluated. Since diclazuril is supposed to be present in all samples from both feed additive preparations, the relative intensities from the measurements were pooled and subjected to analysis of variance (ANOVA), to estimate the variation of the relative intensities expressed in terms of the RSD (relative standard deviation). As independent factors in the ANOVA, the feed additive preparations (Coxiril and Clinacox 0.5%) and the different batches were used. In total, results from 270 independent measurements covering the extraction and the DART-MS measurement were included in the assessments. For this investigation, the extracts of the samples obtained with the polar solvent were used, given the higher solubility of diclazuril in this solvent compared to n-hexane. The DART-MS was operated in the negative mode in order to monitor the [M-H]− ion of diclazuril. The overall average of the relative intensities for diclazuril was 0.23 and the RSD was 11% including the variance components of feed additive preparations and the batches. When looking at the within-batch variation, the RSD was 6.8% reflecting the uncertainty of the measurements including the extraction. Considering the low values for relative intensities obtained in this study, the DART-MS technique was considered robust enough for the purpose of this study. The statistical assessment also revealed that the difference of the total RSD of 11% and the within-batch variation of 6.8% are linked to a higher mean relative intensity of Clinacox 0.5% compared to Coxiril. Such difference however is not surprising given the fact that these values have been calculated based on the sum of all masses from the different matrices in the two feed additives.
In order to have a first overview on the mass spectra obtained on the samples from Coxiril and Clinacox 0.5%, the corresponding mean mass spectra are shown for the different treatments.
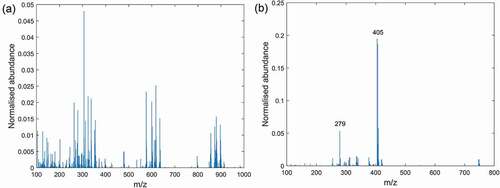
shows the mean spectra from Coxiril, where the samples have been extracted with the polar solvent and the instrument was operated in positive and negative mode, respectively. The spectrum obtained in negative mode clearly shows the [M-H]− peak at m/z 405 and some additional peaks at lower intensity from excipient components. In contrast, the same extract measured in positive mode delivers a spectrum with a completely different pattern showing peaks up to m/z 900 that are linked to extracted substances from the excipient. This observation reflects a general trend in this study that the spectra measured in positive MS mode show more peaks compared to the spectra measured in negative mode, though a peak related to diclazuril is obviously missing in the positive MS mode.
Figure 2. Mass spectra of polar solvent extracts from Coxiril measured in: (a) positive DART-MS mode and (b) negative DART-MS mode.
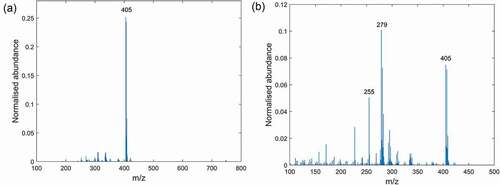
In the Clinacox 0.5% spectra measured in negative mode and obtained from the samples extracted with n-hexane or the polar solvent are compared. In the polar solvent spectrum, the peak with the highest relative intensity of 0.25 and at m/z 405 is from diclazuril and some minor peaks with a relative intensity below 0.02 are from components of the excipients. The situation is inverted for the n-hexane extract, where the relative intensity of the diclazuril peak dropped to 0.08 and other ions such as m/z 255 and 279 became more abundant. These masses were also identified in the corresponding extracts from Coxiril and to a minor extent in the polar solvent extracts of these products and we assume that these ions correspond to the deprotonated molecules of palmitic (m/z 255) and linoleic acid (m/z 279) stemming from the oil fractions in the soybean and wheat meal. These are the major excipient of Clinacox 0.5% and Coxiril, respectively. The detection of these ions with DART-MS operated in negative mode and their identification as palmitic and linoleic acid has been already reported in a previous study on the authentication of animal fats (Vaclavik et al. Citation2011). Moreover, the exact masses for these ions measured in the Clinacox 0.5% extracts were compared with the corresponding accurate masses. Based on the calculated mass error of 3.16 ppm for palmitic acids and 2.17 ppm for linoleic acids, the identity of these compounds could be confirmed. Similar results regarding the mass error were obtained for Coxiril.
Figure 3. Mass spectra of extracts from Clinacox 0.5% measured in negative DART-MS mode: (a) extraction with the polar solvent and (b) extraction with n-hexane.
Variation of mass spectra of samples from the same feed additive
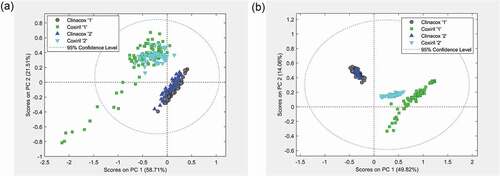
In this section, the variation of measurement results from samples of the same product is presented. For this overview, the spectra exclusively from FA group 1 were used, which were composed for each product of six groups, reflecting three batches with two bags per batch. The spectra for each product were subjected separately to PCA and the obtained scores of the first and second principal components (PC 1 and PC 2) are shown. Different results were obtained depending on the products and the treatments. For instance, in the case of the polar solvent extracts of Coxiril, measured in negative DART-MS mode, the scores of PC 1 and PC 2 from the six groups were quite close to each other as shown in ). A distinct scattering could be observed from the measurements of the second bag of the first batch. In contrast, the scores from the spectra related to the measurements of the n-hexane extracts measured in positive DART-MS mode showed a low variation, while all samples from the second batch formed a separated group as shown in ). In general, the differences between the spectra obtained in the negative MS mode were less pronounced compared to spectra measured in the positive MS mode.
Figure 4. Between batch variation of each product expressed in terms of the scores of the first and the second principal component. Three batches with two sachets, where the letters A to C stand for the batch and the number 1 and 2 stand for the sachets: (a) Coxiril, polar solvent extracts measured in negative DART-MS mode and (b) Clinacox 0.5%, n-hexane extracts measured in positive DART-MS mode.
Classification of spectra: Clinacox 0.5% versus Coxiril
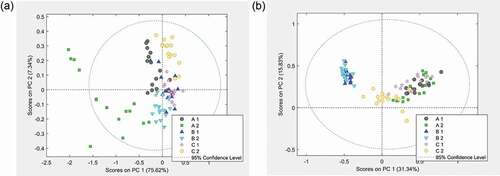
While the results reported above indicate a grouping of samples within the two feed additives, here the correct attribution of samples to the corresponding products is evaluated. First, PCA models were established using the joint spectra from both feed additives of FA group 1 to identify any structuring of the measurements. The spectra obtained with the samples from FA group 2 were subsequently projected on these models. The statistical assessment was done for all treatments (solvents and MS mode) and the score plot of PC 1 against PC 2 revealed that in all cases the samples formed sub-groups depending on whether they belonged to Clinacox or Coxiril 0.5%, respectively. However, the distribution of the scores differed quite a lot between the four treatments, and in particular the extracts obtained with the polar solvent gave better results regarding the separation of the groups compared to the n-hexane extracts. In , the corresponding scores are shown for the polar solvent extracts measured in the positive and negative MS mode, respectively. The scores from the measurements in the negative MS mode ()) of the model samples and prediction samples overlap very well when belonging to the same feed additive, while a good separation between the feed additives could be observed. In addition, the same sub-group of Coxiril FA group 1 samples with a large variation, as presented in ), also showed a large scattering of the scores in the PCA plot of both products ()). Interestingly, the range of scores of the two sample sub-sets of Coxiril, FA group 2 (2013 and 2014) completely overlap, thus indicating no significant difference between the two batches of the same product.
Figure 5. Variation between products: PCA score plots from the measurements of the polar solvent extracts. (a) Measurements in negative MS mode and (b) measurements in positive MS mode. Coxiril ‘1ʹ and Clinacox 0.5% ‘1ʹ are the samples to create the PCA model, while the Coxiril ‘2ʹ and Clinacox 0.5% ‘2ʹ samples are used for prediction purposes.
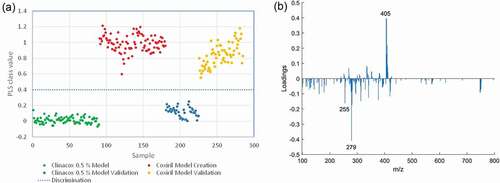
The results of the PLS-DA analysis revealed that the prediction samples were correctly classified according to the corresponding feed additives for all treatments. The correct classification with the lowest within-group variation and largest between-group variation was obtained with the polar solvent extracts measured in the positive MS mode, which corresponds to the visual inspection of the obtained mass spectra. Since the operation in the positive MS mode comes at the expense of the missing identification option for diclazuril, we looked at the prediction capability of the models obtained in the negative MS mode, focusing on the results from the mass spectra of the polar solvent extracts. ) shows the corresponding response variable of each sample along with the threshold value of 0.4, indicating that samples with a value above 0.4 would be classified as Coxiril and the ones with a value below 0.4 would be classified as Clinacox 0.5%. By applying this rule, all samples from FA group 2 have been correctly classified to the respective feed additive. In ), the loadings of the first latent variable are shown, indicating that the m/z values of 255, 279 and 405/407 are important contributors to the classification. These results correspond very well to the evaluation of the relevant components in the mass spectra as discussed in the previous section, thus confirming the fitness for purpose of the developed PLS-DA models. Finally, we exported the chemometric models into a regression vector, which allows for establishing a linear equation between the response variable of the model and the normalised intensities of masses obtained on the measurement of the samples. A major advantage of this equation is therefore that prediction samples can be classified without the use of any chemometric software. In future research, we will check whether correct classification of the prediction samples using this regression vector is also possible, when applying this equation on data obtained on a different DART MS system.
Figure 6. Classification of Coxiril and Clinacox 0.5 % samples: Presentation of the PLS-DA model obtained on the polar solvent extracts measured in negative MS mode: (a) response values of the model and prediction samples and the threshold. (b) Loading plot form the first latent variable.
Conclusions
In the current study, the applicability of DART-MS to the analysis of coccidiostat containing feed additives was investigated. This technique is characterised by rapid processing of the sample, thus allowing for a high sample throughput. The study confirmed that the target coccidiostats could be identified, especially when measuring in HRMS mode, while the application of multivariate statistics on the MS spectra based on the nominal masses led to a correct classification into the respective feed additive. The results of the study revealed that the correct classification of the feed additives analysed could also be achieved with low-resolution mass spectrometry. When implementing the technique under real world conditions, the first step should always be the confirmation of the targeted active substance, in order to limit the potential products under consideration. The study also showed that molecule-specific stable isotope patterns may be used as additional information for an unequivocal identification of the active substance. Subsequently, the entire spectra could be scrutinised for the identification of the feed additive. Therefore, DART-MS could be considered as an additional tool for the traceability of feed additives. In order to facilitate the use of this supplementary control tool within the frame of official controls, the EURL-FA is currently setting up a databank containing spectra obtained with mass spectrometry on feed additive reference samples along with the details of the corresponding multivariate models.
Acknowledgments
We are grateful to Roberto Piro and Brunella Miano (Istituto Zooprofilattico Sperimentale delle Venezie, Vicenza (IT)) for sharing with us their practical experiences of using DART-MS in the area of food authenticity.
Disclosure statement
No potential conflict of interest was reported by the authors.
Additional information
Funding
References
- Bernier MC, Li F, Musselman B, Newtonc PN, Fernandez FM. 2016. Fingerprinting of falsified artemisin in combination therapies via direct analysis in real time coupled to a compact single quadrupole mass spectrometer. Anal Methods. 8:6616–6624. doi:https://doi.org/10.1039/C6AY01418F.
- Busman M. 2018. Quantitation of mycotoxins using direct analysis in real time mass spectrometry (DART-MS). J AOAC Int. 101(643):646. doi:https://doi.org/10.5740/jaoacint.17-0338.
- Cajka T, Danhelova H, Zachariasova M, Riddellova K, Hajslova J. 2013. Application of direct analysis in real time ionization–mass spectrometry (DART–MS) in chicken meat metabolomics aiming at the retrospective control of feed fraud. Metabolomics. 9:545–557. doi:https://doi.org/10.1007/s11306-013-0495-z.
- Cody RB, Laramée JA, Dupont DH. 2005. Versatile new ion source for the analysis of materials in open air under ambient conditions. Anal Chem. 77:2297–2302. doi:https://doi.org/10.1021/ac050162j.
- Dührkop K, Hufsky F, Böcker S. 2014. Molecular formula identification using isotope pattern analysis and calculation of fragmentation trees. Mass Spectrometry (Tokyo, Japan). 3( Spec Iss 2):S0037. doi:https://doi.org/10.5702/massspectrometry.S0037.
- [EC] European Commission. 2005. Commission Regulation (EC) No 378/2005 of 4 March 2005 on detailed rules for the implementation of Regulation (EC) No 1831/2003 of the European Parliament and of the Council as regards the duties and tasks of the Community Reference Laboratory concerning applications for authorisations of feed additives. Off J Eur Union. L59:8–15.
- [EC] European Commission. 2009. Commission Regulation (EC) No 152/2009 of 27 January 2009 laying down the methods of sampling and analysis for the official control of feed. Off J Eur Union L. 54:1–130.
- [EC] European Commission. 2010. Commission Regulation (EU) 1118/2010 of 2 December 2010 concerning the authorisation of diclazuril as a feed additive for chickens for fattening. Off J Eur Union. L 317:5–8.
- [EC] European Commission. 2015. Commission Implementing Regulation (EU) 2015/46 of 14 January 2015 concerning the authorisation of diclazuril as a feed additive for chickens for fattening, for turkeys for fattening and for Guinea fowl for fattening and breeding. Off J Eur Union. L 9:5–7.
- [EC] European Commission. 2021a. European Union Register of Feed Additives [Internet]. [accessed 2021 Jan 11]. http://ec.europa.eu/food/safety/docs/animal-feed-eu-reg-comm_register_feed_additives_1831-03.pdf.
- [EC] European Commission. 2021b. EU Science Hub. The European Commission’s science and knowledge service. EURL for feed additives [Internet]. [accessed 2021 Jan 11]. https://ec.europa.eu/jrc/en/eurl/feed-additives/evaluation-reports.
- [EC] European Commission. 2021c. EU Science Hub. The European Commission’s science and knowledge service. EURL for feed additives [Internet]. [accessed 2021 Mar 8]. https://ec.europa.eu/jrc/en/eurl/feed-additives/guidance-for-applicants.
- [CEN] European Committee for Standardization. 2019. EN 17299:2019. Animal feeding stuffs: Methods of sampling and analysis - Screening and determination of authorized coccidiostats at additive and 1 % and 3 % cross-contamination level, and of non-registered coccidiostats and of one antibiotic at sub-additive levels, in compound feed with High Performance Liquid Chromatography - Tandem Mass Spectrometry detection (LC-MS/MS).
- [EU] European Union. 2003. Regulation (EC) No. 1831/2003 of the European Parliament and the Council of 22 September 2003 on additives for use in animal nutrition. Off J Eur Union. L 268: 29-43 as last amended by Commission Regulation (EU) 2015/2294.
- [EU] European Union. 2005. Regulation (EC) No 183/2005 of the European Parliament and of the Council of 12 January 2005 laying down requirements for feed hygiene. Off J Eur Union. L 35:1–22.
- [EU] European Union. 2009. Regulation (EC) No. 767/2009 of the European Parliament and the Council of 13 July 2009 on the placing on the market and use of feed, amending European Parliament and Council Regulation (EC) No 1831/2003 and repealing Council Directive 79/373/EEC, Commission Directive 80/511/EEC, Council Directives 82/471/EEC, 83/228/EEC, 93/74/EEC, 93/113/EC and 96/25/EC and Commission Decision 2004/217/EC. Off J Eur Union. L 229: 1-28 as last amended by Commission Regulation (EU) 2015/2294. Off J Eur Union. L 220:1-28.
- Fiorini FM, Losito I, De Angelisa E, Arlorioc M, Logrieco AF, Monaci L. 2019. Assessing fish authenticity by direct analysis in real time-high resolution mass spectrometry and multivariate analysis: discrimination between wild-type and farmed salmon. Food Res Intern. 116:1258–1265. doi:https://doi.org/10.1016/j.foodres.2018.10.013.
- Giffen JE, Lesiak, AD, Dane AJ, Cody RB, and Musah RA. 2017. Rapid species-level identification of salvias by chemometric processing of ambient Ionisation mass spectrometry-derived chemical profiles. Phytochem Anal. 28(1):16–26.
- Gross H. 2014. Direct analysis in real time - a critical review on DART-MS. Anal Bioanal Chem. 406:63–80. doi:https://doi.org/10.1007/s00216-013-7316-0.
- Lian R, Wua Z, Lv X, Rao Y, Li H, Li J, Wang R, Ni C, Zhanga Y. 2017. Rapid screening of abused drugs by direct analysis in real time (DART) coupled to time-of-flight mass spectrometry (TOF-MS) combined with ion mobility spectrometry (IMS). Forensic Sci Int. 279:268–280. doi:https://doi.org/10.1016/j.forsciint.2017.07.010.
- Loos M, Gerber C, Corona F, Hollender J, Singer H. 2015. Accelerated isotope fine structure calculation using pruned transition trees. Anal Chem. 87:5738–5744. doi:https://doi.org/10.1021/acs.analchem.5b00941.
- Martínez-Villalba A, Vaclavik L, Moyano E, Galceran MT, Hajslova J. 2013. Direct analysis in real time high-resolution mass spectrometry for high-throughput analysis of antiparasitic veterinary drugs in feed and food. Rapid Commun Mass Spectrom. 27:467–475. doi:https://doi.org/10.1002/rcm.6466.
- Miano B, Righetti L, Piro R, Dall’Asta C, Folloni S, Galaverna G, Suman M. 2018. Direct analysis real-time–high-resolution mass spectrometry for Triticum species authentication. Food Addit Contam Part A. 35:2291–2297. doi:https://doi.org/10.1080/19440049.2018.1520398.
- Omar J, Boix A, von Holst C. 2015. Differentiation of coccidiostats-containing feed additives by mid and near infrared microscopy. Food Addit Contam Part A. 32:1464–1474. doi:https://doi.org/10.1080/19440049.2015.1075177.
- Pavlovich MJ, Musselman B, Hall AB. 2018. Direct analysis in real time - mass spectrometry, (DART-MS) in forensic and security applications. Mass Spectrom Rev. 37:171–187. doi:https://doi.org/10.1002/mas.21509.
- Song L, Chuah WC, Lu X, Remsen E, Bartmess JE. 2018. Ionization mechanism of positive ion nitrogen direct analysis in real time. J Am Soc Mass Spectrom. 29:640–650. doi:https://doi.org/10.1007/s13361-017-1885-7.
- Vaclavik L, Hrbek V, Cajka T, Rohlik B-A, Pipek P, Hajslova J. 2011. Authentication of animal fats using Direct Analysis in Real Time (DART) ionization-mass spectrometry and chemometric tools. J Agric Food Chem. 59:5919–5926. doi:https://doi.org/10.1021/jf200734x.
- von Holst C, Robouch P, Bellorini S, González de La Huebra MJ, Ezerskis Z. 2016. A review of the work of the EU reference laboratory supporting the authorisation process of feed additives in the EU. Food Addit Contam Part A. 33:66–77.