
ABSTRACT
A method for the determination of 21 perfluorinated and 10 polyfluorinated alkyl substances (PFAS) was developed for application in different food matrices. Acetonitrile was used as the extraction solvent with solid phase extraction weak anion-exchange (SPE-WAX) clean up, with LC-MS/MS analysis using both surrogate and performance standards to correct for losses during sample preparation and matrix effects. The method has been evaluated in four different matrices (fish, pizza, chicken nuggets and spinach). Originally, the focus was to develop a method for foods commonly thought to be a source of PFASs (e.g. fish). It was expanded to include foods where PFAS exposure would be possible through their presence in grease-proof food packaging (e.g. pizza, chicken nuggets). Vegetables (lettuce) and fruit (tomato) have recently been considered as part of proficiency testing programmes, so the inclusion of some testing in a vegetable matrix (i.e. spinach) was also added to the testing. Limits of quantification ranged from 0.018 ng g−1 (L-PFDS) to 5.28 ng g−1 (FHEA), although method quantification limits for PFBA (12.4 ng g−1), 6:2 PAP (8.96 ng g−1) and 8:2 PAP (3.49 ng g−1) were elevated above instrumental limits owing to their consistent detection in reagent blank samples. PFAS analyses were strongly impacted by matrix, therefore the use of isotopically labelled internal standards was critical to the development of accurate results. The accuracy of the method using numerous proficiency testing schemes or interlaboratory comparison studies has shown the developed method to be successful with z-scores for all concerned analytes in all test matrices remaining within ±2.0, with the exception of PFBA in wheat flour which was −2.4.
GRAPHICAL ABSTRACT
Introduction
Perfluoroalkyl and polyfluoroalkyl substances (PFASs) encompass an extensive group of alkyl compounds with fluorine substitution of all (perfluoro-) or some (polyfluoro-) of the hydrogens on the carbon chain (OECD Citation2018). The vast numbers of per- and polyfluoro-substances arise from partially fluorinated compounds, fluorinated polymers and reaction products, with >9,000 PFASs listed on the United States Environmental Protection Agency master list of PFAS substances (US EPA Citation2021). In addition to the strong, stable backbone, PFASs may have terminal carboxylic acids, sulfonic acid, alcohol, amide or phosphate groups (Buck et al. Citation2011). This structure provides PFASs with unusual characteristics in that they are both chemically stable and lipophilic, in addition to having hydrophilic terminal groups. Owing to the combination of these properties, they have been used in many applications for more than 50 years (OECD Citation2018). Their use on non-stick pans and utensils for cooking as well as grease-proofing paper used by the fast food industry was widely discussed in the early 2000s. In addition to these applications, they are present in many other products including paints, cosmetics, as firefighting foams and processing aids in the manufacture of polymers (Domingo Citation2012; Ayala-Cabrera et al. Citation2016; OECD Citation2018; EFSA Citation2020).
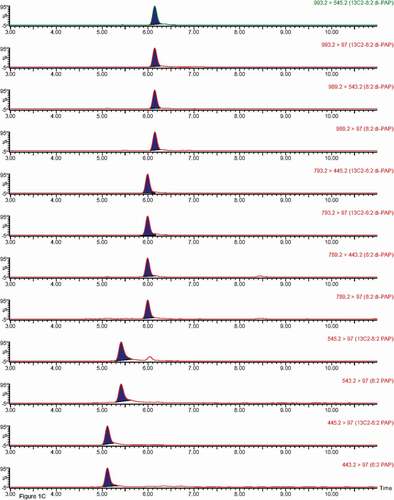
Figure 1. Chromatograms of individual PFASs, note Br-PFOS and L-PFOS appear in the same trace. A and B – carboxylic acids and sulfonate traces, while C shows PAP traces.
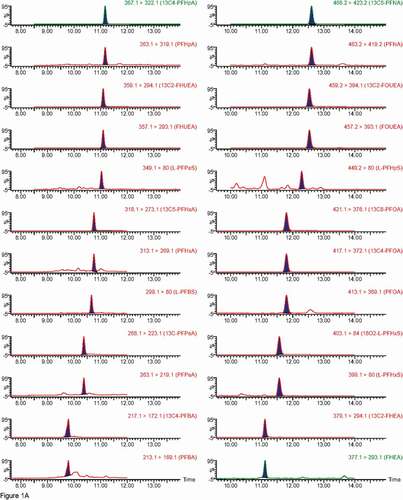
Figure 1. (Continued).
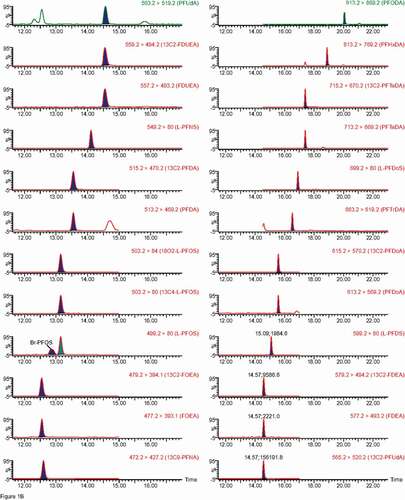
Figure 1. (Continued).
PFAS research studies have been undertaken following recognition of the widespread use of PFASs in industrial and consumer applications and understanding the implications associated with stable organohalogen compounds in the environment (Houde et al. Citation2006). The presence of PFASs has been confirmed in abiotic environmental compartments (e.g. air, water, dust) (Barber et al. Citation2007; Cornelis et al. Citation2012; Gellrich and Knepper Citation2012; Liu et al. Citation2021; Rodríguez-Varela et al. Citation2021), and also in biological organisms (Vorkamp et al. Citation2019; Pereira et al. Citation2021; Wood et al. Citation2021), including humans (Bjermo et al. Citation2013; Cariou et al. Citation2015; Papadopoulou et al. Citation2015; Vélez et al. Citation2015; Averina et al. Citation2018). Detectable concentrations of PFASs have been observed in fish and shellfish globally (Ericson et al. Citation2008; Noorlander et al. Citation2011; Stahl et al. Citation2014; Fujii et al. Citation2015).
PFAS use in consumer products also has resulted in studies to examine levels in indoor environments relative to the outdoors and confirmed that PFASs are elevated in indoor environments (Goosey and Harrad Citation2012). Unlike the traditional persistent environmental organic contaminants (e.g. polychlorinated dibenzo-p-dioxins) for which food consumption is clearly the dominant pathway for human exposure, PFAS exposure is multi-faceted. Important pathways of PFAS exposure include water and food consumption, dust ingestion, inhalation and dermal exposure. Despite the many sources of human exposure to PFASs, diet was considered to be the major route of exposure for most of the population in a recent evaluation of these compounds (EFSA Citation2020). The recent EFSA assessment on PFASs in food examined occurrence data from different food groups (e.g. fish, meat, eggs, fruits/fruit products, vegetables/vegetable products) to examine the overall dietary exposure, rather than the many studies that focus on specific food types (EFSA Citation2020). The complete assessment was performed for the well-known PFASs; PFOS and PFOA, although PFNA and PFHxS were also assessed (EFSA Citation2020).
Although perfluoro- and polyfluoroalkyl substances bioaccumulate in the tissues of living organisms, they do not bioaccumulate in the lipid tissues, but rather in tissues rich in protein, and are detected in blood, liver and kidneys (Domingo Citation2012; Bjermo et al. Citation2013; Ali et al. Citation2021). Accurate determination in food matrices of different protein content is important for proper analysis and exposure estimation.
Toxicological studies of perfluoroalkyl compounds, particularly perfluorooctanoic acid (PFOA) and perfluorooctane sulfonic acid (PFOS), have identified linkages between exposure and thyroid function and immunosuppression (Alsen et al. Citation2021). PFOA exposure has been found to suppress immune function in mice (Dewitt et al. Citation2016). Ou and coworkers (Ou et al. Citation2021) identified a relationship between gestational PFAS exposure and congenital heart defects in humans. An association between PFAS exposure and negative pregnancy outcomes (e.g. miscarriage, stillbirth, etc.) has been indicated following a global review of relevant studies (Deji et al. Citation2021). Toxicological data associated with PFAS exposure has been the focus of a thorough review of PFASs (EFSA Citation2020).
A wide variety of approaches to the extraction, clean up and analysis of PFAS in food have been reported in the literature. Alkaline digestion with sodium hydroxide in advance of extraction has been reported by Jogsten et al. and Haug et al. (Jogsten et al. Citation2009; Haug et al. Citation2010). The use of tetrabutylammonium (TBA) hydrogen sulfate solution with sodium carbonate buffer in advance of solvent extraction has also been described in the literature (Guerranti et al. Citation2013). Another pre-extraction technique employed has been the precipitation of proteins in milk samples (Cariou et al. Citation2015). In addition to using solvents employed for traditional POP analysis (e.g. acetone: hexane), methyl-tert-butyl ether, methanol, tetrahydrofuran: water and acetonitrile have been used for PFAS extraction from food (Farré et al. Citation2012; Herzke et al. Citation2013). Tetrahydrofuran: water (75:25) has been reported to effectively extract PFAS of varying chain lengths (4–14) from food matrices (Ballesteros-Gómez et al. Citation2010). A variety of sorbents have been used for clean up, including Florisil, weak anion exchange resin and carbon (Farré et al. Citation2012). LC-MS/MS generally has been used for the determination of PFAS in all matrices (Kuklenyik et al. Citation2004; Ericson et al. Citation2008; Chung and Lam Citation2014; Tang et al. Citation2014; Manzano-Salgado et al. Citation2015), although gas chromatography-mass spectrometry also has been reported (Fujii et al. Citation2015).
In the mid-2000s, our group developed a method for the determination of seven perfluorocarboxylic acids ranging in carbon chain length from seven to 14, and one perfluorosulfonic acid in food using liquid chromatography–tandem mass spectrometry (Tittlemier et al. Citation2007). The original method developed in our laboratories utilized methanol for extraction with vortex, rotary mixing and centrifugation in advance of analysis (Tittlemier et al. Citation2007). Since that time, regulatory action has been taken on perfluorooctanoic acid, perfluorooctanesulfonic acid, their salts and related compounds (Stockholm Convention Citation2019). Following regulatory action and voluntary restrictions on the use of longer chain PFASs, use of shorter chain analogues has increased as replacements (Brendel et al. Citation2018). As a result, our group was tasked with adapting the methodology developed for longer chain compounds to also include shorter chain analogues, in multiple different food matrices. The analytes considered for this method were selected based on availability of analytical standards, are consistent with the PFASs reported in environmental samples and considered as part of the recently published assessment on PFASs (EFSA Citation2020). Telomer acids were added to the list of analytes to determine whether the method would capture these compounds, with individual compounds added based on standard availability. The developed method employs the use of stable isotope correction for the determination of 13 perfluorocarboxylic acids ranging in chain length from four to 18 carbons, eight sulfonates (PFOS is determined as linear and branched isomers) with carbon chains extending from four to 12, two phosphate esters, two diphosphate esters and six telomer acids.
Materials and methods
Chemicals and reagents
Analytical standards (>98%) of perfluoro-n-butanoic acid (PFBA), perfluoro-n-pentanoic acid (PFPeA), perfluoro-n-hexanoic acid (PFHxA), perfluoro-n-heptanoic acid (PFHpA), perfluoro-n-octanoic acid (PFOA), perfluoro-n-nonanoic acid (PFNA), perfluoro-n-decanoic acid (PFDA), perfluoro-n-undecanoic acid (PFUdA), perfluoro-n-dodecanoic acid (PFDoA), perfluoro-n-tridecanoic acid (PFTrDA), perfluoro-n-tetradecanoic acid (PFTeDA), perfluoro-n-hexadecanoic acid (PFHxDA) and perfluoro-n-octadecanoic acid (PFODA) in methanol were purchased from Wellington Laboratories, (Guelph, ON, Canada). Analytical standards of perfluorosulfonates were purchased as potassium or sodium salts (>98% salt). Perfluoro-1-butanesulfonate (L-PFBS) as the potassium salt, perfluoro-1-pentanesulfonate (L-PFPeS), perfluoro-1-hexanesulfonate (L-PFHxS), perfluoro-1-heptanesulfonate (L-PFHpS) as sodium salts in methanol were purchased from Wellington Laboratories. A mixture of linear and branched isomers of perfluorooctanesulfonate (br-PFOS (total)) present as potassium salts in methanol was purchased, while perfluoro-1-nonanesulfonate (L-PFNS), perfluoro-1-decanesulfonate (L-PFDS) and perfluoro-1-dodecanesulfonate (L-PFDoS) were purchased as sodium salts in methanol, from Wellington Laboratories.
Telomer acids (>98%) prepared in isopropanol were purchased from Wellington Laboratories, including 2H-perfluoro-2-octenoic acid (FHUEA), 2H-perfluoro-2-decenoic acid (FOUEA), 2H-perfluoro-2-dodecenoic acid (FDUEA), 2-perfluorodecyl ethanoic acid (FDEA), 2-perfluorohexyl ethanoic acid (FHEA) and 2-perfluorooctyl ethanoic acid (FOEA). In addition, four polyfluoroalkylphosphate esters (PAPs) (>98%) were purchased as sodium salts in methanol: 1H,1H,2H,2H-perfluorooctylphosphate (6:2 PAP), 1H,1H,2H,2H-perfluorodecylphosphate (8:2 PAP), bis(1H,1H,2H,2H-perfluorooctyl)phosphate (6:2 diPAP) and bis(1H,1H,2H,2H-perfluorodecyl)phosphate (8:2 diPAP) from Wellington Laboratories.
Stable isotope (13C) analogues of the perfluorocarboxylic acids: 13C4 PFBA, 13C5 PFPeA, 13C5 PFHxA, 13C4 PFHpA, 13C4 PFOA, 13C2 PFUdA, 13C2 PFDA, 13C9 PFNA, 13C2 PFDoA and 13C2 PFHxDA in methanol were purchased from Wellington Laboratories, surrogate standard isotopic purity was >99% for all compounds. Similarly, stable isotope analogues of the perfluorosulfonates were purchased from Wellington Laboratories including: 18O2 PFHxS and 13C4 PFOS as sodium salts with >99% isotopic purity. Stable isotope analogues (13C2) of the telomer acids (FHUEA, FDUEA, FDEA and FHEA) and phosphate esters (6:2 PAP, 8:2 PAP and 8:2 diPAP) also were purchased as sodium salts from Wellington Laboratories and were similarly of >99% isotopic purity. In addition to the surrogates, 13C5 PFNA, 13C2 PFTeDA, 13C2 FOEA, 13C2 FOUEA and 13C2 6:2 diPAP were purchased from Wellington Laboratories as performance standards (>99% isotopic purity), while 13C8 PFOA (99% isotopic purity) was purchased from Cambridge Isotope Laboratories Inc. (Tewksbury, MA, USA) and 18O2-ammonium–PFOS (>99% labelled) was purchased from RTI International (Research Triangle Park, NC, USA).
Optima LC/MS grade acetonitrile, water, 2-propanol and methanol were purchased from Fisher Scientific (Ottawa, ON, Canada). Optima LC/MS grade formic acid, ammonium formate and ammonium acetate were similarly purchased from Fisher Scientific while ammonium hydroxide was purchased from either Fisher Scientific or Sigma-Aldrich (Oakville, ON, Canada). Nitrogen gas (ultra-pure) was purchased from Linde Canada Inc. (Ottawa, ON, Canada) and purified water was obtained by passing de-ionised water through a Millipore system (18.2 Ω cm, Sigma-Aldrich, Oakville, ON, Canada).
Calibration standards
Six-point calibration curves above the zero concentration point (2-propanol with isotope-labelled compounds) were developed for each analyte (). The calibration range varied between compounds, based on relative sensitivity and 3 µL injection volumes were used for all calibrants. The calibration point with no analytes added was generally free of all compounds except the added surrogates and performance standards throughout the work. If the presence of analytes was observed in the ‘zero concentration’ point, it was used as a trigger to clean the instrument. Branched-PFOS (isomer 3–11) was the most sensitive analyte and the calibration range extended from 0.05 pg µL−1 to 12.4 pg µL−1 (). The calibration standards for PFHxA, PFNA, PFDA, PFUdA, PFDoA and L-PFOS + isomer 2 were between 0.2 and 50 pg µL−1, while the majority of compounds (carboxylic acids: PFHpA, PFOA, PFTrDA, PFTeDA, PFHxDA, PFODA, sulfonates: L-PFBS, L-PFPeS, L-PFHxS and L-PFHpS, L-PFNS, L-PFDS and L-PFDoS) ranged from 0.1 to 25 pg µL−1. The calibrants for 6:2 diPAP and 8:2 diPAP ranged in concentration from 0.1 to 5 pg µL−1, although 6:2 PAP and 8:2 PAP, which were less sensitive, were prepared in calibration curves extending from 0.5 to 25 pg µL−1. PFBA and PFPeA calibration standards ranged from 1 to 50 pg µL−1. Telomer acids (FHUEA, FOUEA and FDUEA) ranged from 0.2 to 20 pg µL−1 and the remaining telomer acids (FHEA, FOEA and FDEA) ranged from 2 to 200 pg µL−1. All calibration curves followed a linear regression with correlation coefficients of ≥0.99, with the exception of L-PFDoS (). Deviation from anticipated concentrations was generally <10%, with average deviations ranging from 1.11% to 2.84%.
Table 1. Analyte information including transitions monitored, surrogate standard selection and linearity of response established using LC-MS/MS
All surrogate standards were present in calibration solutions at 10 pg µL−1 with a few exceptions, including 13C2 FHEA and 13C2 FDEA which were present at 100 pg µL−1 (). 13C2 6:2 and 8:2 PAPs were present in calibration standards at 2.5 pg µL−1 while 13C2 8:2 diPAP was present at 1 pg µL−1. Performance standards were similar for most PFAS, present at 10 pg µL−1 with the exception of 13C2 FOEA (100 pg µL−1). 13C2 6:2 diPAP was used as a performance standard for the PAPs and diPAPs (1 pg µL−1). Representative isotope-labelled compounds were selected as surrogate standards by class (carboxylic acid, sulfonate, etc.) to align similar chemicals and hence optimizing the efficacy of the surrogates. Performance standard selection was identified similarly, to ensure that the method utilized the isotope-labelled compounds most effectively.
Table 2. List of surrogates and performance standards
Evaluation
Evaluation studies were performed using archived composite samples collected and prepared as part of the Canadian Total Diet Study (Government of Canada, Citationn.d.). The protocol for sample collection as part of the Canadian Total Diet Study involved the collection of equivalent food samples from four different stores in the city of collection (Fish: Montréal, QC; Pizza: Ottawa, ON). Tuna and salmon (3:1) comprised the canned fish composites and mixed topping pizzas from fast food outlets obtained in grease-proofed cardboard were used in this work. The samples were shipped to the laboratory where the foods (e.g. pizza) from each store were combined and homogenised thoroughly, followed by the preparation of individual aliquots (~50 g) for analysis. Uncooked food items were cooked following long-used recipes. The cooked foods were then thoroughly homogenised prior to aliquot preparation. Aliquots of the homogenised foods were used for the method testing and PFAS present in the Total Diet Study samples were subtracted from the concentrations determined in fortified samples. Evaluation was performed over three fortification levels in two matrices with five replicates at each level of fortification (see supplementary information Tables S1–S2). Initial evaluation of the method focused on the perfluorocarboxylic acids and perfluorosulfonates with the telomer acids and phosphate esters being added later.
The two primary matrices, archived Canadian Total Diet Study samples of canned fish (2013) and commercial pizza (2011) were selected for evaluation because they are very different in nature, yet both relevant in terms of possible PFAS detection (e.g. fish: due to bioaccumulation from environmental contamination, pizza: impacted by grease-proofing present in food packaging). Fish and shellfish have been widely reported to have detectable levels of PFAS globally and are thought to be an important route of exposure for PFAS in humans (Chung and Lam Citation2014; Pérez et al. Citation2014; Stahl et al. Citation2014; Ali et al. Citation2021).
Follow-up work was performed using archived chicken nuggets from the Canadian Total Diet Study (2013; Ottawa, ON) over three fortification levels. Chicken nugget samples were homogenised composites of samples collected from fast food restaurants (see supplementary information Table S3), similar to the pizza collection. Archived spinach composites from samples obtained in 2013, made from raw spinach and spinach boiled in tap water for 1 min (1:1) were tested at two fortification levels (supplementary Table S4).
Method development was performed by one analyst, although two analysts evaluated the method via participation in interlaboratory comparison studies and proficiency test sample analysis.
Quality assurance testing
With each set of samples tested, a reagent blank sample was subject to the complete sample preparation and used to assess background levels in the laboratory. In addition, a matrix blank (i.e. an aliquot of unfortified food) was included with each set to correct for any PFASs present in the samples prior to fortification during method evaluation work. To determine the impact of matrix, an unfortified sample was prepared for analysis alongside each sample type being evaluated. Following extraction and clean up, the unfortified sample was fortified at the same level as the samples in each set, to gain insight into the impact of matrix on the results.
Proficiency test samples
Once the method was tested using fortified samples, our group participated in a number of proficiency test schemes for PFASs and interlaboratory comparison studies. Most tests included one or two samples and the present method has been primarily tested using fish test materials. Fish samples were named differently by the domestic and international programmes leading the testing and were identified as fish (n = 5), pike-perch (n = 1), perch (n = 1), freeze-dried fish tissue (n = 1) and fish tissue (n = 1). In addition to fish samples, the method was assessed with prawns (n = 2), wheat flour (n = 2), egg yolk (n = 1), tomato (n = 1) and lettuce (n = 1). Two fish samples were analysed in 2016 (24 and 29 participants), 2017 (29 participants), 2018 (33 participants) and 2019 (25 participants) (). The fish tissue was analysed in 2017, similar to the dried fish tissue with 14 laboratories participating. Pike-perch was tested in 2015 with 17 labs having participated in the comparison testing, whereas only 10 labs reported results for the perch in 2019 (). Prawn samples were analysed in 2018 (33 participating labs) and 2020 (21 labs participated). Wheat flour samples were both analysed in 2019 and there were 29 laboratories that participated in the comparison (). Egg yolk was tested in 2017 with 25 participants reporting results while tomato and lettuce were the test matrices in 2019 and 2020, respectively. The number of participants in these studies were 25 and 21, respectively ().
Figure 2. Proficiency test z-scores for PFASs in fish and prawns; note PFOA and ΣPFOS data provided in graphical abstract.
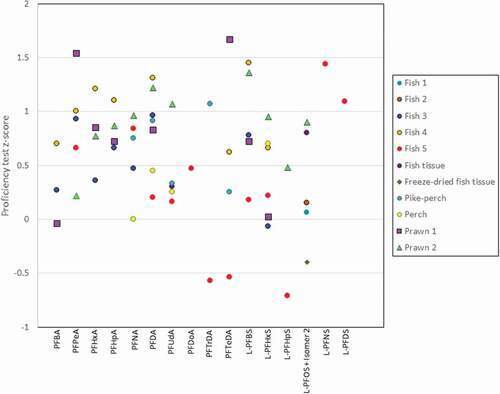
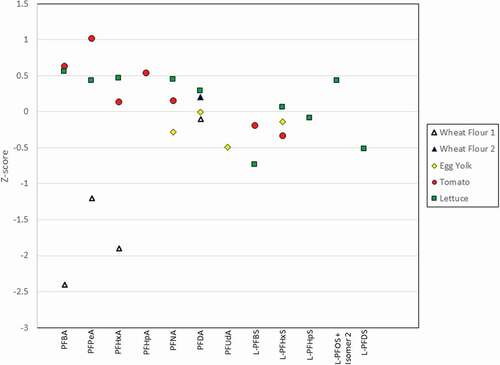
Figure 3. Proficiency test z-scores for PFASs in proficiency test materials; note PFOA and ΣPFOS data provided in graphical abstract.
Extraction
To avoid contamination of samples during sample preparation or loss due to glass adsorption, polypropylene products were used while preparing samples for analysis. Samples were thawed at 4°C in advance of initiating preparation for analysis. Individual samples (2 g) were weighed into 15 mL polypropylene centrifuge tubes that had been rinsed with methanol and allowed to dry under ambient conditions prior to addition of the sample. Water (2 mL) was used in the place of sample for the reagent blank. Each tube containing sample, reagent blank, etc., was fortified with 42 µL of stable isotope-labelled PFAS analogues (250 pg µL−1 [5.25 ng g−1] 13C4 PFBA, 13C4 PFPeA, 13C5 PFHxA, 13C4 PFHpA, 13C4 PFOA, 13C2 PFUdA, 13C2 PFDA, 13C9 PFNA, 13C2 PFDoA, 13C2 PFHxDA, 18O2 L-PFHxS, 13C4 PFOS, 13C2 FHUEA, 13C2 FDUEA; 2500 pg µL−1 [52.5 ng g−1] 13C2 FDEA, 13C2 FHEA; 62.5 pg µL−1 [2.63 ng g−1] 13C2 6:2 PAP, 13C2 8:2 PAP; 25 pg µL−1 [0.53 ng g−1] 13C2 8:2 diPAP). The samples were briefly vortexed and allowed to sit at ambient temperature on the laboratory bench for 30 min prior to commencing extraction.
Acetonitrile (3 mL) was added to each sample and each tube was vortexed for 30 s, followed by sonication for 15 min at ambient temperature. In a situation where vortex and sonication did not appear to break apart the sample thoroughly (e.g. pizza with small pieces of hard crust), the samples were homogenised using a tissue homogeniser (OMNI-TH with G10-95 stainless steel generator probe, Omni International, Marrietta, GA, USA) for 15 s. The samples were mixed using a vortex mixer for an additional 30 s and rotated with solvent using a Roto-torque variable speed rotator (Cole-Parmer, Montreal, QC, Canada) for 5 min. Samples were then centrifuged for 10 min at 12,857 × g at 10°C (Eppendorf, Mississauga, ON, Canada). Supernatants were removed and transferred to a clean 15 mL polypropylene centrifuge tube using a polypropylene pipette.
Following removal of the raw extract, samples were re-extracted an additional two times, as described above and the resultant supernatants were combined after each centrifugation. Once combined, extracts were allowed to remain in a refrigerator (4°C) overnight and re-centrifuged in the morning, as described above to remove precipitated material. If a precipitate was observed, the extracts were then transferred to a clean centrifuge tube. Extracts were concentrated to 2 mL (3 mL for reagent blanks) under a gentle stream of nitrogen in a water bath set to 40°C (Meyer N-evap analytical evaporator, Organomation, Model 111, Berlin, MA, USA). Each tube was diluted to 10 mL using purified water and vortexed for 10 s prior to initiation of sample clean up.
Clean up
Clean up was performed using 6 cc, 150 mg Oasis solid phase extraction–weak anion exchange (SPE-WAX) cartridges (Waters Corporation, Mississauga, ON, Canada). Cartridges were conditioned first with one cartridge volume of methanol, followed by one volume of purified water. If samples appeared cloudy or a precipitate was observed, the extracts were centrifuged for 10 min at 12,857 × g to separate and remove precipitates prior to loading extracts onto the cartridges. If centrifugation was not required, the diluted extracts were loaded directly onto the cartridge and eluted by gravity and the effluent was discarded.
Prior to elution, cartridges were rinsed with 1 mL aqueous formic acid (2%) followed by 2 mL purified water. Each cartridge was dried under vacuum for 1 min and then washed with methanol (3 mL). The first 1 mL of methanol was discarded while the remaining 2 mL were collected and combined with the analytes and surrogate PFASs that eluted using 3 mL 1% ammonium hydroxide in methanol by gravity, with 5 s vacuum to collect any remaining droplets.
Following collection, the eluates were concentrated just to dryness under a gentle stream of nitrogen in a water bath held at 40°C to allow more timely analysis of the samples than if they were left to passively evaporate. Analyte recovery was not impacted using this approach. The extracts were diluted to 1 mL in isopropanol and vortexed for 10 s. The final extracts were then transferred into 2 mL propylene microcentrifuge tubes and centrifuged at 17,000 × g for 10 min using a microcentrifuge (Fisher Scientific, Ottawa, ON, Canada). From each supernatant, two, 400 µL aliquots were removed and transferred to separate 500 µL polypropylene microvials and prepared for analysis by the addition of performance standards. One aliquot was taken for carboxylic acid, sulfonate and telomer acid analysis while the second aliquot was retained for PAP analysis. Prior to carboxylic acid, sulfonate and telomer acid analysis, the performance standards: 13C8 PFOA, 13C5 PFNA, 13C2 PFTeDA, 13C2 FOUEA, 18O2 PFOS, 13C2 FOEA were added, while 13C2 labelled 6:2 diPAP was added to the extract aliquots planned for analysis of PAPs. Vials were capped using polypropylene caps, mixed by hand and stored at 4°C until ready for analysis.
Following completion of the initial method testing with fish and pizza, the method was evaluated in two other matrices. Chicken nuggets and spinach were used for the second phase of evaluation and the method was tested using reduced sample sizes (1 g) in an effort to reduce matrix artefacts. In addition, the cartridges were conditioned first with 10 mL 0.1% ammonium hydroxide in methanol, followed by 10 mL purified water prior to use, then rinsed with 3 mL of 20 mM ammonium acetate: methanol (1:5, v/v) at pH 4, followed by 2 mL methanol:water (1:5, v/v) after the sample extracts were loaded onto the column.
Analysis
Instrumental analysis of the carboxylic acids and sulfonates was performed using a Waters Acquity ultra-high pressure liquid chromatograph I-Class coupled to a Waters Xevo TQ-XS triple quadrupole mass spectrometer (Waters Corporation, Milford, MA, USA) with electrospray ionization operating in the negative ion detection mode. Given that PFASs are used in the manufacture of Teflon non-stick coatings, Teflon coated solvent lines were replaced with polyether ether ketone (PEEK) tubing to minimize any PFAS contamination in the chromatographic system. A Phenomenex Gemini – NX C18 column (3 µm, 2 × 150 mm) with a securityGuard ULTRA C18 guard cartridge, AJO-8782 (Phenomenex, Torrance, CA, USA) was used for analysis. A Phenomenex Kinetex EVO C18 column (5 µm, 100 × 2.1 mm) was installed after the solvent mixer and before the sample injector as a delay column to trap system-related PFAS interferences from co-eluting with analytes from the sample. A gradient elution of the mobile phase was applied (mobile phase A: 5 mM aqueous ammonium formate, mobile phase B: acetonitrile: methanol [1:1, v/v]). Mobile phase A was set to 95% for the first 4 min of each chromatographic run, by 7 min mobile phase A was reduced to 40% and further lowered to 5% by 19 min where it remained until 22 min. By 23 min, mobile phase A was re-established at 95% where it remained until the end of each chromatographic run. The flow rate was held at 0.175 mL min−1 for the complete run, with the exception of the period between 23 and 25.1 min where it was increased to 0.250 mL min−1. The capillary voltage was 2.5 kV. The cone and desolvation gases were nitrogen, set at a flow of 170 L h−1 and 1,000 L h−1, respectively. The collision gas was argon set to a flow rate of 0.15 mL min−1 and resolution was established using unit mass resolution. The source temperature was set to 150°C while the desolvation temperature was 400°C. The nebuliser gas (nitrogen) flow was set to 6.0 Bar. Injection volumes were 3 µL.
Analysis of PAPs was completed using the same Waters LC-MS/MS system with electrospray ionization operating in the negative ionization mode. Separation was performed on a Phenomenex Gemini NX C18 column (3 µm, 2 × 150 mm) and the securityGuard ULTRA C18 guard cartridge column was also used for these analyses, although a delay column was not required. Optimization of the PAPs analysis required a different mobile phase than was suitable for the carboxylic acids, sulfonates and telomer acids, requiring separate analyses. Mobile phase A was 2 mM ammonium acetate and 10 mM ammonium hydroxide in water, adjusted to pH 9–9.5 and mobile phase B was LC/MS grade methanol. A gradient elution began with 80% mobile phase A where it remained until 2 min, and by 4 min mobile phase A was reduced to 5% where it remained until 10 min. By 11 min the ratio of mobile A to B was returned to the initial setting (80% mobile phase A). The flow rate was maintained at 0.175 mL min−1 with the exception of the period between 11.10 and 16.00 min when it was 0.200 mL min−1. As with the previous instrumental method, all injections were 3 µL. The capillary voltage was 3.0 kV. Nitrogen was used as both cone and desolvation gases, set at a flow of 300 L h−1 and 1,000 L h−1, respectively. The collision gas was argon set to a flow rate of 0.15 mL min−1 and resolution was established using unit mass resolution. The source temperature was set to 150°C while the desolvation temperature was 500°C. The nebuliser gas (nitrogen) flow was set to 6.0 Bar.
Instrumental analysis of both fractions for individual sets of samples was able to be completed in a single day, although more frequently, multiple sets of extracts were analysed for carboxylic acids/sulfonates at one time. Similarly, a series of multiple sets of samples for PAP determination were analysed collectively to optimize productivity.
Results and discussion
Method development
Extraction using solvents of different polarity (e.g. acetone, hexane) initially had been evaluated, but the recoveries were unsatisfactory. The method first reported from our laboratory for the determination of PFAS used methanol as the extraction solvent followed by limited clean up (i.e. centrifugation) was found to be inadequate as the number of analytes was expanded to meet the new requirements. For example, the recoveries of the longer chain compounds were consistently poor (<10%) using the original method. The inclusion of charcoal (untreated powder 100–400 mesh) in the extraction tube with methanol was found to improve recoveries of the long chain PFAS (84–104%). Unfortunately, PFODA recoveries were extremely high (>500%) using this approach. In addition, extraction using tetrahydrofuran: water was evaluated and although several carboxylic acids and sulfonates were recovered (69–136%), longer chain length compounds had poor recovery (1–30%). Additionally, the telomer acids were not recovered using this solvent system.
The selection of acetonitrile resulted in improved recoveries; however, clean up of extracts was important in addressing the matrix artefacts present in the raw extracts. Our testing included the evaluation of charcoal, size exclusion/hydrophobic interaction cartridges, SPE Si-fluorochrom and SPE-WAX. Results obtained using SPE-WAX clean up provided the most consistent recoveries for analytes belonging to all the PFAS sub-groups (e.g. carboxylic acids, sulfonates, telomer acids, PAPs) while other clean up methods resulted in inconsistent recoveries among the PFAS sub-groups of interest (Supplementary Table S5).
The developed method was assessed based on the following general method characteristics: linearity of instrument response, applicable range, limits of detection, accuracy and precision of method, and matrix impacts. Despite PFASs having similar structural backbones, analytes investigated had variable terminal ends, including carboxylic acids, sulfonic acids and phosphate esters. As a result, instrument sensitivity varied considerably between analyte calibration curves. Analyte linearity was generally determined over two orders of magnitude and extended beyond the concentration anticipated to be present in food samples. PFOS and PFOA have been observed in food samples at concentrations <10 ng g−1 whole weight more frequently than other PFASs (e.g. PFHpA, PFNA) which, when detected similarly, remained <10 ng g−1 ww (Tittlemier et al. Citation2007; Ericson et al. Citation2008; Haug et al. Citation2010). In all but one case, the correlation coefficients (r2) were ≥0.99 ().
Instrumental approach
While the ideal situation involves the determination of two transitions for analyte confirmation, in order to maintain >10–15 data points for a well-defined LC peak shape, the MRM cycle time had to be short to accommodate the narrow LC peaks observed. Much of the method development work for the method described was performed using a Waters Premier XE using the two most sensitive MRM transitions for each analyte. As the number of analytes, corresponding surrogates, and performance standards were added, the method was not able to sustain so many transitions. As a result, it was decided to use a single MRM transition for each compound because it was determined that if two transitions were retained for all the compounds in the expanded method, the shared dwell time for each peak would be insufficient to provide enough data points to allow for quantitative results. In the present method, a comprehensive sample clean up was performed, good chromatographic separation was achieved, standard calibration curves had good linearity and a strong QC protocol was followed using both reagent and matrix blanks throughout each sequence. Isotope-labelled standards have been used for both recovery and performance correction so both impacts of sample preparation and instrument matrix effects are taken into account in the method. When considering the complete method from sample preparation to instrumental analysis, it was determined that a single transition would be acceptable to overcome potential interference issues. Other researchers have reported successful PFAS methods similarly using single transitions (Genualdi and deJager Citation2019; Shoemaker and Tettenhorst Citation2020; Pierri et al. Citation2020).
Limits of detection/quantification
Instrumental detection limits were generally low for all compounds, ranging from 0.006 ng g−1 (L-PFDS) to 1.76 ng g−1 (FHEA), with corresponding limits of quantification (LOQ) of 0.018 ng g−1 to 5.28 ng g−1, respectively (). Limits of detection (LOD) were routinely re-examined throughout the method development and evaluation work to ensure that the reported limits would be representative of the system under operational conditions (i.e. freshly cleaned, after it had been used for a period, etc.). Presence of perfluorinated compounds in the environment has been reported in the literature (Taniyasu et al. Citation2005), including indoor environments (Goosey and Harrad Citation2012) and, as a result, blanks were used to assess background concentrations in the laboratory. Background levels of 14 analytes were detected in reagent blank samples, at low concentrations, which indicated laboratory background contamination (). As a result, method detection limits for the analytes present in reagent blanks were established by summing the mean concentration in the reagent blanks plus three times the standard deviation (SD) of the mean values (), rather than based on instrumental limitations, consistent with the AOAC guidelines for determination of detection limits (Shrivastava and Gupta Citation2011). Limits of quantification were established by multiplying the LOD by 3. Most compounds were present at sufficiently low levels that LOD remained below 0.5 ng g−1, however elevated limits of detection/quantification for PFBA (4.12 ng g−1/12.4 ng g−1), 6:2 PAP (2.99 ng g−1/8.96 ng g−1) and 8:2 PAP (1.16 ng g−1/3.49 ng g−1) were observed relative to instrumental detection limits. Consistent with our laboratory protocol, concentrations observed in reagent blanks were subtracted from the sample concentrations throughout the work. Blank subtraction was performed by pairing reagents blanks with samples from the corresponding set to ensure that blank subtraction was set specific.
Table 3. Instrumental limits of detection (LOD) and limits of quantification (LOQ) determined for method analytes
For those compounds not observed in reagent blanks, the signal-to-noise ratio, corrected for sample weight and final volume, was used to determine the method detection limit.
Matrix impacts
Fortification of fish and pizza was performed at three levels (low [0.104 ng g−1 branched PFOS (isomer 3–11) – 13.1 ng g−1 FHEA, FOEA, FDEA], medium [0.522–52.5 ng g−1], high [2.10 ng g−1 6:2 and 8:2 diPAPs – 131 ng g−1 FHEA, FOEA, FDEA]) and evaluation was completed with five replicates (, respectively). Chicken nuggets were fortified at similar concentrations (), while spinach, a matrix rich in colour, was evaluated to determine the impact of colour on method performance at the low and mid-level of fortification ().
Table 4. Summary of recovery information for analytes in canned fish samples
Table 5. Summary of recovery information for analytes in pizza
Table 6. Summary of recovery information for analytes in chicken nuggets
Table 7. Summary of recovery information for analytes in spinach
Although the method testing with fish matrix was largely successful at all fortification levels, pizza having multiple matrices present (e.g. crust, mushrooms, cheese, etc.), provided additional challenges. During method testing with fish, 13C4 PFOS was used as a surrogate for L-PFHpS quite successfully; however, enhancement (132–200%) was observed for this analyte in pizza extracts at all fortification levels using 13C PFOS. The introduction of 18O2 L- PFHxS as a surrogate replacement for 13C PFOS led to improved L-PFHpS recoveries (75.1–106%) in pizza over all levels of fortification. This resulted in the decision to complete the evaluation in all matrices using 18O2 L-PFHxS as the surrogate for L-PFHpS. The adoption of the structurally more appropriate surrogate standard allowed the work to proceed, given that the method is planned for application with many different matrices and developing matrix-matched standards would limit the progress of the work. Pizza extracts, noted to have matrix artefacts, fortified at the lowest levels, had good peak shape and separation, consistent with what was observed in other simpler matrices ().
Post-extraction fortification
Post-extraction fortification of samples provided insight into the effect of each food matrix on PFAS recovery. The matrix impacted PAP recoveries in each of the four matrices evaluated. Inhibition of both transitions monitored for 6:2 diPAP was observed in fortified fish and pizza extracts () at the low level (0.105 ng g−1). In contrast, enhancement of 6:2 diPAP was noted in chicken nugget extracts fortified at all levels (115–151%). Both 6:2 PAP and 8:2 PAP were found to have enhancement in the samples fortified post-extraction in the case of both chicken nuggets and spinach (109–156%; ). Additionally, L-PFDoS was subject to enhancement in the post-extraction fortification samples of chicken nuggets and spinach (156–182%).
Recovery experiments – accuracy, precision
Performance/surrogate standards
Results of the method were developed using both surrogate standards to correct for sample loss during sample preparation and performance standards to adjust for poor injections and/or matrix artefacts. The use of performance standards to adjust for matrix effects and injection issues was particularly beneficial given the analyte sensitivity to matrix. Performance standard deviations ranged from −79% (13C2 FOEA) in spinach to 160% (18O2 PFOS) in chicken nuggets. Average surrogate standard recoveries ranged from 26% (13C FDEA) to 80% (13C PFHxA), although a single sample of pizza had <10% recovery of 13C FDUEA, 13C PFUdA, 13C FDEA, 13C PFDoA and 13C PFHxDA. The application of performance standards to compensate for signal enhancement or inhibition due to matrix artefacts aided in the accuracy of analyte concentration measurements while surrogate standards adjusted for analyte loss during sample preparation.
Analyte recovery
Recoveries of a number of analytes were found to be low in more than one matrix, at low fortification levels. Standard deviations varied most widely at the low fortification level across all matrices tested. Low mean recoveries from fish at the low fortification level were observed for PFHxA, FOUEA, PFDoA and L-PFDoS (). In addition, PFODA was observed to have low recoveries at all levels of fortification (mean recovery 56.4–68.4%) of canned fish. Inhibition of the telomer acids FOUEA (average recoveries 63.2% and 54.1%, low and high fortification, respectively) and FOEA (mean recovery 52.2–62.0%) was observed in pizza samples at multiple levels of fortification, similar to L-PFNS (mean recovery 55.0–59.7%) and L-PFDS (mean recovery 31.4–40.3%) (). L-PFDS was observed to have poor recoveries from chicken nuggets (mean recovery 42.0–56.8%) (). Low recovery of L-PFHxS (67.4%), and L-PFHpS (65.1%) and 8:2 PAP (46.5%) was achieved from spinach fortified at the low level. 6:2 diPAP (mean 60.7–70.7%) had low recovery from both low and mid-level fortification.
In addition to inhibition, some analytes were subject to enhancement resulting in elevated recoveries even with the use of surrogates and performance standards. 6:2 PAP and 8:2 PAP recoveries were elevated at the low fortification level (169% and 135%, respectively) in fish samples. Both transitions monitored for 6:2 diPAP were subject to enhancement in fish (mean recoveries 166–265%) and chicken nuggets (147–170%) at all levels of fortification. Enhancement of PFTrDA was observed in pizza, chicken nuggets and spinach at more than one fortification level, similar to L-PFDoS (). Enhancement of another late-eluting compound (PFODA) was only observed in pizza at both the mid and high fortification level (178% and 245%, respectively).
Proficiency tests
In addition to our internal evaluation, our laboratory participated in a number of proficiency test programmes and interlaboratory comparison studies to evaluate our method. We participated in proficiency testing available via the National Measurement Institute (Australia), Norwegian Institute of Public Health’s Interlaboratory Comparison of persistent organic pollutants in food, the Northern Contaminants Program/Arctic Monitoring Assessment Program interlaboratory comparison (Canada) and the European Union Reference Laboratory interlaboratory comparison. Samples in the testing included both incurred and fortified samples to encompass the range of concentrations from near the detection limit extending to the regulatory levels. The majority of testing was based on PFAS determination in fish (n = 9) samples, although additional proficiency test materials have been evaluated during this work, including egg yolk (n = 1), tomato (n = 1), wheat flour (n = 2) and lettuce (n = 1). Although we participated in numerous programmes to evaluate our method, not all analytes were included in each testing scheme.
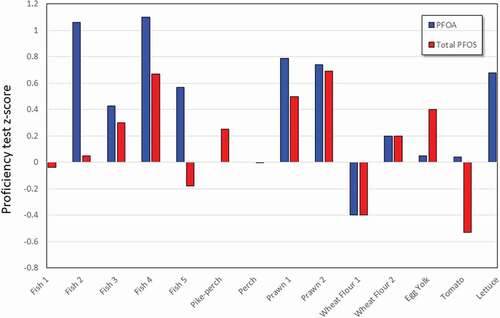
PFOA and total PFOS have been determined in multiple proficiency testing schemes and interlaboratory comparisons with the results from our method resulting in z-scores of <2 (graphical abstract). Z-scores are calculated by subtracting the assigned/consensus value from the result reported by participants and dividing the result by the target standard deviation. Z-scores that are ±2.0 are considered satisfactory results. The fish and prawn samples had the greatest number of analytes and the results of the method produced satisfactory results for all compounds (). In all cases, the present method resulted in z-scores of < ±2.0 regardless of matrix, with one exception, PFBA in wheat flour, where the z-score obtained was −2.4 (). All z-scores obtained for proficiency tests and interlaboratory comparisons using fish or shellfish matrices were within the satisfactory range, with a maximum z-score of 1.67 observed for PFTeDA in prawn. Matrix impacts are particularly important in some foods (e.g. pizza), however, the correct choice of surrogate standard aids in addressing enhancement issues.
The described method allows for the determination of carboxylic acid, sulfonate, telomer acid and polyfluoroalkylphosphate ester PFASs in complex food matrices. It is recognized that some of the longer chain PFASs (e.g. PFTrDA, L-PFDoS, PFODA) and PAPs are more prone to enhancement of recoveries. Although these observations have been noted, the method is applicable to an expanded suite of analytes relative to our original method. Continued efforts to reduce matrix artefacts will aid in the quantitative determinations of all analytes at all concentration levels.
Supplemental Material
Download MS Word (98.9 KB)Acknowledgments
The authors thank Dr. Benjamin P.-Y. Lau for additional insight into the approach for expanding the instrumental method, Amy R. Sadler for participating in the final testing of samples to confirm method applicability and Sue C. Quade for her effort to review the manuscript in detail.
Disclosure statement
No potential conflict of interest was reported by the authors.
Supplementary material
Supplemental data for this article can be accessed on the publisher’s website.
Additional information
Funding
References
- Ali AM, Sanden M, Higgins CP, Hale SE, Alarif WM, Al-Lihaibi SS, Ræder EM, Langberg HA, Kallenborn R. 2021. Legacy and emerging per- and polyfluorinated alkyl substances (PFASs) in sediment and edible fish from the Eastern Red Sea. Environ Pollut. 280:116935. doi:https://doi.org/10.1016/j.envpol.2021.116935.
- Alsen M, Sinclair C, Cooke P, Ziadkhanpour K, Genden E, van Gerwen M. 2021. Endocrine disrupting chemicals and thyroid cancer: an overview. Toxics. 9(1):1–26. doi:https://doi.org/10.3390/toxics9010014.
- Averina M, Brox J, Huber S, Furberg AS. 2018. Perfluoroalkyl substances in adolescents in northern Norway: lifestyle and dietary predictors. The Tromsø study, Fit Futures 1. Environ Int. 114:123–130. doi:https://doi.org/10.1016/j.envint.2018.02.031.
- Ayala-Cabrera JF, Núñez O, Moyano E. 2016. Liquid chromatography-mass spectrometry in the analysis of perfluorooctanoic acid (PFOA): occurrence in food. In: Hampton E, editor. Perfluorooctanoic acid (PFOA): global occurrence, exposure and health effects. Hauppauge, New York: Nova Science Publishers Inc; p. 53–88.
- Ballesteros-Gómez A, Rubio S, van Leeuwen S. 2010. Tetrahydrofuran-water extraction, in-line clean-up and selective liquid chromatography/tandem mass spectrometry for the quantitation of perfluorinated compounds in food at the low picogram per gram level. J Chromatogr A. 1217(38):5913–5921. doi:https://doi.org/10.1016/j.chroma.2010.07.032.
- Barber JL, Berger U, Chaemfa C, Huber S, Jahnke A, Temme C, Jones KC. 2007. Analysis of per- and polyfluorinated alkyl substances in air samples from Northwest Europe. J Environ Monit. 9(6):530–541. doi:https://doi.org/10.1039/b701417a.
- Bjermo H, Darnerud PO, Pearson M, Barbieri HE, Lindroos AK, Nälsén C, Lindh CH, Jönsson BAG, Glynn A. 2013. Serum concentrations of perfluorinated alkyl acids and their associations with diet and personal characteristics among Swedish adults. Mol Nutr Food Res. 57(12):2206–2215. doi:https://doi.org/10.1002/mnfr.201200845.
- Brendel S, Fetter É, Staude C, Vierke L, Biegel-Engler A. 2018. Short-chain perfluoroalkyl acids: environmental concerns and a regulatory strategy under REACH. Environ Sci Eur. 30(1):1–11. doi:https://doi.org/10.1186/s12302-018-0134-4.
- Buck RC, Franklin J, Berger U, Conder JM, Cousins IT, Voogt PD, Jensen AA, Kannan K, Mabury SA, van Leeuwen SPJ. 2011. Perfluoroalkyl and polyfluoroalkyl substances in the environment: terminology, classification, and origins. Integr Environ Assess Manag. 7(4):513–541. doi:https://doi.org/10.1002/ieam.258.
- Cariou R, Veyrand B, Yamada A, Berrebi A, Zalko D, Durand S, Pollono C, Marchand P, Leblanc J, Antignac JP, et al. 2015. Perfluoroalkyl acid (PFAA) levels and profiles in breast milk, maternal and cord serum of French women and their newborns. Environ Int. 84:71–81. doi:https://doi.org/10.1016/j.envint.2015.07.014.
- Chung SWC, Lam CH. 2014. Development of an ultraperformance liquid chromatography-tandem mass spectrometry method for the analysis of perfluorinated compounds in fish and fatty food. J Agric Food Chem. 62(25):5805–5811. doi:https://doi.org/10.1021/jf502326h.
- Cornelis C, D’Hollander W, Roosens L, Covaci A, Smolders R, Van Den Heuvel R, Govarts E, Van Campenhout K, Reynders H, Bervoets L. 2012. First assessment of population exposure to perfluorinated compounds in Flanders, Belgium. Chemosphere. 86(3):308–314. doi:https://doi.org/10.1016/j.chemosphere.2011.10.034.
- Deji Z, Liu P, Wang X, Zhang X, Luo Y, Huang Z. 2021. Association between maternal exposure to perfluoroalkyl and polyfluoroalkyl substances and risks of adverse pregnancy outcomes: a systematic review and meta-analysis. Sci Total Environ. 783:146984. doi:https://doi.org/10.1016/j.scitotenv.2021.146984.
- Dewitt JC, Williams WC, Creech NJ, Luebke RW. 2016. Suppression of antigen-specific antibody responses in mice exposed to perfluorooctanoic acid: role of PPAR and T- and B-cell targeting. J Immunol. 13(1):38–45.
- Domingo JL. 2012. Health risks of dietary exposure to perfluorinated compounds. Environ Int. 40(1):187–195. doi:https://doi.org/10.1016/j.envint.2011.08.001.
- Ericson I, Martí-Cid R, Nadal M, Van Bavel B, Lindström G, Domingo JL. 2008. Human exposure to perfluorinated chemicals through the diet: intake of perfluorinated compounds in foods from the Catalan (Spain) market. J Agric Food Chem. 56(5):1787–1794. doi:https://doi.org/10.1021/jf0732408.
- [EFSA] European Food Safety Authority. 2020. Scientific opinion on the risk to human health related to the presence of perfluoroalkyl substances in food. EFSA J. 18(9):6223, 391. doi:https://doi.org/10.2903/j.efsa.2020.6223.
- Farré M, Llorca M, Pérez S, Barceló D. 2012. Perfluorinated compounds in food. Handb Environ Chem. 17:127–153.
- Fujii Y, Sakurada T, Harada KH, Koizumi A, Kimura O, Endo T, Haraguchi K. 2015. Long-chain perfluoroalkyl carboxylic acids in Pacific cods from coastal areas in northern Japan: a major source of human dietary exposure. Environ Pollut. 199:35–41. doi:https://doi.org/10.1016/j.envpol.2015.01.007.
- Gellrich V, Knepper TP. 2012. Sorption and leaching behavior of perfluorinated compounds in soil. In: Knepper TP, Lange FT, editors. Polyfluorinated chemicals and transformation products. Berlin, Heidelberg: Springer-Verlag; p. 63–72.
- Genualdi S, deJager L. 2019. Determination of 16 Perfluoroalkyl and Polyfluoroalkyl Substances (PFAS) in food using Liquid Chromatography-Tandem Mass Spectrometry (LC-MS/MS). Single-laboratory validation per the Guidelines for the Validation of Chemical Methods for the FDA FVM Program 2nd Ed., , METHOD NUMBER: C-010.01, 1–18. [accessed 2021 Nov 24]. https://www.fda.gov/media/131510/download.
- Goosey E, Harrad S. 2012. Perfluoroalkyl substances in UK indoor and outdoor air: spatial and seasonal variation, and implications for human exposure. Environ Int. 45(1):86–90. doi:https://doi.org/10.1016/j.envint.2012.04.007.
- Government of Canada. n.d. Canadian Total Diet Study. https://www.canada.ca/en/health-canada/services/food-nutrition/food-nutrition-surveillance/canadian-total-diet-study.html .
- Guerranti C, Perra G, Corsolini S, Focardi SE. 2013. Pilot study on levels of perfluorooctane sulfonic acid (PFOS) and perfluorooctanoic acid (PFOA) in selected foodstuffs and human milk from Italy. Food Chem. 140(1):197–203. doi:https://doi.org/10.1016/j.foodchem.2012.12.066.
- Haug LS, Salihovic S, Jogsten IE, Thomsen C, van Bavel B, Lindström G, Becher G. 2010. Levels in food and beverages and daily intake of perfluorinated compounds in Norway. Chemosphere. 80(10):1137–1143. doi:https://doi.org/10.1016/j.chemosphere.2010.06.023.
- Herzke D, Huber S, Bervoets L, D’Hollander W, Hajslova J, Pulkrabova J, Brambilla G, Paola De Filippis S, Klenow S, Heinemeyer G, et al. 2013. Perfluorinated alkylated substances in vegetables collected in four European countries; occurrence and human exposure estimations. Environ Sci Pollut Res. 20(11):7930–7939. doi:https://doi.org/10.1007/s11356-013-1777-8
- Houde M, Bujas TAD, Small J, Wells RS, Fair PA, Bossart GD, Solomon KR, Muir DCG. 2006. Biomagnification of perfluoroalkyl compounds in the bottlenose dolphin (Tursiops truncatus) food web. Environ Sci Technol. 40(13):4138–4144. doi:https://doi.org/10.1021/es060233b.
- Jogsten IE, Perelló G, Llebaria X, Bigas E, Martí-Cid R, Kärrman A, Domingo JL. 2009. Exposure to perfluorinated compounds in Catalonia, Spain, through consumption of various raw and cooked foodstuffs, including packaged food. Food Chem Toxicol. 47(7):1577–1583. doi:https://doi.org/10.1016/j.fct.2009.04.004.
- Kuklenyik Z, Reich JA, Tully JS, Needham LL, Calafat AM. 2004. Automated solid-phase extraction and measurement of perfluorinated organic acids and amides in human serum and milk. Environ Sci Technol. 38(13):3698–3704. doi:https://doi.org/10.1021/es040332u.
- Liu X, Li L, Gu L, Hua Z, Zhang Y, Xue H. 2021. Distribution and release of perfluorinated compounds (PFCs) in water-sediment systems: the effect of confluence channels. Sci Total Environ. 775:145720. doi:https://doi.org/10.1016/j.scitotenv.2021.145720.
- Manzano-Salgado CB, Casas M, Lopez-Espinosa M, Ballester F, Basterrechea M, Grimalt JO, Jiménez A, Kraus T, Schettgen T, Sunyer J, et al. 2015. Transfer of perfluoroalkyl substances from mother to fetus in a Spanish birth cohort. Environ Res. 142:471–478. doi:https://doi.org/10.1016/j.envres.2015.07.020.
- Noorlander CW, Van Leeuwen SPJ, Biesebeek JD, Mengelers MJB, Zeilmaker MJ. 2011. Levels of perfluorinated compounds in food and dietary intake of PFOS and PFOA in the Netherlands. J Agric Food Chem. 59(13):7496–7505. doi:https://doi.org/10.1021/jf104943p.
- OECD. 2018. Toward a new comprehensive global database of per- and polyfluoroalkyl substances (PFASs): summary report on updating the OECD 2007 list of per- and polyfluoroalkyl substances (PFASs). Series on Risk Management No. 39. [accessed 2021 Nov 10. https://www.oecd.org/officialdocuments/publicdisplaydocumentpdf/?cote=ENV-JM-MONO(2018)7&doclanguage=en.
- Ou Y, Zeng X, Lin S, Bloom MS, Han F, Xiao X, Wang H, Matala R, Li X, Qu Y, et al. 2021. Gestational exposure to perfluoroalkyl substances and congenital heart defects: a nested case-control pilot study. Environ Int. 154:106567. doi:https://doi.org/10.1016/j.envint.2021.106567.
- Papadopoulou E, Haug LS, Sabaredzovic A, Eggesbø M, Longnecker MP. 2015. Reliability of perfluoroalkyl substances in plasma of 100 women in two consecutive pregnancies. Environ Res. 140:421–429. doi:https://doi.org/10.1016/j.envres.2015.04.022.
- Pereira MG, Lacorte S, Walker LA, Shore RF. 2021. Contrasting long term temporal trends in perfluoroalkyl substances (PFAS) in eggs of the northern gannet (Morus bassanus) from two UK colonies. Sci Total Environ. 754:141900. doi:https://doi.org/10.1016/j.scitotenv.2020.141900.
- Pérez F, Llorca M, Köck-Schulmeyer M, Škrbić B, Silva LFO, da Boit Martinello K, Al-Dhabi NA, Antić I, Farré M, Barceló D. 2014. Assessment of perfluoroalkyl substances in food items at global scale. Environ Res. 135:181–189. doi:https://doi.org/10.1016/j.envres.2014.08.004.
- Pierri A, Anumol T, Parry E. 2020. Analysis of Per/Polyfluoroalkyl Substances (PFAS) in drinking water by EPA 537.1 and EPA 533 using the Agilent Ultivo triple quadrupole LC/MS. [accessed 2021 Nov 24]. https://www.agilent.com/cs/library/applications/application-pfas-drinking-water-lcms-5994-1920en-agilent.pdf, Agilent Application Note, 8 pp.
- Rodríguez-Varela M, Durán-Álvarez JC, Jiménez-Cisneros B, Zamora O, Prado B. 2021. Occurrence of perfluorinated carboxylic acids in Mexico City’s wastewater: a monitoring study in the sewerage and a mega wastewater treatment plant. Sci Total Environ. 774:145060. doi:https://doi.org/10.1016/j.scitotenv.2021.145060.
- Shoemaker J, Tettenhorst D. 2020. Method 537.1 Determination of selected per- and polyflourinated alkyl substances in drinking water by solid phase extraction and Liquid Chromatography/Tandem Mass Spectrometry (LC/MS/MS). Washington (DC): U.S. Environmental Protection Agency. [accessed 2021 Nov 24]. https://cfpub.epa.gov/si/si_public_record_report.cfm?dirEntryId=348508&Lab=CESER&simpleSearch=0&showCriteria=2&searchAll=537.1&TIMSType=&dateBeginPublishedPresented=03%2F24%2F2018.
- Shrivastava A, Gupta VB. 2011. Methods for the determination of limit of detection and limit of quantitation of the analytical methods. Chron Young Sci. 2(1):21–25. doi:https://doi.org/10.4103/2229-5186.79345.
- Stahl LL, Snyder BD, Olsen AR, Kincaid TM, Wathen JB, McCarty HB. 2014. Perfluorinated compounds in fish from U.S. urban rivers and the Great Lakes. Sci Total Environ. 499:185–195. doi:https://doi.org/10.1016/j.scitotenv.2014.07.126.
- Stockholm Convention. 2019. The new POPs under the Stockholm Convention [Internet]. [accessed 2021 May 28]. http://chm.pops.int/TheConvention/ThePOPs/TheNewPOPs/tabid/2511/Default.aspx.
- Tang C, Tan J, Wang C, Peng X. 2014. Determination of perfluorooctanoic acid and perfluorooctane sulfonate in cooking oil and pig adipose tissue using reversed-phase liquid–liquid extraction followed by high performance liquid chromatography tandem mass spectrometry. J Chromatogr A. 1341:50–56. doi:https://doi.org/10.1016/j.chroma.2014.03.032.
- Taniyasu S, Kannan K, Man KS, Gulkowska A, Sinclair E, Okazawa T, Yamashita N. 2005. Analysis of fluorotelomer alcohols, fluorotelomer acids, and short- and long-chain perfluorinated acids in water and biota. J Chromatogr A. 1093(1–2):89–97. doi:https://doi.org/10.1016/j.chroma.2005.07.053.
- Tittlemier SA, Pepper K, Seymour C, Moisey J, Bronson R, Cao XL, Dabeka RW. 2007. Dietary exposure of Canadians to perfluorinated carboxylates and perfluorooctane sulfonate via consumption of meat, fish, fast foods, and food items prepared in their packaging. J Agric Food Chem. 55(8):3203–3210. doi:https://doi.org/10.1021/jf0634045.
- US EPA. 2021. PFAS master list of PFAS substances (version 2). [accessed 2021 Nov 8]. https://comptox.epa.gov/dashboard/chemical_lists/pfasmaster.
- Vélez MP, Arbuckle TE, Fraser WD. 2015. Maternal exposure to perfluorinated chemicals and reduced fecundity: the MIREC study. Hum Reprod. 30(3):701–709. doi:https://doi.org/10.1093/humrep/deu350.
- Vorkamp K, Falk K, Møller S, Bossi R, Rigét FF, Sørensen PB. 2019. Perfluoroalkyl substances (PFASs) and polychlorinated naphthalenes (PCNs) add to the chemical cocktail in peregrine falcon eggs. Sci Total Environ. 648:894–901. doi:https://doi.org/10.1016/j.scitotenv.2018.08.090.
- Wood C, Balazs GH, Rice M, Work TM, Jones TT, Sterling E, Summers TM, Brooker J, Kurpita L, King CS, et al. 2021. Sea turtles across the North Pacific are exposed to perfluoroalkyl substances. Environ Pollut. 279:116875. doi:https://doi.org/10.1016/j.envpol.2021.116875.