
 ?Mathematical formulae have been encoded as MathML and are displayed in this HTML version using MathJax in order to improve their display. Uncheck the box to turn MathJax off. This feature requires Javascript. Click on a formula to zoom.
Abstract
The determination of urea in pet feed at contaminant levels using the spectrophotometric method described in Commission Regulation (EC) No 152/2009 has been reported by several EU laboratories to lack the required selectivity. Whilst urea is not authorised as an additive in pet feed, the control of urea in pet feed is of economic importance, because the addition of urea may unlawfully increase the apparent protein content. To investigate the capabilities of different analytical techniques, a proficiency test was organised where the participants (EU official control laboratories, laboratories from the academia and private laboratories) were free to use their method of choice for analysing three dog feed test materials, two samples of which were spiked with urea. Twenty-one laboratories submitted results using the following techniques: spectrophotometry (Implementing Regulation (EC) No 152/2009), LC-MS/MS, HPLC-UV, enzymatic-colorimetry, gravimetry and an ‘in-house photometric’ method. Only two laboratories that used LC-MS/MS were able to quantify urea accurately in the test material containing a mass fraction of 18.9 mg kg−1 whereas satisfactory results at the level of 258.9 mg kg−1 were obtained by one participant that used an ‘in-house photometric method’ and one that used the enzymatic method, in addition to the five participants using LC-MS/MS. The technique that provided the highest success rate across the three test materials was LC-MS/MS, whereas spectrophotometry, the enzymatic-based and HPLC-UV methods led to overestimated results in addition to a dispersion of results not suitable for compliance analysis. To address the determination of urea in pet feed at low levels, a better performing method than the one described in the legislation is required.
Introduction
Urea is a nutritional feed additive authorised in the EU in ruminant feed by Commission Implementing Regulation (EU) No 839/2012 (EC Citation2012). Urea supplementation provides a non-protein nitrogen source for microbial protein synthesis in ruminants with a functional rumen (EFSA Citation2012). In pet feed, urea is considered an undesirable substance since it has no nutritional value and increases the apparent protein content when using classical food protein analysis, e.g. by Kjeldahl-based methods (MacMahon et al. Citation2012; Finete et al. Citation2013). Since urea is cheaper than raw protein, urea might be supplemented to pet feed to gain an economical advantage, thus representing a fraud (Krämer et al. Citation2021). Food can also be adulterated with urea to increase the apparent protein content, extend its life time and as whitening and thickening agent (Kumar and Dash Citation2021). A number of feed adulteration incidents have been reported in the recent years, e.g. fortification of yeast intended to be used in the preparation of poultry meal and animal feed up to a mass fraction of 12% in 2016, 2017 (17 cases), 2020 and 2023 (Krämer et al. Citation2021; EC Citation2023).
Several approaches can be used to determine urea although only a few have been used for feed analysis. This subject has evolved mostly in the analysis of wines and spirits and in the clinical area (Zhang et al. Citation2014). Urea may be determined directly, using a colorimetric method with UV-VIS spectrophotometry (a1); by liquid chromatography with pre-column or post-column derivatization and UV-VIS or fluorescence detection (FLD) (a2) and by liquid chromatography coupled to mass spectrometry (a3); and indirectly, where urea is converted to ammonia, which is then determined colorimetrically (b) (Francis Citation2006; Labanca and Glória Citation2008).
The method described in Commission Regulation (EC) No 152/2009 (EC Citation2009) consists on the spectrophotometric determination of urea by measuring the optical density of the derivative formed after the reaction with 4-dimethylaminobenzaldehyde (4-DMAB) at 420 nm. This method does not afford the utmost selectivity, in particular in the presence of simple nitrogenous compounds (e.g. amino acids), where the optical density shall be measured at 435 nm (Flannelly et al. Citation2019). In the absence of a dedicated method prescribed for the determination of urea in pet feed, many official feed control laboratories rely on this method. Other spectrophotometric methods involve the derivatization of urea with 1-phenyl-1,2-propanedione-2-oxime or diacetyl monoxime to form coloured products.
HPLC procedures have been proposed where urea is derivatized with 9-xanthydrol, o-phthaldehyde, or 9-fluoreylmethyl chloroformate followed by FLD (Labanca and Glória Citation2008). In contrast to the classical precipitation method with 9-xanthydrol, in the HPLC method urea is left to react for 5 min. in a mixed solvent to form a soluble derivative for direct injection into the chromatographic system (Veiga et al. Citation2005; Francis Citation2006; MacMahon et al. Citation2012). Clark et al. (Citation2007) found this procedure simple, sensitive and a low-cost alternative for the determination of urea in complex sample matrices.
The direct mass spectrometric determination of underivatized urea has been only recently applied with the advent of hydrophilic interaction liquid-chromatography (HILIC). The low molecular weight of urea enables the fragmentation into only one relevant ion at m/z 44 (BIOR Citation2017).
The enzymatic method is based on the hydrolysis of urea using urease to form ammonia and carbon dioxide. 2-Oxoglutarate reacts with the generated ammonia and reduced nicotinamide–adenine dinucleotide (NADH) in the presence of glutamate dehydrogenase to form glutamic acid and NAD+. The consumption of NADH is calculated measuring the absorbance of the solution at 340 nm before and after the addition of glutamate dehydrogenase. The amount of NADH oxidized is stoichiometric to the amount of ammonia or to half the amount of urea, respectively (Boehringer_Mannheim/R-Biopharm). The presence of urease inhibitors, occurrence of conditions that reduce the activity of enzymes, and low analyte concentrations have been reported to negatively affect the reliability of the method (Labanca and Glória Citation2008). An enzyme kit for the determination of urea/ammonia in foodstuffs and other materials is commercialized by Boehringer Mannheim/R-Biopharm (Darmstadt, Germany) and the similar in principle K-URAMRtest kit is sold by Megazyme (Bray, Ireland) (Labanca and Glória Citation2008; MacMahon et al. Citation2012).
The phenol – hypochlorite clinical chemistry kit was successfully applied by O'Keeffe and Sherington (Citation1983) to analyse urea in water extracts of compound feed (0.2–27 g kg−1) and of chopped, fresh silage (up to 54 g kg−1). The authors classified it as a simple, rapid and inexpensive method which might be automated and has comparable trueness and precision to the official DMAB method (EC Citation2009).
It is obvious from the information above that a wide variety of methods exists for urea determination, but their applicability to pet feed is questionable. Several EU official control laboratories and other researchers reported discrepancies in the values obtained and assigned these results to a lack of selectivity (Krämer et al. Citation2021). Whereas Pibarot and Pilard (Citation2012) found overestimated results of urea in pet feed determined by the official spectrophotometric method with respect to those generated by the LC-MS/MS and AOAC enzymatic methods, Flannelly et al. (Citation2019) obtained overestimated results of urea in yeast-based food and feed ingredients using the enzymatic method in comparison with the two other methods. An interlaboratory comparison was carried-out by the European Union Reference Laboratory for Feed Additives (EURL-FA) hosted by the Joint Research Centre of the European Commission in 2019 aimed at assessing the proficiency of EU laboratories for the determination of urea in pet feed at contaminant level and the evaluation of the merits of the applied analytical techniques. The accuracy of the results generated by these techniques will be discussed here and validation data of an in-house developed method will be provided. The objective of the study was to guide regulatory amendments leading to more fit-for-purpose official methods for the determination of urea in pet and in ruminants feeds.
Materials and methods
Chemicals and instruments
Acetonitrile hypergrade for LC-MS LiChrosolv grade was purchased from Merck (Darmstadt, Germany). Deionised water and LC-MS grade ultrapure water were produced by a Milli Q® HX7040 and a Milli Q® Advantage A10 apparatus, respectively (Millipore/Merck, Darmstadt, Germany). Formic acid analytical reagent grade (Fluka) for the preparation of the extraction solution and formic acid LC-MS grade (Supelco) used as mobile phase additive were both purchased from VWR.
A urea Standard Reference Material 912b with a certified mass fraction of 99.95% ± 0.01% (k = 2) was obtained from NIST (Gaithersburg, Maryland, USA). The isotopically-labelled internal standards 13C urea and 13C15N2 urea were purchased from Sigma Aldrich (Merck-Sigma group, Schnelldorf, Germany). The later was preferably used.
Samples were extracted in a wrist shaker CAT S50 (Ingenieurbüro CAT, M. Zipperer GmbH, Ballrechten-Dottingen, Germany) and centrifuged in an Eppendorf 5810 R centrifuge (Hamburg, Germany). Folded paper filters Whatman 113 V (Maidstone, UK) were used for the filtration of the extracts. Before injection the extracts were filtered through PTFE® syringe filters (13 mm, 0.22 μm pore size) using 1 mL syringes with needle (Terumo/Shibuya, Tokyo, Japan) both obtained from VWR.
The LC-MS/MS equipment was composed of a Nexera X2 chromatographic system from Shimadzu Corporation (Kyoto, Japan) coupled to a hybrid quadrupole linear ion trap mass spectrometer QTrap 6500 from ABSciex (Framingham, MA, USA) mounted with a Turbo Ionspray interface. The chromatographic system included two LC-30AD pumps, a DGU-20A5R degasser, a SIL-30AC autosampler, a CTO-20AC column oven and a CBM-20A controller. The data acquisition and evaluation were performed using the Analyst software 1.6.3 installed with the MultiQuant 3.0.2 and PeakView 2.1 packages.
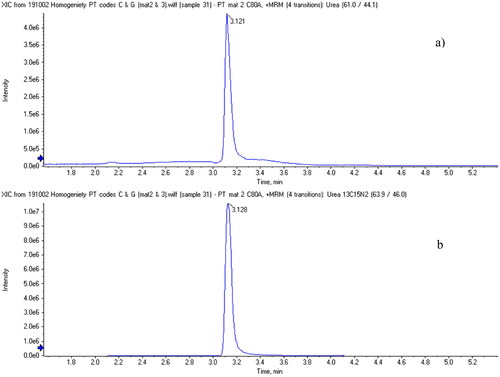
Urea was determined using an HILIC column (Kinetex HILIC 100 × 2.1 mm and 2.6 µm particle size) from Phenomenex (Utrecht, The Netherlands), and a gradient of water and acetonitrile, both containing 0.1% (v/v) formic acid. The retention time of urea was 3.121 min.
Method description
An LC-MS/MS-based method adapted from BIOR (Citation2017) and including isotope-dilution quantification was in-house validated and used in the characterisation of the interlaboratory comparison test materials (homogeneity, stability and confirmation of the target value).
Briefly, 2 g-sample aliquots are weighed in 50 mL falcon tubes and extracted with 20 mL of an aqueous solution containing 1% formic acid (v/v) (extraction solution) in a wrist action shaker at the maximum speed for 20 min. The samples are then centrifuged for 10 min at 3200 × g at room temperature and the supernatant is decanted and filtered through paper filter. An aliquot of the filtrate (950 µL) is transferred into an HPLC vial and the isotopically-labelled internal standard solution (50 µL of 13C15N2 urea at 1 μg μL−1) is added. The vial is capped and homogenised in a vortex mixer. Subsequently, an aliquot of this solution (20 µL) is diluted with acetonitrile (980 µL) in another HPLC vial and homogenised well. The solution is then analysed by LC-MS/MS using an HILIC column.
Solvent blanks are prepared by mixing 20 µL of extraction solution with 980 µL of acetonitrile. The following standard solutions are required for instrument calibration and sample analysis:
Stock standard solution: urea 10 µg µL−1 in water. This solution is stable at + 4 °C for 3 months.
Working standard solution: urea 0.5 µg µL−1 in water. Obtained by dilution of the Stock standard solution of urea. This solution is stable at + 4 °C for 1 month.
Internal standard solution: 13C urea or 13C15N2 urea 1 µg µL−1 in water. This solution is stable at + 4 °C for 3 months.
Calibration solutions: Standard solutions of urea at six concentration levels (0.005, 0.025, 0.05, 0.1, 0.15 and 0.22 µg µL−1), including the internal standard at 0.05 µg µL−1, were prepared by adding suitable volumes of urea working standard solution (b), the internal standard solution (c) and diluting them with the extraction solution. All calibration solutions were well homogenised. Twenty µL of each of the obtained calibration solutions were mixed with 980 µL of acetonitrile in individual vials for analysis.
The analysis was done using an LC-MS/MS system using gradient elution in HILIC mode and detection by positive electrospray ionisation (ESI+) and acquisition of specific multiple reaction monitoring (MRM) transitions. The HPLC elution program can be found in whereas the mass spectrometry acquisition conditions are indicated in . The autosampler compartment was kept at 10 °C. A 5 uL-aliquot of the calibration and test solutions was injected. The separation took place using the above-mentioned column kept in an oven at 30 °C and the mobile phases flow rate was 0.2 mL/min.
Table 1. HPLC gradient elution program.
Table 2. Mass spectrometry acquisition settings.
Additionally, the following optimized ion source settings were used on the ABSciex QTrap 6500 system: curtain gas: 20 psi, collision gas: high, Ion spray voltage: 4.6 kV, temperature: 600 °C, Ion spray gas 1: 40 psi, Ion spray gas 2: 30 psi, target scan time: 0.5 s. Due to the low molecular weight of urea just one product ion was produced. The parent ion signal (applying a very low collision energy) was also recorded to enable the calculation of ion ratios. The total run time was 10 min and urea eluted at around 3.12 min. An example chromatogram of a contaminated sample can be seen in .
Figure 1. Extracted ion chromatograms of (a) urea (m/z 61 > 44) in test material C containing 258.9 mg kg−1 of urea and (b) internal standard 13C15N2 urea (m/z 64 > 46) at a mass fraction of 526 mg kg−1.
The mass fraction of urea (mg kg−1) in the pet feed samples was derived applying the formula below, where:
c – concentration of urea in the extract (in µg µL−1) estimated from the calibration curve
Vsolv – volume of extraction solvent (normally, 20 mL)
msmp – the mass of sample (normally, 2.00 g)
0.950 – volume of extract used for analysis (mL)
Preparation of the interlaboratory test materials
Three test materials were prepared containing mass fractions of urea covering a range from 19 to 977 mg kg−1 deemed to be: (J) challenging – near blank, (C) regular – medium mass fraction and (G) detectable by most analytical methods – high mass fraction. For this purpose, a commercial complete dog feed (Pedigree® Senior) was purchased at the local retail market in Geel (Belgium). According to the label, this product was composed of chicken meat, rice, and vegetables. The complete composition of the dog feed can be found as Supplementary Material.
The commercial dog feed as such constituted one test material (J) whereas two portions were spiked with urea at the desired levels and consisted two additional test materials (C and G). Briefly, the dog feed chunks were initially crunched into smaller pieces. Then, the required amount of urea from Standard Reference Material NIST 912b was dissolved in a volume of methanol sufficient to wet barely the material (10% v/m). This solution was poured homogenously and quantitatively over the material, which was then allowed to dry in a fume hood until constant weight (5 days). All materials were then cryogenically milled (Palla VM-KT, Humboldt-Wedag, Cologne, DE) and sieved through a 500-µm stainless steel mesh (Russel Finex, London, UK). Then, about 3 kg of each powder was homogenised using a Dynamix-CM200 mixer from WAB (Muttenz, CH) for 1 h. About 12 g portions of each material were then filled into 80 units of 50-mL amber glass bottles and hermetically closed. The bottles were labelled with the proficiency test code and sample code.
The homogeneity of the test materials regarding their urea content was evaluated at a sample intake of 2 g and they proved to fulfil the provisions of ISO 13528:2015 (sufficient homogeneity). Similarly, the stability of urea in the test materials was studied at ambient temperature (about 23 °C) for the whole duration of the proficiency test (9 weeks, long-term stability, storage) and at 40 °C (1 week, short-term stability, covering extreme conditions during the transport of the items). The stability parameters fulfilled the criteria set in ISO 13528:2015 (ISO Citation2015) and ISO Guide 35 (ISO Citation2006). The LC-MS/MS method described in Section 2.2 was used in all the analytical tasks required for the proper characterisation of the test materials. More information is available in the respective proficiency test report (Gonçalves et al. Citation2020).
Interlaboratory test scheme
This interlaboratory test on the determination of urea in pet feed at contaminant levels was announced to the National Reference Laboratories, Official Control Laboratories and Expert Laboratories in the feed sector in July 2019. The samples were dispatched in October 2019 and the deadline for submission of results was the 16 December 2019. Each participant received 2 bottles of each of the test items (codes J, C and G). The participants were asked to analyse these samples using their method of choice and to submit the following data:
mass fraction of urea in mg/kg (sample ‘as is’)
mass fraction of urea in mg/kg (converted to a feed with 12% moisture)
moisture content in % (m/m)
expanded uncertainty (in the same units)
the coverage factor (k), and
the analytical technique used
The results from the participants were collected through the proprietary MILC platform (JRC Citation2018), which ensured the confidentiality and security of the submitted data.
This interlaboratory test aimed at three objectives:
assess the ability of laboratories to accurately determine urea in pet feed,
assess the performance of the analytical techniques employed for urea determination, and
assess the accuracy of the urea content conversion to a feed containing 12% moisture.
For objective (i) the mass fractions of urea converted to a feed containing 12% moisture were compared with the assigned values determined by the JRC under the same conditions. For objective (ii), the mass fractions of urea in the sample ‘as is’ submitted by the participants were compared with the reference values established by the JRC. For objective (iii), the declared moisture content and underlying mathematical calculations were checked. (i and iii) are described in the respective proficiency test report (Gonçalves et al. Citation2020). This paper is devoted to the discussion of the relative performance of the analytical techniques employed for urea determination (ii)
The reference mass fraction of urea (mg/kg) in the test materials ‘as is’ and the respective uncertainties can be found in . The trace amount of urea present in material J was determined by LC-MS/MS using standard addition calibration. The reference values of urea in materials C and G were determined based on the formulation approach where a urea Standard Reference Material (NIST SRM 912b) was used to spike test material J at two levels originating materials C and G. The mass fractions of urea in these materials were then analytically confirmed, by LC-MS/MS. The uncertainties include the component uChar (characterization) and uHomo (homogeneity).
Table 3. Reference values of urea and moisture contents of the test materials accompanied by the respective uncertainty values (k = 2).
Results and discussion
Outcome of the interlaboratory study
Fourteen National Reference Laboratories for Feed Additives from thirteen EU Member States, two German Official Control Laboratories and five laboratories from academia and private companies submitted their results. Given the interest in the subject, six laboratories volunteered to provide two datasets and two other laboratories provided three datasets each, independently obtained applying different methods. These laboratories, except one, used spectrophotometry along with alternative methods such as LC-MS/MS, enzymatic determination, HPLC-UV and in-house developed methods.
In total, we gathered a pool of 31 sets of results. Since some results were reported as < LOQ, the quantitative results available for deriving overall statistics were: 21 for test material J, 26 for test material C and 28 for test material G. In particular, the gravimetric determination of urea after precipitation with xanthydrol performed by one laboratory did not allow quantification of the analyte in any of the samples. The full data set can be consulted in .
Table 4. Results (mg kg−1) of urea in the test materials J, C and G, as submitted by the interlaboratory study participants.
Fourteen participants (45%) employed a spectrophotometric method for analyzing urea in the test samples as described in Commission Regulation (EC) No. 152/2009, Annex III, D. Seven laboratories (23%) used LC-MS/MS methods either similar to the one proposed by BIOR (Citation2017) or taken from the scientific literature. Six laboratories (19%) employed an enzymatic method using the test kit supplied by Boehringer Mannheim/R-Biopharm followed by colorimetric determination. Two laboratories (6.5%) used HPLC-UV, one (3.2%) employed a gravimetric method and one (3.2%) used a so-called ‘in-house photometric method’, not yet published. More details of these methods can be found in the urea proficiency test report (Gonçalves et al. Citation2020).
The results of interest for evaluating the closeness of agreement of the values provided by each analytical technique with the reference value are those reported as obtained (urea ‘as is’), without any further transformation. These are not affected by analytical errors associated with the determination of the materials’ moisture and any additional mistakes that were indeed observed in the mathematical calculation to derive the corrected value of the urea content for a feed containing 12% moisture. The used set of results provides, therefore, a more trustworthy representation of the capabilities and behaviour of the analytical techniques employed for urea determination, which is the purpose of this study.
The robust mean and standard deviation of the datasets sorted by analytical technique and test material were calculated according to the algorithm A + S described in ISO 5725-5 (1998) using the ProLab software (QuoData GmbH, Dresden, Germany). The robust statistics () were derived only for the datasets composed of seven or more results, to ensure statistical significance. depicts the raw data submitted by the participants for each test material arranged by analytical technique, to better visualize the distribution of the results.
Figure 2. Distribution of the results submitted by the PT participants for the test materials J, C and G organized by analytical technique. Note: The horizontal line represents the reference mass fraction of urea in each test material. The uncertainties of the reference values are indicated in .
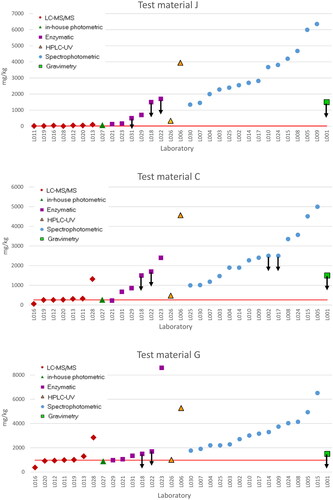
Table 5. Statistical parameters of the interlaboratory test: robust mean (ISO 5725-5) and reproducibility (RSDR).
The robust mean values (consensus) of urea in the test materials obtained by LC-MS/MS are in good agreement with the respective reference values, given their associated uncertainties, confirming the accuracy of this technique.
Only laboratories that used LC-MS/MS were able to quantify urea accurately in the test material J (lowest urea level). The spectrophotometric, HPLC-UV and enzymatic techniques produced significantly overestimated results, in addition to a dispersion that is not acceptable in compliance analysis. Material C contained an amount of urea (259 mg kg−1) in the range where analytical methods deemed fit-for purpose should provide reliable results. Satisfactory results at this level were obtained only by five participants that used LC-MS/MS, one participant that used an ‘in-house photometric method’ and another one that used an enzymatic method. For the material with the highest urea level (material G), in addition to the LC-MS/MS methods, the enzymatic, ‘in-house photometric’ and HPLC-UV methods provided also some satisfactory results. The gravimetric method is not fit for the purpose of determining urea as contaminant in pet feed since a LOQ of 1500 mg/kg is too high for this assay.
It has been observed, however, that despite the overestimated results generated by the colorimetric methods (spectrophotometry, HPLC-UV and enzymatic-based), they were affected by an approximately constant bias (characteristic for this specific matrix) responding proportionally to the increment of urea in the test materials C and G. The cause of the unsatisfactory results might, therefore, be attributed to background matrix interferences (like simple nitrogenous compounds, identified in Commission Regulation 152/2009), confirming the poor selectivity of these methods. On the contrary, when the amount of urea in the samples largely exceeds the interferences (e.g. >3000 mg kg−1, in ruminant feed), which is not the case in pet feed, such methods have shown to provide acceptable results (Gonçalves et al. Citation2022).
The limits of quantification and working range of these techniques are also, in general, not appropriate for the determination of urea in pet feed (). Whereas all the employed LC-MS/MS methods could measure urea mass fractions above 50 mg kg−1 (allowing to quantify materials C and G accurately), the enzymatic-based methods had LOQs 10-fold higher (material G could be accurately measured) and the spectrophotometric method had LOQs roughly 50-fold higher. The ‘in-house photometric’ method had a performance close to the LC-MS/MS methods. The publication of this method by Coelhan (TU München) and co-workers is expected in the near future.
Table 6. Performance parameters of the methods used by the participants.
The interlaboratory precision (reproducibility) of the LC-MS/MS technique (45–48%, ) can certainly be improved as the laboratories acquire experience on the use of the protocol and by participating in proficiency tests. When interpreting this reproducibility, it has to be considered that this interlaboratory comparison had the set-up of a proficiency test and not of a collaborative trial. Therefore, this reproducibility has to be considered as a first indication of the reproducibility that the technique can provide. A similar approach has been applied by Thompson et al. (Citation2020). In our study, the calculated values for the reproducibility reflect the precision of a type of analytical technique (e.g. LC-MS/MS) rather than a specific method. Further improvement of the achievable precision can therefore be expected, when validating an optimised method with a detailed description. It must be emphasized that some laboratories implemented the method just before participating in this interlaboratory exercise. The dispersion of the results of the enzymatic method is quite high even at high urea contents (mg kg−1 level), a well-known drawback of these biochemical tests. Krämer et al. (Citation2021) found coefficients of variation for the enzymatic test similar to LC-MS/MS and HPLC-FLD but they were obtained under repeatability conditions.
Both, the evaluation of the z-scores of the proficiency test with σpt = 20% (Gonçalves et al. Citation2020) and the statistics produced on each analytical technique, as discussed above, indicate that LC-MS/MS is currently the only widely employed analytical technique capable of generating accurate results for urea in pet feed at relevant levels, ranking best in the whole range of mass fractions tested (18.9–977 mg kg−1) ().
In-house validation
The LC-MS/MS method described above, which is similar in concept to the methods used by three participants, was in-house validated at the JRC. The limits of detection and quantification for urea in dog feed were 13 and 43 mg/kg, calculated as 3- and 10-times the residual standard deviation of the calibration regression, respectively. The precision expressed as repeatability and intermediate precision relative standard deviation at a concentration of 1000 mg kg−1 were 1.5 and 2.6%, respectively. The recoveries calculated at mass fractions from 100 to 2000 mg/kg varied from 89 to 94%. No significant matrix effect was observed due to the 50-fold dilution of the raw extract with acetonitrile before LC-MS/MS. The method gives a linear response at least in the range from 53 to 2316 mg kg−1 (working range). These figures of merit are equivalent to those reported by the interlaboratory comparison participants that used LC-MS/MS ().
Triggered by the results of this interlaboratory comparison, Krämer et al. (Citation2021) established recently an alternative HPLC-FLD method for urea determination in pet feed based on the reaction with xanthydrol formerly proposed by Clark et al. (Citation2007). The authors claim that it provided reliable results in a wide concentration range (7–50,000 mg kg−1) hence proving suitable for assessing the background presence of urea as well as monitoring its application as a feed additive. Both the quantification thresholds (8 and 7 mg kg−1) as well as the precision (<7.2% and <4.7% RSD) were comparable between LC-MS/MS and HPLC-FLD, respectively. The HPLC-FLD method includes, however, a derivatization reaction that lasts 1 hr and the trueness is marginally worse than that of LC-MS/MS. Although the HPLC-FLD method offered promising results using affordable analytical instrumentation, it is not yet as widely tested as the LC-MS/MS counterpart, in particular under interlaboratory conditions.
Conclusions
A clarification of the scope of applicability of the official spectrophotometric method described in Commission Regulation (EC) No 152/2009 was very much needed given the frequently overestimated results obtained in the analysis of urea in pet feed. None of the laboratories that used this method were able to quantify urea reliably in any of the three distributed test materials. LC-MS/MS produced significantly better results compared to spectrophotometry, the enzymatic method and HPLC-UV in the whole range of mass fractions tested (18.9–977 mg kg−1). Recently, some authors are proposing more economic methods based on HPLC-FLD with similar sensitivity and accuracy. Although their performance looks promising, their reproducibility is yet to be demonstrated in an interlaboratory exercise. In combination with a parallel interlaboratory comparison on urea in ruminant feed, also conducted by the JRC, this interlaboratory comparison supported restricting the scope of the spectrophotometric method to the analysis of urea in ruminant feed alone and to propose the use of LC-MS/MS as the method of choice for the analysis of pet feed.
Supplemental Material
Download MS Word (43 KB)Acknowledgements
We gratefully acknowledge the laboratories that participated in this interlaboratory study for their invaluable contribution. All JRC’s staff involved in the processing and packing of the test materials are very much thanked. Aneta Cizek-Stroh is thanked for the logistics support. Piotr Robouch’s contribution in the organization of the PT and the data treatment is immensely acknowledged. The authors are also very much thankful to the anonymous reviewers for their input to improve the content of the paper.
Disclosure statement
No potential conflict of interest was reported by the author(s).
References
- BIOR. 2017. Determination of carbamide in pet food using liquid chromatography with tandem mass spectrometry, validation report – method code: BIOR-T-012-189-2017, Riga. https://bior.lv/en/product/1036.
- Boehringer_Mannheim/R-Biopharm. Enzymatic bioanalysis/food analysis – urea/ammonia UV-method for the determination of urea and ammonia in foodstuffs and other materials and for the determination of nitrogen after Kjeldahl-digestion, Cat. No. 10 542 946 035 [accessed 2024 Jan 27]. https://food.r-biopharm.com/wp-content/uploads/2012/06/roche_ifu_urea-ammonia_10542946035_en-v5_2019-11.pdf.
- Clark S, Francis PS, Conlan XA, Barnett NW. 2007. Determination of urea using high-performance liquid chromatography with fluorescence detection after automated derivatisation with xanthydrol. J Chromatogr A. 1161(1–2):207–213. doi:10.1016/j.chroma.2007.05.085.
- EC. 2009. Commission regulation (EC) No 152/2009 of 27 January 2009 laying down the methods of sampling and analysis for the official control of feed. Brussels: Official Journal of the European Union L 54/1.
- EC. 2012. Commission implementing regulation (EU) No 839/2012 of 18 September 2012 concerning the authorisation of urea as a feed additive for ruminants. Brussels: Official Journal of the European Union L 252/11.
- EC. 2023. RASFF window – European Commission rapid alert system for food and feed [accessed 2023 Mar 28]. https://webgate.ec.europa.eu/rasff-window/screen/search.
- EFSA. 2012. EFSA panel on additives and products or substances used in animal feed (FEEDAP). Scientific opinion on the safety and efficacy of urea for ruminants. EFSA J. 10(3):2624. doi:10.2903/j.efsa.2012.2624.
- Finete VLM, Gouvêa MM, Marques FFdC, Netto ADP. 2013. Is it possible to screen for milk or whey protein adulteration with melamine, urea and ammonium sulphate, combining Kjeldahl and classical spectrophotometric methods? Food Chem. 141(4):3649–3655. doi:10.1016/j.foodchem.2013.06.046.
- Flannelly L, Dillon GP, Moran CA. 2019. A comparison of analytical methods for the determination of urea in yeast-based food and feed ingredients. Food Additiv Contam A. 36 (10):1467–1474. doi:10.1080/19440049.2019.1644457.
- Francis PS. 2006. The determination of urea in wine – a review. Aust J Grape Wine Res. 12(2):97–106. doi:10.1111/j.1755-0238.2006.tb00048.x.
- Gonçalves C, Bouten K, Dehouck P, Robouch P, Stroka J, Cizek-Stroh A, Emteborg H, Vincent U, von Holst C. 2020. EURL-FA control proficiency test report: determination of the mass fraction of urea in pet feed. JRC Technical Reports, June 2020, JRC121113. Geel (Belgium): JRC Geel.
- Gonçalves C, Bouten K, Emteborg H, Stroka J, von Holst C, Vincent U. 2022. Determination of urea in compound feed for ruminants: interlaboratory comparison for the validation of the spectrophotometric method in commission regulation (EC) No 152/2009. Biotechnol Agron Soc Environ. 26(S):295–302. doi:10.25518/1780-4507.20069.
- ISO. 2006. ISO guide 35, reference materials—general and statistical principles for certification. Geneva, Switzerland: International Organisation for Standardization
- ISO. 2015. ISO 13528 statistical methods for use in proficiency testing by interlaboratory comparisons. Geneva, Switzerland: International Organisation for Standardization.
- ISO_5725-5. 1998. Accuracy (trueness and precision) of measurement methods and results – part 5: alternative methods for the determination of the precision of a standard measurement method. Geneve, Switzerland: International Organisation for Standardization.
- JRC. 2018. Joint Research Centre’s Metrological InterLaboratory Comparison (MILC) platform for registration, result’s submission and evaluaton of ILC's data, ver. 8. Geel (Belgium).
- Krämer M, Fry H, Kappenstein O. 2021. Development and validation of two analytical methods for urea determination in compound feed, including pet food, and yeast using high-performance liquid chromatography coupled with fluorescence detection and tandem mass spectrometry. Food Addit Contam Part A. 38(6):931–942. doi:10.1080/19440049.2021.1901999.
- Kumar V, Dash S. 2021. Evaporation-based low-cost method for the detection of adulterant in milk. ACS Omega. 6(41):27200–27207. doi:10.1021/acsomega.1c03887.
- Labanca RA, Glória MBA. 2008. Spectrophotometric determination of urea in sugar cane distilled spirits. J Agric Food Chem. 56(13):5211–5215. doi:10.1021/jf800520e.
- MacMahon S, Begley TH, Diachenko GW, Stromgren SA. 2012. A liquid chromatography–tandem mass spectrometry method for the detection of economically motivated adulteration in protein-containing foods. J Chromatogr A. 1220:101–107. doi:10.1016/j.chroma.2011.11.066.
- O'Keeffe M, Sherington J. 1983. Comparison of three methods for the determination of urea in compound feed and silage. Analyst. 108(1292):1374–1379. doi:10.1039/an9830801374.
- Pibarot P, Pilard S. 2012. Analysis of urea in petfood matrices: comparison of spectro-colorimetric, enzymatic and liquid chromatography electrospray ionization high resolution mass spectrometry methods. AJAC. 03(09):613–621. doi:10.4236/ajac.2012.39080.
- Thompson M, Sykes M, Wood R. 2020. Comparisons between reproducibility standard deviations (SDR) derived from proficiency tests and from collaborative trials: mycotoxins in food. Accred Qual Assur. 25(1):61–68. doi:10.1007/s00769-019-01413-8.
- Veiga MJ, Herbert P, Simões T, Oliveira A, Alves A. 2005. Poster P-III-16: determination of urea in port wine by HPLC with fluorescence detection after derivatization with 9-xanthydrol. Presented at the 4th International Conference on Instrumental Methods of Analysis: modern trends and applications; October 2 − 6; Crete, Greece: Iraklion.
- Zhang J, Liu G, Zhang Y, Gao Q, Wang D, Liu H. 2014. Simultaneous determination of ethyl carbamate and urea in alcoholic beverages by high-performance liquid chromatography coupled with fluorescence detection. J Agric Food Chem. 62(13):2797–2802. doi:10.1021/jf405400y.