
 ?Mathematical formulae have been encoded as MathML and are displayed in this HTML version using MathJax in order to improve their display. Uncheck the box to turn MathJax off. This feature requires Javascript. Click on a formula to zoom.
Abstract
Evaluation indices were proposed and rated based on statistical analysis of collapse by an improved backward cloud algorithm considering internal and trigger factors. The evaluation index weight was calculated by a G1 method. A hazard evaluation of a highway collapse in China was established on the basis of a spatial analysis function of ArcGIS 10.2 and a factor superposition method. A hazard zoning of highway collapse in China was also performed based on the hazard degree. Results show that a comprehensive hazard index of highway collapse hazard in China based on the evaluation index above ranges from 1.0 to 9.0; and the distribution law of the collapse along a highway coincides with the actual distribution of highway collapse hazard. The most dangerous zones are the mountainous area of Southeast Taiwan, the mountainous area of Southeast Fujian–Zhejiang, south of Hainan, Sichuan–Yunnan mountainous area, Tianshan Mountains and Kunlun Mountains. The results can provide a reference for highway collapse prevention and mitigation work.
Abbreviations: AHP: Analytic Hierarchy Process; GIS: Geographic Information System
1. Introduction
A collapse is an external force to destroy the roadbed or road pavement structure. It often causes road disruption or even casualties in mountainous areas. For example, 2375 geological disasters after a persistent 10-day rainfall on September 2014 in Shaanxi occurred in the trunk highway in Shaanxi Province, of which collapse comprised 52.97% (Qi et al. Citation2016). In addition, 1253 natural hazards were found along the general trunk roads in the Geological Survey of Shaanxi province on January 2018, of which collapse hazards comprised 937, that is 74.78%. Statistics indicated that collapse has a significant impact on the highway. Moreover, collapse not only occurs frequently but also is difficult to predict accurately. Meanwhile, the characteristics of highway collapse in different areas in China show diversity given the differences in climate, rainfall, topography and geological conditions. Thus, highway collapse should be evaluated based on spatial analysis to facilitate the preparation of a highway collapse plan and provide a reference for the macro-control fund allocation and material preparation.
Numerous studies on collapse have been conducted. Several researchers have conducted studies on geologic disaster hazard evaluation. Guzzetti et al. (Citation2005) conducted a hazard analysis and an evaluation based on the Poisson probability model of landslides along the river in Northern Italy. Kawagoe et al. (Citation2009) evaluated the danger and hazard of landslides caused by snowmelt in Japan by using a logistic regression model to determine the weights of factors in geology, geomorphology and hydrological conditions. Gentile et al. (Citation2008) conducted a hazard assessment using empirical models of disaster maps and survey data on mountainous areas in Southern Italy. On the basis of remote sensing satellite images, Westen et al. (Citation2008) considered the coupling between rainfall and earthquake to evaluate the temporal probability of landslide occurrence. Qi (Citation2015) completed a regional hazard evaluation of trunk-highway flood disasters based on superposition theory of regional influencing factors (on the basis of the formation mechanism and influencing factors of highway flood disasters). Wang (Citation2011) established a forecasting model and an evaluation model for an area highway slope disaster based on natural environment and disaster characteristics in Shaanxi Province. Li (Citation2015) studied establishing a natural disaster vulnerability hierarchy system with Geographic Information System (GIS). In addition, Yin et al. (Citation2016) studied the hazard regionalization of debris flow disasters along highways in China based on the genetic algorithm and a cloud model.
The analysis of the existing literature reveals that logistic regression model (Tian et al. Citation2016; Liu et al. Citation2016, et al. Citation2017), factor superposition model (MA Citation2010; Wang Citation2011; Qi et al. Citation2015; Yin et al. Citation2016 Qi et al. Citation2011) and other evaluation models have been used with new observation technologies and data processing methods in the process of human disaster resistance, whereas the Certainty Factor (CF) method (Liu et al. Citation2014; Tian et al. Citation2016), frequency ratio method (Qi et al. Citation2009) and other methods for determining evaluation indicators have been developed; Furthermore, Analytic Hierarchy Process (AHP) and various improved AHPs (Li et al. Citation2015; Yin et al. Citation2016) and regression coefficient methods are used to determine the weight of each factor (Liu et al. Citation2016, et al. Citation2017). Impact factors should be classified individually regardless of using which model. However, studies on how to classify these impact factors are limited. The rating of indices in research before was determinate by using an experiential method or by referring to others’ research. Therefore, a Backward Cloud Algorithm was introduced to choose and rate each index of collapse because it has more mathematical rationale.
In this paper, hazard assessment index systems were established by analysis of the disaster-formative intrinsic and triggering factors. The rating for each index was done by using backward cloud algorithm. Hazard assessment of collapse along highways could be quickly implemented based on the index system, the index grading and GIS technology. It is likely to provide decision-making support for the prevention and relief of collapse along highways. At the same time, methods and procedure of the paper are useful and effective in the evaluation of other geological hazards.
2. Methodology
2.1. Hazard assessment model
The hazard assessment model of a highway collapse was based on a superposition theory of regional influencing factors and the equation was established as follows:
(1)
(1)
where P is the hazard level of a regional highway collapse, Ri represents the grades of the hazard evaluation indices, Mi is the weight of the hazard evaluation indices and n is the number of hazard evaluation indices.
2.2. Evaluation index determination method
The essence of evaluation index superposition theory is multiple regressions. The three basic assumptions of multiple regressions are as follows:
Observations among participants are independent;
The variable follows the multivariate normal distribution;
Homoscedasticity.
These assumptions are slightly rigorous to satisfy all factors involved in the analysis, that is, the variables in the regression. Consequently, these assumptions are difficult to fully implement in most studies. Thus, Li et al. (Citation2004) introduced a cloud model algorithm. This algorithm uses a generator formed by three numerical characteristics, namely, expectations, entropy (i.e. the ambiguity of things) and hyper-entropy (i.e. the randomness of things) to describe the randomness and fuzziness of a qualitative concept. Normal cloud models not only broaden the formation conditions of a normal distribution but also assign the normal membership function as the expectation of a random membership degree. Thus, these models are universally applicable.
The inputs of a forward cloud algorithm are the expectation value (Ex), entropy (En) and hyper-entropy (He) of a certain qualitative concept for a cloud with N droplets. Meanwhile, the outputs are the position in a data space and the certainty of a concept for each of the N cloud droplets. A backward cloud algorithm is the opposite. The inputs are the quantitative position in a data space and the certainty of a concept for each of the N cloud droplets, whereas the outputs are the expected value (Ex), entropy (En), hyper-entropy (He) and the number of cloud droplets (n). Disaster analysis is based on the statistics of many past disasters. Therefore, the backward cloud algorithm is the most suitable one for this research.
The process of a high-dimensional, non-deterministic backward cloud algorithm calculation is as follows (Chen Citation2010; Deng et al. Citation2015; Qi et al. Citation2015; Chen et al. Citation2015; Zhang et al. Citation2014; Li et al. Citation2004):
Input: Quantitative values of N m-dimensional cloud droplets xi = {xi1, xi2, …, xim}, (i = 1, …, N).
Output: The estimated value of three characteristics that represent the qualitative concept of the cloud drop samples. (Ex = {Ex1, Ex2, …, Exm}, En = {En1, En2, …, Enm}, He = {He1, He2, …, Hem})
① Calculate the jth dimensional average () of the quantitative value xij of N samples.
(2)
(2)
② Calculate the jth dimensional expected value () of the sample.
(3)
(3)
③ Calculate the jth dimensional entropy () of the sample.
(4)
(4)
④ Calculate the variance () of the jth dimensional sample of the sample.
(5)
(5)
⑤ If , then proceed to Step ⑦, else to Step ⑥.
⑥ Delete the e = 1% samples that are nearest the expected value in the jth dimensional samples: Delete (), N = 0.99
N, then proceed to Step ④.
⑦ Calculate the super-entropy () of the jth dimensional sample.
(6)
(6)
where N is the number of samples, m is the sample dimension,
is the jth dimensional average of the sample,
is the jth dimensional expected value of the sample,
is the jth dimensional entropy of the sample,
is the jth dimensional variance of the sample and
is the jth dimensional hyper-entropy of the sample.
For the 1D calculation of hazard evaluation indices, the following simplified method can be used:
Input: Quantitative values of N cloud drop samples xi (i = 1, 2, …, N)
Output: Estimated values of the numerical characteristics (Ex, En, He) of a qualitative concept of the cloud drop sample.
① Calculate the average () of the quantitative value xi of N samples.
(7)
(7)
② Calculate the jth dimensional expected value () of the sample.
(8)
(8)
③ Calculate the jth dimensional entropy () of the sample.
(9)
(9)
④ Calculate the variance () of the jth dimensional sample of the sample.
(10)
(10)
⑤ If , then proceed to Step ⑦, else to step ⑥.
(11)
(11)
where
is the average of the sample,
is the expected value of the sample,
is the entropy of the sample,
is the variance of the sample and
is the hyper-entropy of the sample.
Two examples are listed as follows to illustrate the application of this method in index selection and classification.
2.2.1. Slope grade
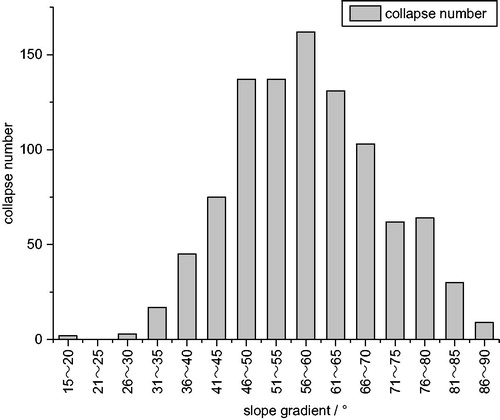
Select and analyze the slope grade data of each collapse point in the statistics of collapse in the Wenchuan Earthquake (Qi et al. Citation2009; Cheng Citation2011; Shen Citation2015; Wang et al. Citation2012). The statistics of the number of collapse in different slope grade ranges are depicted in . The cloud drop numerical characteristics of slope grade indices (Expected value = 57.75, Entropy
= 12.34, Excess-Entropy
= 0.62) are calculated using the 1D backward cloud algorithm. The expected value represents the expectation of a slope grade index cloud drop in the domain of discourse. Entropy represents the fuzziness of the numerical range in this cloud drop. Excess-entropy reflects the discretization degree of the cloud. The slope grade index can be treated as a universal normal function (Liu et al. Citation2014) because the excess-entropy of this index is 0.62, which suggests that the discretization of the slope grade index is within an acceptable range. The slope grade can be inferred as an independent factor and can consequently be selected as a highway collapse influencing factor. In the evaluation index classification, four values, that is, ‘μ – 2σ; μ – σ; σ; μ + σ’, are selected as the boundary points to divide the slope grade impact factors into five segments, where μ is the expected value (i.e. μ = 57), and σ is the variance (i.e. σ = 12). The segment intervals are (0, 33), (33, 45), (45, 57), (57, 70) and (70, 90) (unit: °).
Figure 1. Relationship between slope gradient and collapse in the Wenchuan earthquake.
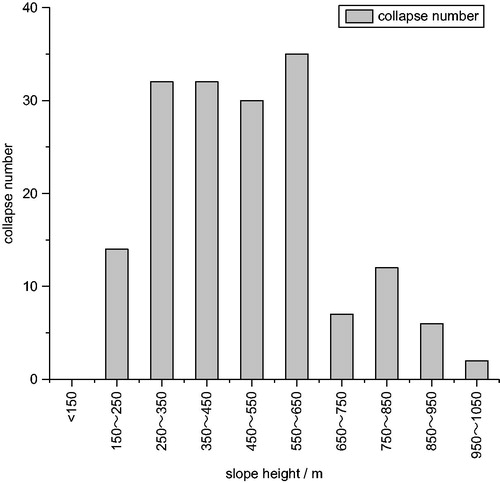
2.2.2. Slope height
The statistics of collapse in the Wenchuan Earthquake (Cheng Citation2011) is selected to analyze the relationship between slope height and collapse. The number of collapse in different slope height ranges are demonstrated in . The calculation result of the cloud drop numerical characteristics of the slope height index are ( = 189.97,
= 177.08,
= 68.78). Entropy
=177.08 indicates that the fuzziness degree of the numerical range in this cloud drop is high. Excess-Entropy
= 68.78 suggests that the discretization degree of the cloud is also slightly high. These results suggest that slope height is not an independent factor in a collapse. Slopes with the same heights can have different hazard degrees with various rock mass structures and lithologies. Thus, the present research did not select slope height as a highway collapse influencing factor. The statistical histogram of slope height in the Wenchuan Earthquake is displayed in .
Figure 2. Relationship between slope height and collapse in the Wenchuan earthquake.
3. Hazard assessment index system
The structure of rocks in highway slopes is gradually damaged after a disturbance from artificial excavation and long-term erosion by gravity, groundwater and surface water, thereby resulting in rock cracks. The rocks may suddenly avalanche out of the slope and then roll, bounce or fall to the foot of the slope when heavy rainfall or earthquake occurs, thereby becoming a road threat.
A major internal cause of slope collapse is a geological process, including geological origin and tectonic action. The external causes of collapse include long-term natural forces, such as wind power, hydraulic power, freeze–thaw cycles, temperature changes and trigger factors (e.g. precipitation and earthquake effects). The specific indicators of internal and external factors are illustrated in .
Figure 3. Analysis of Collapse influencing factors.
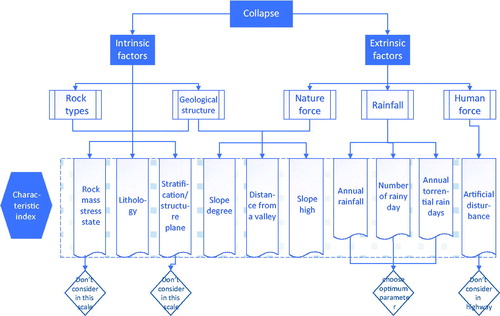
The illustration of each index factor is as follows:
Rock mass stress state, rock stratification and structure plans. These two factors are not suitable for large-scale regional hazard analysis although they play a key role in the collapse of one rock or one slope. Thus, they were not chosen into the index system in this research.
Rock types. The influence of rock types on highway collapses is significant. Diverse lithologies are formed under different geological environments and geological structures. The rock mass is the material basis for the collapse. Qi et al. (Citation2009) point out that a collapse is developed when rocks are significantly hard.
Slope grade. Slope grade is a significant specific indicator of the environment of disaster. It is the result of the cooperation of geological tectonics and natural forces. Based on numerous samples, the number of collapses in different slope gradients that range from 0°–90° is distributed normally, and the average gradient value is approximately 55°.
Distance to the valley. A gully is a deep ditch that is cut by running water, especially after a prolonged downpour. A valley is a low stretch of land between hills, especially the hills with a river traversing them. The analysis results of Xu et al. (Citation2013) indicated that the occurrence of geological disasters on a slope is frequent when the area from a valley is near.
Slope high. The same as slope grade, slope high also reflects the cooperation of geological tectonics and natural forces. While the correlation of slope grade and collapse is not quite clear as the calculation result shown in Section 2.2.2 in this paper. Therefore, slope high is not chosen into the assessment index system.
Annual torrential rain days. Rainfall is one of the foremost inducing factors. Huang et al. (Citation2012) and Liu (Citation1998)’s research indicated that, in all indices of rainfall, a collapse is closely related to short-term heavy rainfall.
Human factors. Artificially excavating slopes, mining, and building reservoirs are significant incentives for the collapse. This indicator is not considered in this article because of the road construction is an artificially disturbed for the slope, and because the construction of mining and reservoir is not applicable in large-scale regional analysis.
Four indices, namely, average days of rainstorm per year, average slope gradient, surface cutting density and rock types, were finally selected to synthesize each kind of situation based on the principles of relative independence, easy statistics and identification and wide application range.
The grading for each index was calculated by Backward Cloud Algorithm based on the statistics of collapses in China. With reference to the AHP method, the scoring values of each scale are 1, 3, 5, 7 and 9 (Qi Citation2011). Ultimately, the evaluation index classification and influence degree for each index of collapse along a highway are displayed in .
Table 1. Evaluation index classification and evaluation score of collapse along a highway.
4. Hazard assessment model of a highway collapse
4.1. Evaluation index weight
The influence of each index can be described by the index weight on highway collapse. The factor is crucial for the formation of a collapse when an evaluation index weight is large. The evaluation index weight can be calculated through G1 method. The G1 method is an order relation analysis method introduced by Guo et al. (Citation2018)
Calculation steps:
Step 1: Determine the order of indicators.
If the importance of evaluation index Xi is greater than or equal to evaluation index Xj, then Xi>Xj.
Experts establish the following relationship in the indicator set {X1, X2, …, Xn}:
Step 2: Determine the relative importance of the adjacent indicators rk is used to denote the importance ratio of adjacent indicators Xk−1 and Xk.
(12)
(12)
The value of rk is listed in .
Table 2. rk assignment reference.
Step 3: Weight calculation.
From the previous step,
(13)
(13)
Weight calculation:
The four indicators of collapse in this paper are slope gradient, distance from a valley, annual torrential rain days and geotechnical type. The order of importance determined by the experts is slope gradient (X1)>annual torrential rain days (X2)>geotechnical type (X3)>distance from a valley (X4).
In EquationEquation (16)(16)
(16) ,
= 0.176. In Equation (17),
= 0.176,
= 0.282 and
= 0.395. The evaluation index weight of collapse along the highway is presented in .
Table 3. Evaluation index weight of collapse along a highway.
4.2. Spatial analysis of collapse hazards along a highway
The data of slope gradient and distance from a valley came from a digital elevation model in China. The annual torrential rain day data from the Disastrous Weather Atlas in China are used. Meanwhile, the rock type data are obtained from the Quaternary Geological Map of China.
The basic data were analyzed by the ArcGIS software after vectorization, and the classification figure for each index can be obtained based on . While the spatial map of each individual indicators is shown in . Thus, the weight data for each indicator are displayed in and are used in EquationEquation (1)(1)
(1) . The hazard distribution of collapse along a highway in China can be determined using the spacing analysis module of ArcGIS. The result is demonstrated in .
Figure 4. Classification maps showing each impact factor of collapse hazards in China. (a) Slope degree; (b) Annual torrential rain days; (c) Rock types; (d) Distance from a valley. Source: Author
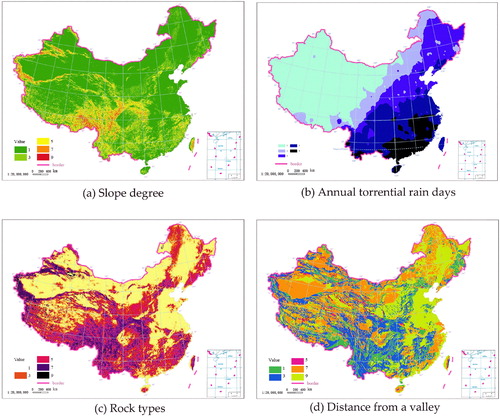
Figure 5. Hazard distribution of collapse hazard along a highway in China. Source: Author
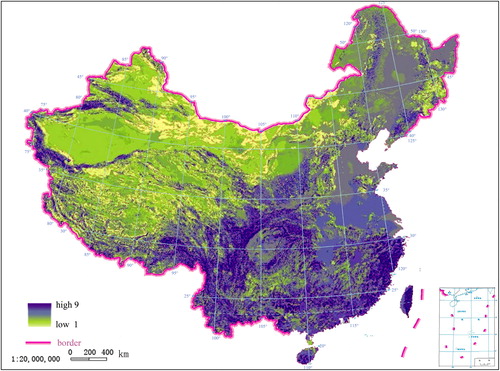
Items 1–9 in indicate that the hazard is from low to high. exhibits the following results:
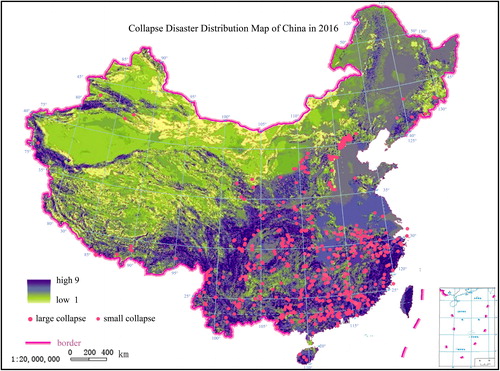
Figure 6. Distribution of hazard check point for the reasonableness check of hazard assessment. Source: Chinese Academy of Geologecal Sciences, http://www.geoscience.cn/index.htm
The collapse hazard in Most of the areas in Northwest China (except the Tianshan and Kunlun Mountains) is relatively light, followed by the northeast, whereas the southwestern and southeast coastal areas hazard the most serious disasters, that is the mountainous areas in Southeastern Taiwan, the southeast mountainous areas in Fujian–Zhejiang, Southern Hainan, the Sichuan–Yunnan Mountains, Tianshan Mountains and Kunlun Mountains.
For example, from a region perspective, Shaanxi Province is divided into the northern part, Guanzhong region and southern part. The Qinling Mountains divide Southern Shaanxi and the Guanzhong region.
In Southern Shaanxi, most of the areas are mountainous with obvious surface cutting, numerous valleys, steep slope and heavy rainfall. Thus, this area has the highest danger level in Shaanxi. The Guanzhong area is in the Central Plains with a flat terrain and less rainfall than the southern mountainous area and thus has the lowest danger level among the three regions. The northern part of Shaanxi is in the Loess Plateau, with several valleys and rainfall conditions that are similar to the Guanzhong area and thus the hazard is slightly higher than that of the Guanzhong area and lower than that of the southern area. The impact of collapse hazards should be considered in the planning, design, construction and maintenance of highways in the Qinling Mountains area and in Southern Shaanxi. Preventive measures should also be diligently performed.
4.3. Verification of evaluation result
The collapse distribution of China in 2016 was used to do the reasonableness check of collapse hazard assessment model, as shown in .
The verification is based on the following 3 criteria:
The model is reasonable when the percentage of disaster points in higher-grade hazard zones.
The model is reasonable when the area percentage of light disaster zoning is large.
The ratio (Rek), that means the ratio of the percentage of the test point in k zone (Gek) to the percentage of the area of k zone to the total area (Sai), should increase as k increase, that is ReI < ReII < ReIII < ReIV.
(16)
Where Gek is the percentage of the test point in k zone, Sak is the percentage of the area of k zone to the total area.
The result of the test is shown in .
Table 4. Rationality inspection of the assessment results of the collapse hazard.
The Light disaster area (I) in corresponds to hazard level 1–3 in , the moderate disaster area (II) corresponds to hazard level 4–5 in , and the severe disaster area (III) corresponds to hazard level 6–7 in , while extra-severe disaster area (IV) corresponds to hazard level 8–9 in .
It can be seen from that: the disaster points in the most severely affected areas (IV) have the largest percentage, and the light disaster area is the largest one, as well as the Rek value also meets the inspection criteria: ReI < ReII < ReIII< ReIV. Indicating that the results of the assessment of collapse hazard are reasonable.
5. Discussion
A backward cloud algorithm was used in this research to classify the evaluation indices which can be used with multiple regressions for other disaster evaluations. How to correction parameters for indices whose distribution law are not obvious for large-scale applications can be done in future research.
The factors were selected to consider the effect of large-scale disasters. The future research, especially in the hazard assessment research in small areas, can focus on intensive and comprehensive index analysis based on further extensive data.
6. Conclusion
The assessment index system is established. Four hazard evaluation indices, namely, slope gradient, distance from a valley, annual torrential rain days and geotechnical type, were determined according to the collapse data. Each index has been grading into four intervals using the improved backward cloud algorithm.
The hazard assessment model of collapse along a highway was established through the superposition of influence factors. The basic index maps and the spatial analysis of the collapse hazard along a highway were completed using the ArcGIS software. The assessment results are consistent with actual situations as the results have been tested by the data of collapse in China in 2016.
The highest dangerous areas are mainly distributed in mountainous areas in Southeast Taiwan, mountainous areas in Southeast Fujian–Zhejiang, Southern Hainan, the Sichuan and Yunnan mountains, Tianshan Mountains and Kunlun Mountains. In these areas, collapse should be paid more attention in highway planning and construction in the future. Avoiding geologically extremely bad sections, constructing effectively slope support and using monitoring and measuring system if it is necessary.
The distribution of collapse hazard along highways in China can provide a macroscopic reference for highway collapse planning and fund allocation.
Disclosure statement
No potential conflict of interest was reported by the authors.
Additional information
Funding
Related Research Data
References
- Chen GL. 2010. Uncertain model of qualitative/quantitative information transformation-cloud model. Appl Res Comp. 27(6):2006–2010.
- Cheng Q. 2011. Research on development rules of seismic landslide and collapse along highways in highly seismic region of wenchuan earthquake l. Chinese J Rock Mech Eng. 9(9):1747–1760.
- Chen H, Li B, Liu CY. 2015. An algorithm of backward cloud without certainty degree. J Chinese Comp Syst. 36(3).
- Deng WH, Wang GY, Zhang XR. 2015. A novel hybrid water quality time series prediction method based on cloud model and fuzzy forecasting. Chemometr Intell Lab Syst. 149(1):39–49.
- Gentile F, Bisantino T, Liuzzi GT. 2008. Debris-flow risk analysis in south Gargano watersheds (Southern-Italy). Nat Hazards. 44(1):1–17.
- Guo YJ, Zhang FM, YI PT. 2018. Rationality analysis on different scales and comprehensive evaluation result sensitivity. Systems Engineering and Electronics. 30(7):1277–1280
- Guzzetti F, Rerchenbach P, Carddinali M, Galli M, Ardizzone F. 2005. Probabilistic landslide hazard assessment at the basin scale. Geomorphology. 72(1–4):272–299.
- Huang L, Li Q, Yuan HD. 2012. Impact of precipitation on the degree of development of geological disasters in Hubei province. Resour Environ Eng. (4):369–375.
- Kawagoe S, Kazama S, Sarukkalige R. 2009. Assessment of snowmelt trigg ered landslide hazard and risk in Japan. Cold Reg Sci Technol. 58(3):120–129.
- Li Y, Chen J, Xu C, Li LJ, Yao X. 2015. Susceptibility assessment of debris flows in the semiarid region based on AHP method: an example from the Benzilan-Changbo segment of the Upper Jinsha River. Geoscience. (4):975–982.
- Li DY, Liu CY. 2004. Study on the universality of the normal cloud model. Eng Sci. 6(8):28–34.
- Liu CZ. 2014. Genetic types of landslide and debris flow disasters in China. Geol Rev. 60(4):858–868.
- Liu Y. 1998. Critical precipitation of rainstorm for cavsing landslide. Hydrogeol Eng Geol. 43(3):45–47.
- Liu XL, Miao C, Tian CS. 2017. Comparative analysis of two methods for assessing hazard of landslide and debris-flow on a regional scale. J Disaster Prev Mitig Eng. 37(1):71–78.
- Liu XL, Miao C, Tian CS, Qiu JA. 2016. Comparative analysis of risk assessment of landslides and debris flows of China in 2000 and 2010. Adv Earth Sci. 31(9):926–936.
- Liu LN, Xu C, Cheng J. 2014. Landslide factor sensitivity analyses for landslides triggered by 2013 Lushan earthquake using GIS platform and certainty factor method. J Eng Geol. 22(6):1176–1186.
- Li JC, Yin C, Tian WP, Zhang QL. 2015. Vulnerability assessment of natural disasters of Chinese highway. J Beijing Univ Technol. 41(7):1067–1072.
- Ma BC, Tian WP, Zhang XR, Wang FC. 2010. Dividing index for highway comprehensive natural division of China. J Chang'an Univ (Nat Sci Ed). 30(6):33–38.
- Qi HL, Tian WP, Li JC. 2015. Regional risk evaluation of flood disasters for the trunk-highway in Shaanxi, China. Int J Environ Res Public Health. 12(11):13861–70.
- Qi HL, Tian WP, Li JC. 2016. Regional risk evaluation of highway collapse induced by continuous rain in Shaanxi Province. J Chang'an Univ (Nat Sci Ed). 36(3):7–12.
- Qi HL. 2011. Study on evaluation system of highway nature disasters. Xian: Chang'an University.
- Qi HL, Tian WP, Zhang XR. 2011. Landform regionalization for highway in China based on difficulty index. J Chang'an Univ (Nat Sci Ed). 31(1):40–45.
- Qi Z, Wei W, Yong P. 2015. Temporal and spatial distribution characteristics of water resources in Guangdong province based on a cloud model. Water Sci Eng. 12(1):9–17.
- Qi SW, Xu Q, Liu CL, Zhang B, Liang N, Tong LQ. 2009. Slope instabilities in the severest disaster areas of 5·12 wenchuan earthquake. J Eng Geol. 17(1):39–49.
- Shen T. 2015. The development characteristics and genetic mechanism of slope failure in the wenchuan earthquake epicentral area. Chengdu: Chengdu University of Technology.
- Tian CS, Liu XL, Wang J. 2016. Geohazard susceptibility assessment based on CF model and logistic regression models in Guangdong. Hydrogeol Eng Geol. 43(6):154–161 + 1.
- Wang GL, Wu FQ, Qi SW. 2012. Research on failure mechanisms for cantilever and tension crack-type collapse. Rock Soil Mech. 33(S2):269–274.
- Wang FH. 2011. Research on assessment and prediction of regional highway slop disaster based on GIS. Xian: Chang'an University.
- Westen CJV, Castellanosa E, Kuriakose SL. 2008. Spatial data for landslide susceptibility, hazard, and vulnerability assessment: an overview. Eng Geol. 102 (3/4):112–131.
- Xu C, Dai FC, Xu SN, Xv XW, He HL, Wu XY, Shi F. 2013. Application of logistic regression model on the Wenchuan earthquake triggered landslide hazard mapping and its validation. Hydrogeol Eng Geol. 40(3):98–104.
- Yin C, Wang XY, Zhang JL, Tian WP, Huan R. 2016. Hazard regionalization of debris flow disasters along highways based on genetic algorithm and cloud model. Chinese J Rock Mech Eng. 35(11):2266–2275.
- Zhang L, Chen H. 2014. Qualitative evaluation method based on cloud model. J Hubei Univ (Nat Sci Ed). 36(4):329–332 + 3.