
 ?Mathematical formulae have been encoded as MathML and are displayed in this HTML version using MathJax in order to improve their display. Uncheck the box to turn MathJax off. This feature requires Javascript. Click on a formula to zoom.
Abstract
A M8.5 earthquake struck the Haiyuan area in 1920 and resulted in a 240-km long surface rupture zone along the Haiyuan fault (HYF). In this study, to determine the spatial relationship between soil gases and fault activity on a regional scale, radon (Rn) and carbon dioxide (CO2) concentrations in soil gas were measured in situ with a grid spacing of 5 ∼ 10 km along the Haiyuan surface rupture zone (HYSRZ). Ordinary Kriging (OK) and Inverse Distance Weight (IDW) interpolation were used to investigate spatial variations in Rn and CO2 concentrations. Synchronous soil gas anomalies were identified in southern Haiyuan County and at the southern end of the HYSRZ, and were correlated with higher slip rate, larger deformation, and larger degree rupture size than other segments. Moreover, soil gas anomalies were spatially highly coupled with seismically active zones and low b value areas, suggesting that the permeability and porosity of gas emissions are enhanced by higher stress. Two seismic velocity profiles across the gas anomaly area confirmed that low-velocity bodies exist at 0 ∼ 10 km below the surface, as revealed by magnetotelluric (MT) sounding results, indicating that gas emissions are associated with the migration of deep fluids. Our results provide new insight into the source of fluids in the HYSRZ and offer support for the design of a continuous geochemical measurement network in this area.
Introduction
The Earth is an open and dynamic system in which gases continuously escape to the Earth’s surface, especially via active fault zones (King Citation1986; Ciotoli et al. Citation1999; Du et al. Citation2008). This outgassing process is controlled to a large degree by crustal stress fields, deep gas source, and faults (Toutain and Baubron Citation1999; King et al. Citation2006; Chen et al. Citation2022), which drive variations in permeability and porosity (Fu et al. Citation2005; Yang et al. Citation2018). Soil gas anomalies provide indicators of fractures and active fault zones that act as channels for the upward migration of deep-crust- and mantle-derived gases (Lombardi and Voltattorni Citation2010; Zhou et al. Citation2010; Fu et al. Citation2017; Iovine et al. Citation2018). Moreover, coseismic ruptures/fractures enhance near-surface permeability and favour gas emissions, which can persist for decades after seismic events, with higher gas concentrations often correlated with elevated stress and strain in the surface rupture zone (Ciotoli et al. Citation2007; Chiodini et al. Citation2011; Zhou et al. Citation2017; Dong et al. Citation2023). Therefore, geochemical analysis techniques for soil gas are commonly applied to investigate fault activity. Radon (Rn) and carbon dioxide (CO2) are the most significant components of endogenic gas, and are sensitive to fault geometry and seismicity activity (Guerra and Lombardi Citation2001; Yuce et al. Citation2017; Benà et al. Citation2022). Concentration variations in CO2 and Rn in soil gas are spatially correlated with fault activity in seismotectonic environments (Guerra and Lombardi Citation2001; Ciotoli et al. Citation2007; Al-Hilal and Abdul-Wahed Citation2016; Prasetio et al. Citation2023) and deep-seated faults related to frequent seismic activity (Zhou et al. Citation2010; Citation2017; Iovine et al. Citation2018; Sun et al. Citation2021). In general, geochemical profiles across faults can effectively reveal soil gas variation associated with fault activity along different fault segments (Han et al. Citation2014; Ciotoli et al. Citation2016; Sun et al. Citation2017; Yang et al. Citation2021), and survey profiles with a finer spatial resolution of 0.1 ∼ 2 km determined local gas geochemistry (Sun et al. Citation2016). The relationship between gas behaviour and tectonic activity at a regional scale can be revealed by a regional geochemical survey with a sampling density of 1 ∼ 6 samples per km2 (Guerra and Lombardi Citation2001; Ciotoli et al. Citation2007; Li et al. Citation2013; Fu et al. Citation2017).
A M8.5 earthquake struck the Haiyuan area in 1920 and resulted in a 240-km long surface rupture zone along the Haiyuan fault (HYF). Along the Haiyuan surface rupture zone (HYSRZ), field observations revealed significant variation in degassing associated with fault behaviour and stress state along each segment of the fault (Jiang et al. Citation2000). The degree of fault healing was revealed by a difference in Rn concentrations on both sides of the HYF, with elevated 3He/4He ratios indicating the role of mantle degassing (Sun et al. Citation2016). Mercury (Hg) and Rn concentrations closely correlate with seismic activity and stress state along the HYF (Zhou et al. Citation2017). Moreover, various gas components are strongly emitted along the surface rupture zone of the southeastern HYF (Zhou et al. Citation2011). In these past studies, although local scale investigations of the soil gas–tectonic activity relationship have been performed in different survey profiles, geochemical profile lengths across the HYF ranged from 100 to 300 m; however, the width of the HYSRZ along the southeastern segment exceeds 500 m (Institute of Geology, China Earthquake Administration Earthquake Agency of Ningxia Hui Autonomous Region 1990). A macro-scale soil gas investigation in HYSRZ has not been reported; especially, few studies on soil gas variation associated with seismic activity, stress state and deep structures across the HYF have been discussed. In this study, the relationship between spatial variation of soil gases and fault activity was determined by measuring Rn and CO2 concentrations at the regional scale. The results of this study provide new insight into the relationship between the crustal velocity structure and soil gas geochemistry along the HYSRZ, and offer support for the design of a continuous geochemical measurement network in this area.
Seismo-geological background
A series of complex arc-shaped structural belts are found in the contact zone between the northeastern margin of the Tibeten Plateau and the western margin of the Ordos Block. The HYF was initiated in the pre-Caledonian and remains active. The Haiyuan fault zone (HYFZ) extends along a NWW–NNW arc. Owing to significant strike-slip movement and very complex geometric structure, the HYFZ is composed of multiple secondary shear faults, pull-apart basins, and compression uplifts (Deng et al. Citation1986; Zhang et al. Citation1987; Citation1988; Burchfiel et al. Citation1991; Lasserre et al. Citation1999; Liu-Zeng et al. Citation2007). It can be divided into four segments—SF1, SF2, SF3, and SF4 ()—each of which exhibits unique characteristics and slip rate (; Institute of Geology, China Earthquake Administration Earthquake Agency of Ningxia Hui Autonomous Region 1990).
Figure 1. Tectonic location and topographic map of the study region. (a) Tectonic map of the Tibeten Plateau, Ordos Block, and vicinity; the square shows the location of the study area. (b) Geography of the study area with the locations of sampling sites (triangle), profiles (black line), main faults (red line), and earthquakes epicenters (red circles).
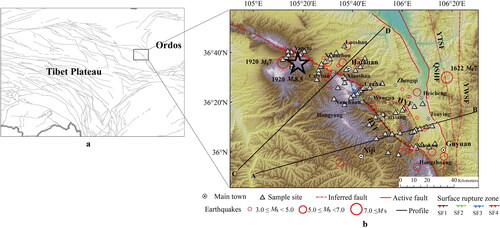
Table 1. Haiyuan fault (HYF) segment characteristics.
Table 2. Statistics of soil gas carbon dioxide (CO2) and radon (Rn).
Global Positioning System (GPS) observations across the HYF indicate that fault displacement differs significantly between the parallel and vertical directions (Li et al. Citation2017; Song et al. Citation2019). The rate variation is concentrated within 50 km on both sides of the fault, and there is no significant strain accumulation on either side, indicating that the fault has not yet entirely healed since the 1920 M8.5 Haiyuan earthquake (HYEQ) [Cui et al. Citation2016]. The inter-seismic creep velocity distribution from Interferometric Synthetic Aperture Radar (InSAR) shows that SF1 and SF4 exhibit obvious afterslip, while the central segments (SF2 and SF3) exhibit relatively little afterslip (Sun et al. Citation2017).
According to the crustal structure from magnetotelluric (MT) profiling, there are obvious differences in resistivity in the HYEQ focus area (Xi’anzhou), and a low resistance body exists near the hypocentre (Zhan et al. Citation2004). Moreover, there is a dipping low-resistivity belt within a high-resistivity background beneath the eastern end of the HYF (near Xiaokou). High resistivity layers from 1 to >20 km depth are interlayered with low-resistivity zones (Zhan et al. Citation2017). The fine velocity structure of the crust reveals a low-velocity layer at 25 ∼ 30 km depth in the HYEQ region, which is attributed to fluids (Xin et al. Citation2020).
In the HYFZ area, from Yanchi to Xiaokou (), at least 5 earthquakes of M8.5 occurred in the Holocene (Liu and Zhou Citation1985), 8 earthquakes of M > 5 have occurred since 1920, and >30 earthquakes of M > 3.0 have been recorded since 1970.
Materials and methods
Field measurements
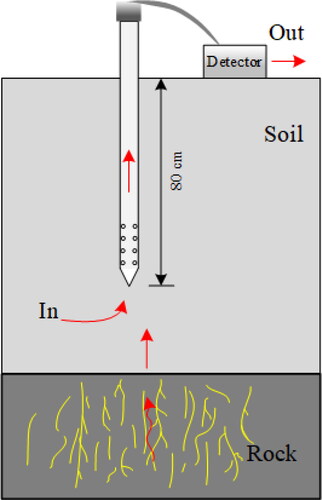
Field measurements were performed over 7 days with stable meteorological conditions in July 2019. Concentrations of Rn and CO2 in soil gas were measured in situ at 69 sampling sites within a 5 ∼ 10 km-spaced grid along the HYSRZ (). To avoid the effect of biological action on the concentrations of soil gases, all sites were in locations with similar loess cover thickness, vegetation density, and humidity. Soil gas samples were collected at depths of ∼80 cm using a hollow steel sampler with 12 holes at the end ()[Chen et al. Citation2018] The concentration of Rn was analysed by a RAD7 Radon Detector with the detector limit of 67 Bq/km3 and calibration error of 10%. The concentration of CO2 was measured with an ATG-C60 CO2 detector (Adtech, China), which has a detector limit of 0.001% and calibration error of 4%.
Figure 2. The schematic diagram of the gas collection system (modified from Chen et al. Citation2018).
Spatial interpolation
To distinguish populations of soil gas concentrations related to seismic and tectonic activities, the upper and lower limits of the Rn and CO2 anomalies were determined using a quantile–quantile (Q–Q) plot (Kafadar and Spiegelman Citation1986; Cheng et al. Citation1994).
Rn and CO2 concentrations were processed by Ordinary Kriging (OK) and Inverse Distance Weight (IDW) interpolation in order to determine the spatial variation of gas geochemistry. The prediction value in the IDW interpolation method is determined by the distance between the measured points and the prediction points, as indicated by EquationEquation 1(1)
(1) (Daly, Citation2006).
(1)
(1)
where n is the measured or predicted sequence length, and
and
are the measured and predicted concentration values of gas component i, respectively; d represents the Euclidean distance between the measured sites and the predicted sites; the power of the Euclidean distance, p, is set to 2 in this paper; the search radius is defined as 12 points.
Kriging interpolation is an unbiased and optimal method that relies on the theory of Semivariance and structural analysis (Kidner Citation2003). The OK interpolation formula is as follows:
(2)
(2)
where λi is the weight coefficient that can be determined by semivariance based on unbiased minimum variance, the spherical model was chosen as the semivariance in this paper. According to statistics, the measured value of Rn and CO2 did not follow a normal distribution (). Consequently, the original soil gas data underwent a logarithmic transformation and the converted data was subjected to spatial interpolation.
To evaluate the variance difference between the predicted value interpolated by OK and IDW, the F-test was performed on the spatial interpolation results of Rn and CO2 (). The mean absolute error (MAE, EquationEquation 3(3)
(3) ) and root mean square error (RMSE, EquationEquation 4
(4)
(4) ) were used to evaluate the accuracy of the spatial interpolations of OK and IDW ():
(3)
(3)
(4)
(4)
Table 3. F Test of the difference between the predicted value and measured value of soil gas carbon dioxide (CO2) and radon (Rn) interpolated by ordinary kriging (OK) and inverse distance weight (IDW).
Table 4. Evaluation of spatial interpolation precision.
Results
The concentrations of Rn and CO2 in soil gas along the HYSRZ () varied widely. Rn concentrations ranged from ∼0.72 to 84.30 kBq/m3, with a mean value of 33.09 kBq/m3, which is much higher than those in the surface rupture zones of the Madoi MS7.4 earthquake in 2021 (range from 2.10 to 39.17 kBq/m3; Wang et al. Citation2023), the Mw 7.0 central Italy earthquake in 1915 (a median value of 14.8 kBq/m3; Ciotoli et al. Citation2007), and the MS8.0 Wenchuan earthquake (a mean value of 22.78 kBq/m3; Zhou et al. Citation2010). The CO2 concentrations ranged from 0.05% to 1.95%, with a mean value of 0.60%.
Table 5. Measured concentrations of soil gas carbon dioxide (CO2) and radon (Rn) along the haiyuan fault zone (HYFZ).
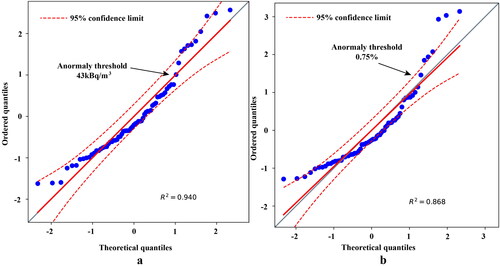
The upper thresholds of Rn and CO2 anomalies from the Q–Q plots were 43 kBq/m3 and 0.75%, respectively (). The proportions of lower values of Rn (<10 kBq/m3) and CO2 (<0.2%) were 8.70% and 5.8%, respectively, indicating that most gas samples were not significantly diluted by air.
Figure 3. Anomaly thresholds of soil gas (a) radon (Rn) and (b) carbon dioxide (CO2) estimated from quantile–quantile (Q–Q) plots.
The spatial distributions of Rn and CO2 concentrations were similar when using both the OK and IDW interpolation methods. However, according to the F-test (), the variance of the difference between the predicted value and measured values of Rn and CO2 obtained by the two methods was significantly different (p < 0.05). Therefore, based on the smallest MAE and RMSE values, the CO2 interpolation results using IDW interpolation were the most accurate,while the Rn results using OK interpolation(, ).
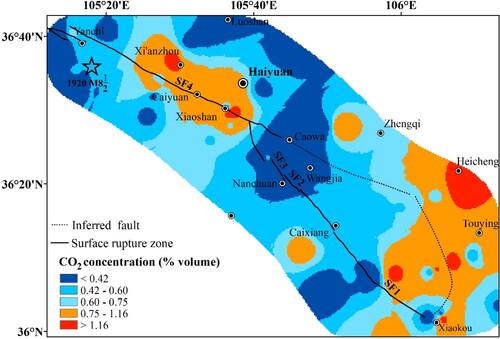
Generally, the CO2 and Rn anomalies were spatially consistent, except for slight differences in size between the distribution areas. Rn anomalies were identified in two areas (): (1) southern Haiyuan County, from the surface rupture zone of Caiyuan to Xiaoshan; and (2) the southern end of the HYSRZ, from north of Xiaokou to Heicheng.
Figure 4. Spatial distribution of soil gas radon (Rn) in the Haiyuan surface rupture zone.
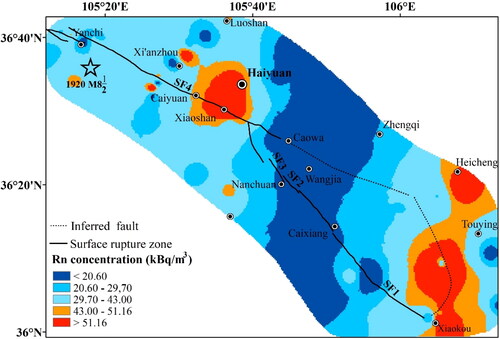
Figure 5. Spatial distribution of soil gas carbon dioxide (CO2) in the Haiyuan surface rupture zone.
Discussion
Correlation of gaseous emissions with fault behaviour and seismic activity
Tensional faults and fractures provide the best channels for deep gas emission. On this basis, anomalies of Rn and CO2 analyses along the fault segments of SF1 and SF4 can be attributed to higher rupture rates, tensile deformation, and higher fault slip rate. Specifically, the Xiaoshan–Caiyuan segment (SF4) of the HYSRZ is characterised by a series of echelon tensile fractures and normal faults (Institute of Geology, China Earthquake Administration Earthquake Agency of Ningxia Hui Autonomous Region 1990). Several NW trending faults are present near Xiaokou (SF1), and the entire region is severely fragmented. These findings on soil gas in this area support the observation that the gas concentration in the tension zone is often higher compared to other areas (Jiang & Yan Citation1990). Moreover, the mean displacement of the river system, fault slip rate in the late Holocene, and fracture zones of the SF1 and SF4 are wider than those of other segments (). The concentration of radon and mercury detected in the geochemical profile in HYF is directly correlated with fault activity. Specifically, the SF4 segment has the highest level of shear fault activity, with Rn concentration being tenfold greater than the background value. Moreover, there is a notable disparity in the levels of Rn in SF1 as opposed to SF4, with substantially lower amounts observed in SF2 and SF3. The cross-fault findings confirm the results of this investigation (Meng et al. Citation1997; Sun et al. Citation2016), indicating a significant relationship between variations in gas concentrations and fault activity. In addition, CO2 anomalies were also detected in the Xi’anzhou area, which may be related to the lush vegetation and relatively dense population. The lowest concentrations of Rn and CO2 were recorded in the middle segment of the HYF, from Caowa to Caixiang, where faults have not been active since the late Pleistocene confirmed by a field geological investigation profile in Wangjia (near SF3, Institute of Geology, China Earthquake Administration Earthquake Agency of Ningxia Hui Autonomous Region 1990).
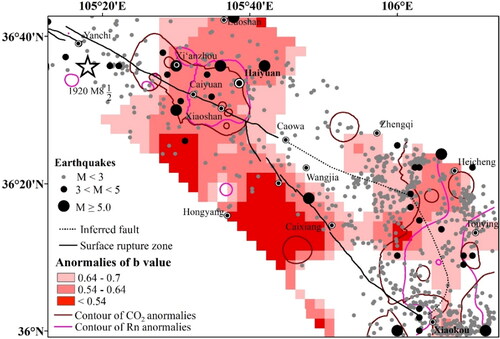
The geochemical characteristics of gases are also closely associated with seismic activity (Pizzino et al. Citation2004; Li et al. Citation2017). To show a correlation between stress state and soil gas variation, b value were calculated by a coefficient of the Gutenberg–Richter equation that can reflect stress accumulation in active fault zones (Scholz Citation1968; Yi et al. Citation2013). In this study, Rn and CO2 anomalies () were mainly distributed around the western and southeastern segments of the HYF, along which earthquakes more frequently occur compared with other segments, and almost all earthquakes of M > 3 have occurred in the gas anomaly area since 1970. Moreover, the Rn and CO2 anomalies were spatially concordant with areas of low b values (<0.7 is set as the threshold for the high stress state in study area) in western Haiyuan County and northern Xiaokou (). The spatial distribution of low b-values corresponds to regions of high gas concentration, as illustrated in the Generalized HYF (Zhou et al. Citation2017), the Xiqinling Fault (Su et al. Citation2013), and the Tangshan area (Lu et al. Citation2022). The permeability and porosity of the underground media are enhanced by frequent seismic activity and high stress state, which is conducive to the upward migration of deep gas.
Figure 6. Spatial distributions of b value and gas anomalies in the Haiyuan surface rupture zone.
The low concentrations of soil gases near the HYEQ epicentre may be related to the sandy soil overburden layer of the Yanchi Basin, which is not conducive to gas occurrence; moreover, gas emissions may be obstructed by fault healing because the elapsed time of the HYEQ is > 100 years. Finally, relatively weak seismic activity and slip rates in this middle segment of the HYF are smaller than those of other segments (Sun et al. Citation2017), which is consistent with the low concentrations of soil gases.
Crustal velocity structure and gas migration
Two seismic exploration profiles were established across the HYF and area of gaseous anomalies (). The A–B profile of S-wave velocity () revealed low-velocity bodies at 0 ∼ 10 km depth in the area of the Rn and CO2 anomalies. A similar phenomenon was observed in the area of the C–D profile (), which coincides with the distribution of low-resistivity in the upper crust (Zhan et al. Citation2004). Local low-resistance bodies (resistivity from 60 to 90 Ω • m) were also found at 15 to 40 km depth below the epicentre of the HYEQ (near profile C–D). Similarly, the deep electrical structure of the Xiaokou area (near profile A–B) also showed obvious low-resistance layers of ∼10 Ω • m at depths of < 5 km in the upper crust and ∼25 km in the lower crust. (Zhan et al. Citation2017). The layers of low velocity and high conductivity result from fluid enrichment.
Figure 7. Cross-sectional image of S-wave velocity variation along the a–B (a) and C–D (b) profiles.
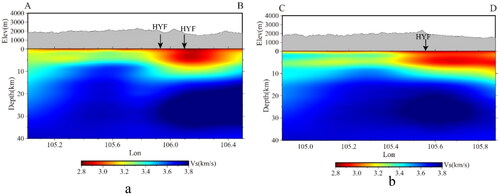
Deep fluids may control the distribution of low-velocity and high-conductivity bodies in the lower crust of the Haiyuan area (Xin et al. Citation2020), and the low-velocity and high conductivity bodies provide a source of soil gases. The HYF extends down more than 30 km into the lower crust (Zhan et al. Citation2004), providing more channels for deep fluid migration to surface. Moreover, moderate and small earthquakes with focal depths of 0 ∼ 15 km increase permeability, further facilitating deep fluid movement.
The influence of environmental parameters on soil gas
In addition to seismological characteristics, the concentration and migration of soil Rn are affected by many environmental factors, such as thoron concentrations (Jaishi et al. Citation2014), meteorological parameters, terrain, and vegetation (Sundal et al. Citation2008). Usually, the presence of abnormally high radon concentration with a low level of thoron activity indicates that the radon originates from a deeper source. Conversely, higher concentrations of thoron with low radon activity suggested that they have been transported to the surface from a shallower source (Giammanco et al. Citation2007). In long-term continuous soil Rn measurements, it has been confirmed that air temperature, air flows, and air pressure play an important role in soil radon concentrations (Sundal et al. Citation2008). Moreover, Soil moisture conditions and wind speed were also significant factors in the soil Rn migration (Fujiyoshi et al. Citation2006). Elevation, soil temperature, soil water content and normalized difference vegetation index (NDVI) were investigated to determine the relationship between Rn concentration and environmental parameters in HYSRZ. The correlation coefficient shown that the spatial distribution of Rn concentration in HYSRZ is not significantly affected by environmental conditions and almost all correlation coefficients are less than 0.1 (). Therefore, the findings demonstrate that seismogeological parameters were the primary influence on soil gas concentration in HYSRZ. Nevertheless, meteorological factors must be considered if continuous Rn investigations are to be conducted in the HSFZ in the future. Machine learning techniques, such as the layered neural network (LNN) and Random Forest (RF), can be used to estimate Rn concentration affected by environmental parameters and identify the anomalies caused by seismic activity (Negarestani et al. Citation2002; Naskar et al. Citation2023).
Table 6. Pearson correlations between Rn concentration and environmental parameters.
Conclusions
In this study, the relationship between the spatial variation of soil gases and fault activity along the HYSRZ at a regional scale was determined by measuring Rn and CO2 concentrations. Combined with geophysical and seismic data, our results support three main conclusions. (1) Rn and CO2 anomalies have a similar spatial distribution, and are concentrated in southern Haiyuan County and at the southern end of the HYSRZ. This suggests that CO2 may act as a carrier for Rn and/or they may be derived from the same sources. (2) Geochemical variations in soil gases are closely related to fault behaviour. In particular, tensional faults and fractures, frequent seismic activity, and low b values (i.e. high tress) result in higher concentrations of Rn and CO2. (3) Low-velocity and high conductivity bodies beneath the HYSRZ facilitate the migration of deep-Earth fluids, including CO2 and Rn. (4)The spatial distribution of Rn concentration in HYSRZ is not significantly influnced by environmental paramters. These results offer support for the design of a continuous geochemical measurement network in this area.
Owing to topographical limitations and poor transportation systems, the spacing of sampling sites in some areas have the unreasonable problem, which may lead to the soil gas variation may be not very accurate. Moreover, as thoron concentration was not measured during this study, the relationship between Rn concentration and thoron activity cannot be performed in this paper. The S-wave velocity deprived from campaign seismic stations may not reflect the subtle feature of deep crustal structure in study area, a follow-up study on relationship between soil gas variation and crustal structure can be performed by high-density electrical method and the seismic wave velocity structure in a large scale.
Data availability statement
The original contributions presented in the study are included in the article/supplementary material, further inquiries can be directed to the corresponding author.
Disclosure statement
No potential conflict of interest was reported by the author(s).
Additional information
Funding
References
- Al-Hilal M, Abdul-Wahed MK. 2016. Tectonic and geologic influences on soil gas radon emission along the western extension of Damascus fault, Syria. Environ Earth Sci. 75(23):1–11. doi: 10.1007/s12665-016-6292-z.
- Benà E, Ciotoli G, Ruggiero L, Coletti C, Bossew P, Massironi M, Mazzoli C, Mair V, Morelli C, Galgaro A, et al. 2022. Evaluation of tectonically enhanced radon in fault zones by quantification of the radon activity index. Sci Rep. 12(1):21586. doi: 10.1038/s41598-022-26124-y.
- Burchfiel BC, Zhang P, Wang Y, Zhang W, Song F, Deng Q, Molnar P, Royden L. 1991. Geology of the Haiyuan Fault Zone, Ningxia-Hui Autonomous Region, China, and its relation to the evolution of the Northeastern Margin of the Tibetan Plateau. Tectonics. 10(6):1091–1110. doi: 10.1029/90TC02685.
- Chen Z, Li Y, Liu Z, Wang J, Zhou X, Du J.,. 2018. Radon emission from soil gases in the active fault zones in the Capital of China and its environmental effects. Sci Rep. 8(1):16772. doi: 10.1038/s41598-018-35262-1.
- Chen Z, Li Y, Liu ZF, He HY, Martinelli G, Lu C, Gao ZH. 2022. Geochemical and geophysical effects of tectonic activity in faulted areas of the North China Craton. Chem Geol. 609:121048. doi: 10.1016/j.chemgeo.2022.121048.
- Cheng Q, Agterberg FP, Ballantyne SB. 1994. The separation of geochemical anomalies from background by fractal methods. J. Geochem. Explor. 51(2):109–130. doi: 10.1016/0375-6742(94)90013-2.
- Chiodini G, Caliro S, Cardellini C, Frondini F, Inguaggiato S, Matteucci F. 2011. Geochemical evidence for and characterization of CO2 rich gas sources in the epicentral area of the Abruzzo 2009 earthquakes. Earth Planet Sc Lett. 304(3-4):389–398. doi: 10.1016/j.epsl.2011.02.016.
- Ciotoli G, Lombardi S, Annunziatellis A. 2007. Geostatistical analysis of soil gas data in a high seismic intermontane basin: fucino Plain, central Italy. J Geophys Res. 112(B5):1–23. doi: 10.1029/2005JB004044.
- Ciotoli G, Sciarra A, Ruggier L, Annunziatellis A, Bigi S. 2016. Soil gas geochemical behaviour across buried and exposed faults during the 24 August 2016 central Italy earthquake. Ann Geophys. 59:1–11. doi: 10.4401/ag-7242.
- Ciotoli G, Etiope G, Guerra M, Lombardi S. 1999. The detection of concealed faults in the Ofanto Basin using the correlation between soil gas fracture surveys. Tectonophysics. 301(3-4):321–332. doi: 10.1016/S0040-1951(98)00220-0.
- Cui DX, Hao M, Li YH, Wang WP, Qin SL, Li ZJ. 2016. Present-day crustal movement and strain of the surrounding area of Ordos block derived from repeated GPS observations. Chin J Geophys. 59(10):3646–3661. doi: 10.6038/cjg20161012.
- Daly C. 2006. Guidelines for assessing the suitability of spatial climate data sets. Int J Climatol. 26(6):707–721. doi: 10.1002/(ISSN)1097-0088.
- Deng QD, Chen SF, Song FM, Zhu S, Wang Y, Zhang Jiao D, Burchfiel BC, Molnar P, Royden L. 1986. Variations in the geometry and amount of slip on the Haiyuan (Nanxihaushan) fault zone, China and the surface rupture of the 1920 Haiyuan earthquake. In: Das S, Boatwright J, Scholz CH, editors. Earthquake source mechanics. New York: American Geophysical Union AGU Geophysical Monograph Series, Wiley. doi: 10.1029/GM037p0169.
- Dong JY, Zhou XC, Li Y, Li J. 2023. CO2 degassing characteristics in the co seismic surface rupture zone of the 2021MW7.4 Maduo earthquake, Qinghai, China. Quat Sci. 43(2):485–493. doi: 10.11928/j.issn.1001-7410.2023.02.16.
- Du J, Si X, Chen Y, Fu H, Jian C. 2008. Geochemical anomalies connected with great earthquakes in China. In: Stefánssonó O, editor. Geochemistry research advances. New York: Nova Science Publishers; p. 57–92.
- Fu CC, Yang TF, Chen CH, Lee LC, Wu YM, Liu TK, Walia V, Kumar A, Lai TH. 2017. Spatial and temporal anomalies of soil gas in northern Taiwan and its tectonic and seismic implications. J Asian Earth Sci. 149:64–77. doi: 10.1016/j.jseaes.2017.02.032.
- Fu CC, Yang TF, Walia V, Chen CH. 2005. Reconnaissance of soil gas composition over the buried fault and fracture zone in southern Taiwan. Geochem J. 39(5):427–439. doi: 10.2343/geochemj.39.427.
- Fujiyoshi R, Sakamoto K, Imanishi T, Sumiyoshi T, Sawamura S, Vaupotic J, Kobal I. 2006. Meteorological parameters contributing to variability in 222Rn activity concentrations in soil gas at a site in Sapporo. Japan. Sci. Total. Environ. 370:224–234.
- Giammanco S, Sims KWW, Neri M. 2007. Measurements of 220Rn and 222Rn and CO2 emissions in soil and fumarole gases on Mt. Etna volcano (Italy): Implications for gas transport and shallow ground fracture. Am Geophys Union. 2007(10):1–14. doi: 10.1029/2007GC001644.
- Guerra M, Lombardi S. 2001. Soil-gas method for tracing neotectonic faults in clay basins the Pisticci field (Southern Italy). Tectonophysics. 339(3–4):511–522. doi: 10.1016/S0040-1951(01)00072-5.
- Han X, Li Y, Du J, Zhou X, Xie C, Zhang W. 2014. Rn and CO2 geochemistry of soil gas across the active fault zones in the capital area of China. Nat Hazard Earth Syst Sci. 14:2803–2815. doi: 10.1016/10.5194/nhess-14-2803-2014.
- Institute of Geology, China Earthquake Administration, Earthquake Agency of Ningxia Hui Autonomous Region. 1990. [Haiyuan Active Fault Zone]. Beijing: Seismological Press; p. 234–855. Chinese.
- Iovine G, Guagliardi I, Bruno C, Greco R, Tallarico A, Falcone G, Luca F, Buttafuoco G. 2018. Soil-gas radon anomalies in three study areas of Central-Northern Calabria (Southern Italy). Nat Hazard. 91: s 193–S219. doi: 10.1007/s11069-017-2839-x.
- Jaishi HP, Singh S, Tiwari RP, Tiwari RC. 2014. Temporal variation of soil radon and thoron concentrations in Mizoram (India), associated with earthquakes. Nat Hazards. 72(2):443–454. doi: 10.1007/s11069-013-1020-4.
- Jiang DY, Chen WB, Shi YL. 2000. [The crust degasification along Haiyuan active fault]. Northwest Seismol J. 22(4):447–464.
- Jiang DY, Yan XC. 1990. Preliminary studies of fluid geochemical field on Haiyuan active fault. Seismol Geol. 12(1):63–68.
- Kafadar K, Spiegelman CH. 1986. An alternative to ordinary Q-Q plots: conditional Q-Q plots. Comput Stat Data Anal. 4(3):167–184. doi: 10.1016/0167-9473(86)90032-0.
- Kidner DB. 2003. Higher-order interpolation of regular grid digital elevation models. Int J Remote Sens. 24(14):2981–2987. doi: 10.1080/0143116031000086835.
- King CY. 1986. Gas geochemistry applied to earthquake prediction: an overview. J Geophys Res. 91(B12):12269–12281. doi: 10.1029/JB091iB12p12269.
- King CY, Zhang W, Zhang Z. 2006. Earthquake-induced groundwater and gas changes. Pure Appl Geophys. 163(4):633–645. doi: 10.1007/s00024-006-0049-7.
- Lasserre C, Morel P‐H, Gaudemer Y, Tapponnier P, Ryerson FJ, King GC. P, Métivier F, Kasser M, Kashgarian M, Liu B, et al. 1999. Postglacial left slip rate and past occurrence of M ≥8 earthquakes on the Western Haiyuan Fault, Gansu, China. J Geophys Res. 104(B8):17633–17651. doi: 10.1029/1998JB900082.
- Li Y, Du JG, Wang X, Zhou X, Xie C, Cui Y. 2013. Spatial variations of soil gas geochemistry in the Tangshan area of Northern China. Terr Atmos Ocean Sci. 24(3):323–333. doi: 10.3319/TAO.2012.11.26.01(TT).
- Li Y, Shan X, Qu C, Zhang Y, Song X, Jiang Y, Zhang G, Nocquet JM, Gong W, Gan W, et al. 2017. Elastic block and strain modeling of GPS data around the Haiyuan-Liupanshan fault, northeastern Tibetan Plateau. J Asian Earth Sci. 150:87–97. doi: 10.1016/j.jseaes.2017.10.010.
- Liu BC, Zhou JX. 1985. [The prehistory major earthquake for Haiyuan active fault]. Seismol Geol. 7(4):11–21. Chinese.
- Liu-Zeng J, Klinger Y, Xu X, Lasserre C, Chen G, Chen W, Tapponnier P, Zhang B. 2007. Millennial recurrence of large earthquakes on the Haiyuan Fault near Songshan, Gansu Province. China. B Seismol Soc Am. 97(1B):14–34. doi: 10.1785/0120050118.
- Lombardi S, Voltattorni N. 2010. Rn, He and CO2 soil gas geochemistry for the study of active and inactive faults. App Geochem. 25(8):1206–1220. doi: 10.1016/j.apgeochem.2010.05.006.
- Lu C, Li Y, Hu L, Zhao C, Liu ZF, Shao JJ, Chen Z. 2022. Study of the flux of soil gas Rn and its relation with seismicity in Tangshan Area. J. Seismol.Res. 45(2):241–248. Chinese.
- Meng GK, He KM, Ban T, Jiao DC. 1997. Study on activity and segmentation of active fault using measurements of Radon and Mercury gases. Earthquake Res China. 13(1):43. 50. Chinese.
- Negarestani A, Setayeshi S, Ghannadi-Maragheh M, Akashe B. 2002. Layered neural networks based analysis of radon concentration and environmental parameters in earthquake prediction. J. Environ. Radioactiv. 62(3):225–233.
- Naskar A, Akhter J, Gazi M, Mondal M, Deb A. 2023. Impact of meteorological parameters on soil radon at Kolkata, India: investigation using machine learning techniques. Environ. Sci. Pollut. R. 30(48):105374–105386.
- Pizzino L, Burrato P, Quattrocchi F, Valensise G. 2004. Geochemical signatures of large active faults: the example of the 5 February 1783, Calabrian earthquake (southern Italy). J Seismol. 8(3):363–380. doi: 10.1023/B:JOSE.0000038455.56343.e7.
- Prasetio R, Laksminingpuri N, Satrio S, Pujiindiyati ER, Pratikno B, Sidauruk P. 2023. The 222Rn and CO2 soil gas distribution at Lembang Fault Zone, West Java—Indonesia. J Environ Radioact. 257:107079. doi: 10.1016/j.jenvrad.2022.107079.
- Scholz CH. 1968. The frequency-magnitude relation of microfracturing in rock and its relation to earthquakes. B Seismol Soc Am. 58(1):399–415. doi: 10.1785/BSSA0580010399.
- Song X, Jiang Y, Shan X, Gong W, Qu C. 2019. A Fine velocity and strain rate field of present-day crustal motion of the Northeastern Tibetan Plateau inverted jointly by InSAR and GPS. Remote Sens. 11(4):435. doi: 10.3390/rs11040435.
- Su HJ, Zhang H, Li CH, Wu JB, Zhou HL. 2013. Geochemical features of fault Gas on Northern Margin Fault of Xiqinling and its seismic hazard analysis. China Earthquake Eng J. 35(3):371–676. Chinese.
- Sundal AV, Valen V, Soldal O, Strand T. 2008. The influence of meteorological parameters on soil radon levels in permeable glacial sediments. Sci Total Environ. 389(2-3):418–428. doi: 10.1016/j.scitotenv.2007.09.001.
- Sun H, Xu J, Liu HY. 2017.Depth present-day movement in the mid-eastern segment of Haiyuan fault zone based on InSAR. J Geod Geodyn. 37(11):1141–1145. doi: 10.14075/j.jgg.2017.11.009.Chinese.
- Sun X, Wang GC, Shao ZG, Si X. 2016. Geochemical characteristics of emergent gas and groundwater in Haiyuan fault zone. Earth Sci Front. 23(3):140–150. doi: 10.13745/j.esf.2016.03.018.Chinese.
- Sun X, Yang PT, Xiang Y, Si XY, Liu DL. 2017. Across-fault distributions of radon concentrations in soil gas for different tectonic environments. Geosci J. 22(2):227–239. doi: 10.1007/s12303-017-0028-2.
- Sun Y, Zhou X, Yan Y, Li J, Fang W, Wang W, Liu Y. 2021. Soil degassing from the Xianshuihe–Xiaojiang fault system at the eastern boundary of the Chuan–Dian Rhombic Block, Southwest China. Front Earth Sci. 9:1–12. doi: 10.3389/feart.2021.635178.
- Toutain JP, Baubron JC. 1999. Gas geochemistry and seismotectonics: a review. Tectonophysics. 304(1–2):1–27. doi: 10.1016/S0040-1951(98)00295-9.
- Wang B, Cui FZ, Liu J, Zhou YS, Xu S, Shao YX. 2023. Fault gas observation and surface rupture feature interpretation of Ms 7.4 Madoi earthquake. Seismol Geol. 45(3):772–794. doi: 10.3969/j.issn.0253-4967.2023.03.010.Chinese.
- Xin HL, Zeng XW, Kang M, Gao J. 2020. Crustal fine velocity structure of Haiyuan arcuate tectonic zone from double difference tomography. Chinese J Geophys. 63(3):897–914. doi: 10.6038/cjg2020N0067.
- Yang Y, Li Y, Guan ZJ, Chen Z, Zhang L, Lv CJ, Sun FX. 2018. Correlations between the radon concentrations in soil gas and the activity of the Anninghe and the Zemuhe faults in Sichuan, southwestern of China. Appl. Geochem. 89:23–33. doi: 10.1016/j.apgeochem.2017.11.006.
- Yang Y, Li Y, Li Y, Ji L, Gong Y, Du F, Zhang L, Chen Z. 2021. Present-day activity of the Anninghe fault and Zemuhe fault, southeastern Tibetan Plateau, derived from soil gas CO2 emissions and locking degree. Earth Space Sci. 8(10):1–21. doi: 10.1029/2020EA001607.
- Yi GX, Wen XZ, Xin H, Qiao HZ, Wang SW, Gong Y. 2013. Stress state and major earthquake risk on the southern segment of the Longmen Shan fault zone. Chin J Geophys. 56:1112–1120. doi: 10.6038/cjg20130407.Chinese.
- Yuce G, Fu C, Alessandro W. 2017. Geochemical characteristics of soil radon and carbon dioxide within the Dead Sea Fault and Karasu Faultin the Amik Basin (Hatay). Turkey. Chem Geol. 469:1–18. doi: 10.1016/j.chemgeo.2017.01.003.
- Zhan Y, Yang J, Zhao G, Zhao L, Sun X. 2017. Deep electrical structure of crust bebeath the Madongshan step area at the Haiyuan fault in the northeastern margin of the Tibetan plateau and tectonic implications. Chin J Geophys. 60(6):2371–2384. doi: 10.6038/cjg2017062.Chinese.
- Zhan Y, Zhao G, Chen XB, Tang J, Wang JJ, Deng QH. 2004. Crustal structure from magnetotelluric profiling in the Haiyuan earthquake area, Ningxia Hui Autonomous Region, China]. Chin J Geophys. 47(2):274–281. Chinese.
- Zhang PZ, Molnar P, Burchfiel BC, Royden L, Yipeng W, Qidong D, Fangmin S, Weiqi Z, Decheng K. 1988. Bounds on the Holocene slip rate of the Haiyuan fault, North-Central China. Quat Res. 30(2):151–164. doi: 10.1016/0033-5894(88)90020-8.
- Zhang W, Jiao D, Zhang PZ, Molnar P, Burchfiel BC, Deng Q, Wang Y, Song F. 1987. Displacement along the Haiyuan fault associated with the great 1920 Haiyuan. China, Earthquake. B Seismol Soc Am. 77:117–131.
- Zhou X, Wang C, Chai C, et al. 2011. The geochemical charateristics of soil gas in the southeastern part of Hainyuan fault. Seismol Geol. 33(1):123–132. Chinese.
- Zhou H, Su H, Zhang H, Li C. 2017. Correlations between soil gas and seismic activity in the Generalized Haiyuan Fault Zone, North-Central China. Nat Hazards. 85(2):763–776. doi: 10.1007/s11069-016-2603-7.
- Zhou X, Du J, Chen Z, Cheng J, Tang Y, Yang L, Xie C, Cui Y, Liu L, Yi L, et al. 2010. Geochemistry of soil gas in the seismic fault zone produced by the Wenchuan MS 8.0 earthquake, southwestern China. Geochem Trans. 11(1):5. doi: 10.1186/1467-4866-11-5.