
ABSTRACT
Reverse osmosis (RO) concentration of chokeberry juice, a rich source of polyphenols, at three different pressures (45, 50 and 55 bar) and two temperature regimes (with cooling and without cooling of the retentate) was studied. Concentration was carried out on a laboratory membrane unit with plates and frames on composite Alfa Laval membranes RO98pHt. Juice was concentrated till 24.9% of total soluble solids content (TSSC) . The permeate flow highly depended on processing parameters and varied from 15.19 ± 3.22 L/m2h at the beginning to 8.00 ± 2.21 L/m2h at the end of processes. Total phenolic compounds (4 anthocyanins, 2 flavonols and 2 phenolic acids) were determined by high performance liquid chromatography (HPLC). Twenty four volatile compounds were identified by gas chromatography with mass spectrometry (GC-MS) in chokeberry juice and concentrates. Processes at 50 and 55 bar with cooling proved to be the best in terms of chokeberry aroma, antioxidant activity and total phenolic compounds retention.
RÉSUMÉ
Se estudiaron la concentración de la ósmosis inversa del zumo de arándano silvestre, una fuente rica en polifenoles, a tres presiones diferentes (45, 50 y 55 bares) y dos regímenes de temperatura (enfriando y sin enfriar el retenido). La concentración se realizó en un laboratorio con tecnología de la membrana con placas y estructuras compuestas de membranas Alfa Laval RO98pHt. El zumo se concentró hasta el 24,9% del contenido total de sólidos solubles. El flujo de permeación dependió altamente de los parámetros de procesamiento y varió entre 15,19±3,22 L/m2h al principio y 8.00±2.21 L/m2h al final del procesamiento. Se determinó el total de compuestos fenólicos (4 antocianinas, 2 flavonoles y 2 ácidos fenólicos) mediante HPLC (cromatografía líquida de alta resolución). Se identificaron veinticuatro compuestos volátiles mediante GC-MS (cromatografía de gases - espectrometría de masas) en el zumo de arándano silvestre y concentrados. Se probó que los procesos a 50 y 55 bares con enfriamiento fueron los mejores en relación al aroma del arándano silvestre, la actividad antioxidante y el total de retención de compuestos fenólicos.
Introduction
In order to reduce the costs of storage, transport and achieve a longer shelf life, fruit juices are usually concentrated by multi-stage evaporation. However, such a concentration leads to a significant loss of aroma, colour and thermal degradation of sensitive ingredients like anthocyanins. Thanks to the development of new polymer membranes, particularly composite membranes, modules and process solutions to the membrane processes (microfiltration, ultrafiltration, nanofiltration (NF) and reverse osmosis (RO)) are widely used in the food and similar industries (Ganorkar, Nandane, & Tapre, Citation2012). The main advantages of membrane processes are: less thermal degradation of the product, greater retention of aroma, lower power consumption and lower cost of equipment (Jiao, Cassano, & Drioli, Citation2004). One of the biggest disadvantages of these processes is the inability to achieve high content of dry matter. Studies have shown that the maximum level of the dry matter that can be achieved is about 28–35 °Brix depending on the type of the fruit juice that is concentrated, and the equipment and membranes used (Ganorkar et al., Citation2012; Jiao et al., Citation2004). RO and nanofiltration (NF) are used for the concentration of various fruit juices: oranges (Jesus et al., Citation2007), grapes (Gurak, Cabral, Rocha-Leão, Matta, & Freitas, Citation2010), apples, pineapple (Couto, Cabral, Matta, Deliza, & Castro Freitas, Citation2011), blueberries, cranberries (Pap et al., Citation2009), etc. Chokeberry juice is one of the richest sources of natural polyphenols, one litre of juice can contain up to 7 g of polyphenols (Bermudez-Soto et al., Citation2007). The content of polyphenols in chokeberries is much higher than in other sorts of fruits like blackberries, blueberries, raspberries, etc. (Jakobek, Šeruga, Novak, & Medvidović-Kosanović, Citation2007). Chokeberry is an excellent source of antioxidants (Oszmianski & Wojdylo, Citation2005) and as such it showed a potential to prevent blood vessel diseases, to regulate blood pressure (Kulling & Rawel, Citation2008), strengthens the immune system, it showed a beneficial effect on the digestive system (Matsumoto, Hara, Chiji, & Kasai, Citation2004) and a potential to prevent cell proliferation of some cancer conditions (Sharif et al., Citation2012). Due to bitter-almond smell and astringent taste, chokeberries are usually processed and consumed in various shelf-stable forms including juices, nectars, jams, wines and liqueurs (Kraujalyte, Leitner, & Venskutonis, Citation2013). The aim of this study was to investigate RO concentration of chokeberry juice and the influence of processing parameters (such as temperature and pressure) on the permeate flow, antioxidant activity and the retention of aromatic compounds, anthocyanins, phenolic acids and flavonols.
Materials and methods
Preparation of chokeberry juice
Mature fruits of chokeberry (Aronia melanocarpa), cultivar Nero were harvested in August 2014 in Croatia, Viroviticko-pozeska county. Immediately after harvesting the berries were transported to a fruit and vegetable processing plant and chokeberry juice was obtained by pressing. Fresh compressed juice was pasteurised at 85°C for 10 minutes and stored in a glass bottles, in a dark, and cold place (4°C) until the assay. Total soluble solids content (TSSC) of the pasteurised juice was 13% and pH was 3.62. This pasteurised juice (initial juice) was used in all RO processes. Concentrates obtained by using RO processes were diluted to an initial juice TSSC before the DPPH assay; total polyphenol, total anthocyanin, anthocyanin degradation, flavonoid, aroma compound and individual phenolic determination.
Reverse osmosis equipment and concentration procedure
The experiment was conducted on a membrane filtration laboratory device with frames and plates DDS LabUnit M20 (De Danske Sukkerfabrikker, Denmark). This membrane system consist of a feed tank, a high pressure piston pump Rannie 16.50, pressure gauges, membrane module, pressure control valve and a heat exchanger. All experiments were conducted in the recirculation. Six composite membrane type Alfa Laval RO98pHt were used. The main characteristics of membrane used are: polyamide thin-film composite with pH range 2–11, max. pressure 55 bar, max. temperature 60°C and NaCl rejection of >97%. The total filtration surface was 0.1736 m2 (the surface of one membrane was 0.0289 m2). The initial volume of chokeberry juice in all experiments was 4 L. In all experiments juice was concentrated to maximum TSSC (24.9%). Dry matter was determined every 12 minutes on a refractometer (Abbe refractometer, Carl Zeiss, Jena). All measurements were carried out at a room temperature. The experiments were conducted with cooling the retentate via heat exchanger (propylene glycol was used as a refrigerant) and without cooling. The initial temperature of the juice in all experiments was 10°C. RO concentration was conducted at a pressure of 45, 50 and 55 bar.
Reagents and standards
The DPPH (2,2-diphenyl-1-picrylhydrazyl radical), Trolox (6-hydroxy-2,5,7,8-tetramethylchroman-2-carboxylic acid), gallic acid monohydrate, aluminium chloride, chlorogenic acid (3-o-caffeoylquinic acid), quercetin dihydrate, rutin hydrate (quercetin-3-rutinoside hydrate) and catechin were purchased from Sigma-Aldrich (St. Louis, MO, USA); cyanidin-3-O-glucoside chloride (kuromanin chloride) and cyanidin-3-O-galactoside chloride from Extrasynthese (Genay, France); HPLC grade methanol from Merck (Darmstadt, Germany); sodium hydroxide, sodium chloride, sodium nitrite, potassium chloride, hydrochloric acid, sodium bisulfite, sodium acetate, sodium carbonate and Folin-Ciocalteu reagent from Kemika (Zagreb, Croatia).
Aroma analysis
The chokeberry volatile compounds were determined by gas chromatography with mass spectrometry (GC-MS) by a solid-phase microextraction (SPME) method. Samples were prepared as follows: 5 ml of sample was put in a vial with a 1 g of sodium chloride and a small magnetic stir bar and sealed with a crimp cap PTFE/silicone lined. Samples were preheated for 5 min at 40°C and volatiles were collected by SPME for 20 min at 40°C using 65 µm PDMS/ DVB fibre (Supelco Inc., Bellefonte, PA, USA). An analysis was carried out with gas chromatography Agilent 5890 B with a mass detector Agilent 5977 A. The capillary column used in this experiment was CP-WAX 52CB (Agilent, 60 m × 250 µm × 0.25 µm). Helium (He) 5.0 (purity 99.999%; Messer, Austria) was used as a carrier gas. Working conditions were as follows: injector temperature at 250°C; MSD interface temperature 250°C; oven temperature programmed from 40°C (2 min hold) to 230°C (5 min hold) at 6°C min−1; carrier gas (He) at a flow rate of 1 mL min−1 (average velocity 25.502 cm sec−1); injection port operated in splitless mode. Compounds were identified by comparing their mass spectra with the spectral library (Wiley 9, NIST 0.8) and expressed as peak area. Three replicate measurements were performed for each sample.
Total polyphenol content (TPC) determination
The TPC was determined by Folin-Ciocalteu method (Ough & Amerine, Citation1988). Briefly, 1.8 mL of distilled water was added in the test tube with 0.2 mL of juice sample followed by 10 mL of Folin-Ciocalteu reagent (1:10). The reaction solution was left to stand for 5 min. After that time 8 ml of a 7.5% sodium carbonate solution was added. The test tubes were shaken and left in a dark place for 2–20 hours at a room temperature. Absorbance was measured at 765 nm using a spectrophotometer (Note 6300, United Kingdom). Measurements were conducted in triplicate. Total phenol content was determined using a gallic acid calibration curve and the results were expressed as gallic acid equivalent (GAE) per litre of sample (g GAE /L). Calibration curve of the gallic acid was made by diluting it in distilled water to yield 0.1–2 mg/mL.
Total flavonoid content (TFC) determination
The amounts of total flavonoid were determined colorimetrically. A method described by Zhishen, Mengcheng, and Jianming (Citation1999) with slight modifications was used. Properly diluted sample was mixed with 4 mL distilled water in a 10 mL test tube. At the start, aqueous 5% NaNO2 (0.3 mL) was added to the test tube, then at 5 min, 2% AlCl3 (1.5 mL) and at 5 min 1.0 M NaOH (2 mL) were added sequentially. Finally, the volume was brought up to 10 mL by adding more distilled water. The reaction mixture was mixed thoroughly in the flask for homogenisation. The absorbance was noted at 510 nm using a spectrophotometer. Measurements were conducted in triplicate. TFC, calculated using a standard calibration curve, was reported as catechin equivalents (mg CE/mL). Calibration curve of the catechin was made by diluting it in ethanol to yield 0.5–2 mg/100 ml.
Monomeric anthocyanin (MAC) content and polymeric colour determination
The MAC content was estimated by a pH-differential method (Gusti & Wrolstad, Citation2001). Two dilutions of samples were prepared, one with potassium chloride buffer (pH 1.0) (1.86 g KCI in 1 L of distilled water, pH value adjusted to 1.0 with concentrated HCI), and the other with sodium acetate buffer (pH 4.5) (54.43 g CH3CO2Na*3H2O in 1 L of distilled water, pH value adjusted to 4.5 with concentrated HCI). Absorbance was measured simultaneously at 510 and 700 nm after 15 min of incubation at room temperature. The content of MAC was expressed in mg of cyanidin-3-O-glucoside equivalents (CGE) per L of juice using a molar extinction coefficient (e) of cyanidin-3-O-glucoside of 26 900 1 mol−1 cm−1 and molar weight (MW) (449.2 g mol−1).
Colour density, polymeric colour (PC) and percent PC were determined using the bisulphite bleaching method as described by Gusti and Wrolstad (Citation2001). For the analysis, 0.2 ml of sodium bisulfite was added to 2.8 ml diluted sample and 0.2 ml of water was added to 2.8 ml diluted sample. After equilibration for 15 min, samples were evaluated at Aλvis, 700 nm and 420 nm. Colour density was calculated using the control sample according to the following formula: Colour density = [(A420 − A700) + (Aλvis − A700)] × DF. PC was determined using the bisulfite bleached sample using the following formula: PC = [(A420 − A700) + (Aλvis − A700)] × DF. Percent PC was calculated using the formula: % PC = (polymeric colour/colour density) × 100. All measurements were conducted in triplicate.
Assay of 2,2–diphenyl-1-picrylhydrazyl radical scavenging activity
Free radical scavenging activity of the chokeberry juice and observed concentrates were measured by DPPH by using the method of Shimada, Fujikawa, Yahara, and Nakamura (Citation1992) with slight modifications. About 0.2 mL of the sample was diluted with methanol and 1 mL of DPPH solution (0.5 mM) was added. After 15 min, the absorbance was measured at 517 nm. Measurements were done in triplicate. The results were expressed as mmol Trolox equivalents per 100 ml of sample (mmol (Trolox)/100 mL). Calibration curve of the Trolox was made by diluting it in ethanol to yield 0.01–0.1 mmol/100 mL.
HPLC determination of phenolic compounds
Phenolic compounds were identified and quantified using Varian HPLC (high performance liquid chromatography) system consisting of ProStar 230 solvent delivery module, ProStar 330 PDA detector (photodiode array) (Varian, USA), OmniSpher C18 column (250 mm × 4.6 mm inner diameter, 5 µm, Agilent, USA) and guard column (ChromSep 1 cm × 3 mm), (Agilent, USA). The anthocyanin were separated using 0.5% water solution of phosphoric acid as a solvent A and 100% HPLC grade methanol as a solvent B (elution conditions: 0–38 min from 3 to 65% B; from 38–45 min 65% B; flow rate = 1 mL min−1, injection volumes were 20µL). For the phenolic acid and flavonol separation 0.1% water solution of phosphoric acid was used as a solvent A and 100% HPLC grade methanol as a solvent B (elution conditions: 0–30 min from 5 to 80% B; from 30–33 min 80% B; 33–35 min from 80 to 5% B; flow rate = 0.8 mL min−1, injection volumes were 20µL). Validation of used methods was conducted in previous studies by Jakobek, Drenjančević, Jukić, and Šeruga (Citation2012). Prior to injection into the HPLC system, concentrates were diluted to the initial juice TSSC and filtrated. Identification of the phenolic acids and flavonols was conducted by comparing retention times and spectra with those of standard compounds. Quantification was made by using calibration curves of standards. Some compounds were tentatively identified (cyanidin-3-arabinoside, cyanidin-3-xyloside and neochlorogenic acid) comparing with literature data. Anthocyanins were quantified by using cyanidin-3-glucoside and cyanidin-3-galactoside calibration curve, phenolic acids by using chlorogenic acid calibration curve and flavonols by using quercetin-3-rutinoside calibration curve. Standard calibration curves were made by diluting stock standards in HPLC methanol to yield 10–240 mg/L (cyanidin-3-glucoside); 10–242.50 mg/L (cyanidin-3-galactoside); 1–500 mg/L (quercetin-3-rutinoside) and 10–500 mg/L (chlorogenic acid).
Data calculations
The permeate flow (Jv) was measured and expressed as litres per square meter per hour (L/m2 h)
Where Vp is the permeate volume (L), A is the membrane effective area (m2) and t the time (hours) necessary for the production of Vp litres of permeate.
Volume reduction factor (F) was calculated from the following equation:
Where Vf is the volume of the initial feed solution (L), Vr is the volume of the retentate (L).
The equation for retentate concentration index (Irt) is
Where Art is content of dry matter in retentate and Afc is content of dry matter in initial juice (13%).
All measurements were made in duplicate or triplicate and data were expressed as average values. Statistical analysis and data calculations of the mean, standard deviation and level of significance were performed using MS Excel 2013 (Microsoft Corporation, USA). Statistical analysis of the obtained results was performed using one-way analysis of the variance (ANOVA); differences between samples were evaluated by Fisher (LSD) test that showed significant variation (p ˂ 0.05).
Results and discussion
Influence of processing parameters on permeate flow
RO concentration of chokeberry juice at three different pressures (45, 50 and 55 bar) and two temperature regimes (with cooling and without cooling) was conducted. Maximum concentration that could be achieved in all concentration processes was 24.9% (TSSC) which is consistent with literature data (Ganorkar et al., Citation2012; Jiao et al., Citation2004). The initial volume of the feed juice was 4 L. After the RO concentration 1.89 L of concentrate (retentate) and 2.11 L of permeate was obtained in all processes.
and show the data of the influence of volume reduction factor and the retentate concentration index on the permeate flow. From these diagrams, it can be seen that with an increase of the TSSC in the retentate (increase of the volume reduction factor and the retentate concentration index) the permeate flow was proportionally reduced. This is in accordance with Gurak et al. (Citation2010) which found that the permeate flow decreased during the concentration of grape juice with the same membrane. Several other authors gave the same conclusion (Jesus et al., Citation2007; Pap et al., Citation2009). This is a classical behaviour that can be attributed to the polarisation concentration on the membrane surface, fouling phenomena and increases in the osmotic pressure and viscosity of the juice due to soluble solids concentration (Gurak et al., Citation2010). The highest permeate flow was recorded at 55 bar without cooling (21.16–11.42 L/m2 h), and the lowest at 45 bar with cooling (12.09–5.21 L/m2 h). An increase of the pressure from 45 to 55 bar at the same temperature regime leads to a significant increase of the permeate flow ( and ). At all studied pressures (45, 50, and 55 bar), the permeate flow was somewhat lower at process with cooling. Accordingly, at the same pressure, process with cooling lasted longer (). An increment of the pressure from 45 to 55 bar leads to the reduction of the process duration at the same temperature regime (with cooling or without cooling). Process at 55 bar without cooling was significantly shorter (64 minutes) than process at 45 bar without cooling (112 minutes). A previously study conducted by Pozderović, Moslavac, and Pichler (Citation2007) had shown that the type of membrane and processing parameters had significant impact on the permeate flow during RO concentration.
Figure 1. Influence of volume reduction factor on permeate flow in reverse osmosis concentration of chokeberry juice at 45, 50 and 55 bar with and without cooling of the retentate. Abbreviations: 45C (45 bar with cooling); 45WC (45 bar without cooling); 50C (50 bar with cooling); 50WC (50 bar without cooling); 55C (55 bar with cooling) and 55WC (55 bar without cooling).
Figura 1. Influencia del factor reducción de volumen en el flujo de permeación en la concentración de ósmosis inversa del zumo de arándano silvestre a 45, 50 y 55 bares con y sin enfriamiento del retenido. Abreviaturas: 45C (45 bares con enfriamiento); 45WC (45 bares sin enfriamiento); 50C (50 bares con enfriamiento); 50WC (50 bares sin enfriamiento); 55C (55 bares con enfriamiento) y 55WC (55 bares sin enfriamiento).
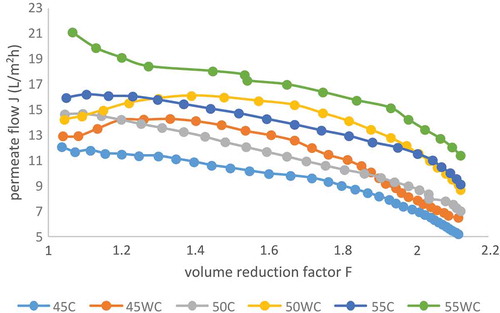
Figure 2. Influence of retentate concentration index on permeate flow in reverse osmosis concentration of chokeberry juice at 45, 50 and 55 bar with and without cooling of the retentate. Abbreviations: 45C (45 bar with cooling); 45WC (45 bar without cooling); 50C (50 bar with cooling); 50WC (50 bar without cooling); 55C (55 bar with cooling) and 55WC (55 bar without cooling).
Figura 2. Influencia del índice de concentración de retenido en el flujo de permeación en la concentración de ósmosis inversa del zumo de arándano silvestre a 45, 50 y 55 bares con y sin enfriamiento del retenido. Abreviaturas: 45C (45 bares con enfriamiento); 45WC (45 bares sin enfriamiento); 50C (50 bares con enfriamiento); 50WC (50 bares sin enfriamiento); 55C (55 bares con enfriamiento) y 55WC (55 bares sin enfriamiento).
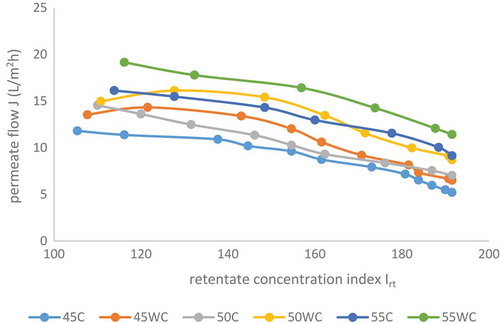
Figure 3. Retentate heating during reverse osmosis concentration at different pressures (45, 50 and 55 bar) with and without cooling. Abbreviations: 45 C (45 bar with cooling); 45WC (45 bar without cooling); 50C (50 bar with cooling); 50WC (50 bar without cooling); 55C (55 bar with cooling) and 55WC (55 bar without cooling).
Figura 3. Calentamiento del retenido durante la concentración de ósmosis inversa a diferentes presiones (45, 50 y 55 bares) con y sin enfriamiento. Abreviaciones: 45C (45 bares con enfriamiento); 45WC (45 bares sin enfriamiento); 50C (50 bares con enfriamiento); 50WC (50 bares sin enfriamiento); 55C (55 bares con enfriamiento) y 55WC (55 bares sin enfriamiento).
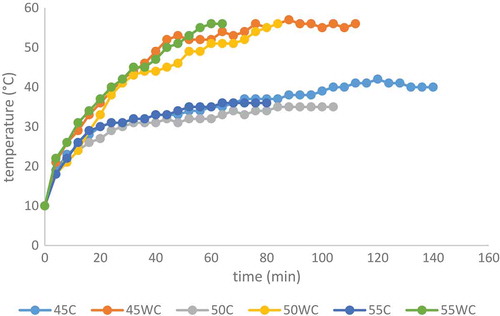
The feed juice temperature in all studied processes was 10°C. The chokeberry juice heats during the RO concentration (). The temperatures at the end of the processes without cooling were remarkably higher (56°C) compared to the processes with cooling (35–40°C) at all tested pressures. A greater amount of heat was developed in processes at higher pressures. The average processing capacity can be increased by temperature rise of feeding juice. Sheu and Wiley (Citation1983) reported that processing capacity can increase 3 to 4% for every 1°C increase in temperature. At higher temperature, the membrane permeability coefficient is higher, the diffusivity coefficient in the solution increases and the viscosity coefficient decreases (Alvarez, Riera, Alvarez, & Coca, Citation1998). Higher temperature can damage the membrane and sensitive valuable components in juice like anthocyanins, so cooling is necessary. For future investigation, we plan to improve cooling system.
Influence of processing parameters on aroma retention
In total, 24 volatile compounds in chokeberry juice and concentrates were identified by using GC-MS and SPME isolation technique. For better display and to make the difference in retaining certain identified volatile compounds, they are divided into five groups (alcohols, acids, carbonyl compounds, esters and terpenoids). shows the individual volatile compounds and their retention time. The initial chokeberry juice contained volatiles () from the group of carbonyl compounds (48.64%), alcohols (26.21%), acids (16.01%), terpenoids (6.51%) and esters (2.63%). β-damascenone and benzaldehyde were the most common amongst carbonyl compounds. Their amount was significantly lower in all concentrates. Because of that concentrates contained approximately 41.12–45.26% alcohols, 27.86–37.07% carbonyl compounds, 11.41–23.96% acids, 6.16–7.15% terpenoids and 0.73–1.78% esters. The most volatiles identified in juice and concentrates are likely enzymatic degradation products of fatty acids: 3-methyl butanol, 3-hexen-1-ol, 2-hexen-1-ol, 2-ethyl hexanol, ethyl octanoate, 2-hexenal, nonanal and hexyl acetate. β-damascenone and 6-methyl-5-hepten-2-one are derivatives of carotenoids produced by enzymatic action (Kraujalyte et al., Citation2013).
Table 1. Volatiles identified in the chokeberry juice and the reverse osmosis concentrates and their retention time.
Tabla 1. Volátiles identificados en el zumo de arándano silvestre y los concentrados de ósmosis inversa además de su tiempo de retención.
Figure 4. Retention of individual group of aromatic compounds: A (alcohols, acids and carbonyl compounds), and B (terpenoids and esters) in initial chokeberry juice and concentrates obtained in reverse osmosis processes at different processing conditions. Abbreviations: 45C (45 bar with cooling); 45WC (45 bar without cooling); 50C (50 bar with cooling); 50WC (50 bar without cooling); 55C (55 bar with cooling) and 55WC (55 bar without cooling).
Figura 4. Retención de un grupo individual de compuestos aromáticos: A (alcoholes, ácidos y compuestos de carbonilo) y B (terpenoides y ésteres) en zumo de arándano silvestre inicial y concentrados obtenidos en los procesos de ósmosis inversa a diferentes condiciones de procesamiento. Abreviaturas: 45C (45 bares con enfriamiento); 45WC (45 bares sin enfriamiento); 50C (50 bares con enfriamiento); 50WC (50 bares sin enfriamiento); 55C (55 bares con enfriamiento) y 55WC (55 bares sin enfriamiento).
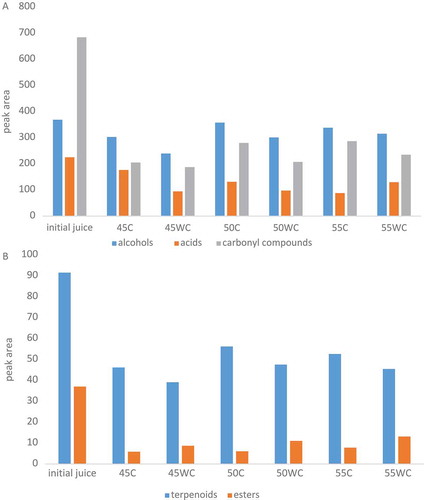
also shows the data of the aroma (expressed by peaks area) retention in juice and concentrates. Processes at a higher pressure and with cooling of the retentate gain the concentrate with greater retention of individual group (except of esters) of volatile compounds. The highest retention of total aroma (59.14% compared to initial juice) was obtained in RO process at 50 bar with cooling. Concentrate from this process retained 97.01% of alcohols, 61.43% terpenoids, 58.42% acids, 40.97% carbonyl compounds and 16.42% esters. The lowest retention was noted at 45 bar without cooling (39.01% of total aroma). Several authors (Konja & Clauss, Citation1991; Sheu & Wiley, Citation1983) achieved high juice aroma retention (88%) and high aroma recovery (86%) when the fruit juice was concentrated by RO. Pozderovic and Moslavac (Citation1999) found that higher retention and aroma recovery in the retentate were achieved at higher processing pressure and lower processing temperature. Among the aroma compounds the esters are the most volatile and therefore their retention is the lowest. Retention of individual components depend on membrane characteristics, processing parameters, their volatility and their activity coefficient (Pozderović et al., Citation2007).
Influence of processing parameters on phenolics and antioxidant activity retention
The TPC determined by Folin-Ciocalteu method, content of flavonoids, anthocyanins, polymeric colour and antioxidant activity are displayed in . Initial chokeberry juice had 4 g/L of TPC. During the concentration procedure their content decreased. The greater retention of polyphenols was observed in processes with cooling. An increase of the process pressure (from 45 to 55 bar) leads to a higher retention of polyphenols, MACs and flavonoids in all concentrates. Mainly, the best process was shown to be at 55 bar with cooling where the retention was the largest in regards to the initial juice content. The content of polyphenols in observed concentrate was 3.87 g GAE/L, anthocyanins 352.3 mg CGE/L, flavonoids 2.27 mg CE/mL and polymeric colour 22.30%. This means that 96.75% of polyphenols, 95.35% of anthocyanins and 90.80% of flavonoids were retained. The MAC depended upon the applied pressure, temperature and duration of processes. Their content in concentrates varied from 270.10 to 352.3 mg CGE/L. The main difference between MAC and the other parameters (TPC, TFC, DPPH) is the process where the lowest content was obtained. The lowest MAC was observed at 50 bar without cooling, whereas at the other parameters at 45 bar without cooling. This is probably due to degradation of anthocyanins by higher pressure and temperature. Gurak et al. (Citation2010) found that at higher RO pressure (60 bar) and lower temperature (20°C) grape juice concentrate had the highest content of phenolics and MACs. PC provides information regarding the percentage of colour represented by polymerised material. Thermal degradation of anthocyanins leads to occurrence of polymeric pigments, especially in the presence of oxygen (Danisman, Arslan, & Toklucu, Citation2015; Poiana, Munteanu, Bordean, Gligor, & Alexa, Citation2013). PC increment in all concentrates corresponded to the decrease of MAC content. It ranged from 22.3 to 37.08% compared with initial juice. Antioxidant activity (DPPH) had a similar trend as previously commented components. It was slightly lower in all observed RO concentrates in regards to the initial chokeberry juice (0.82 mmol (Trolox)/100 ml). Higher retention of antioxidant activity was determined in processes at higher pressures and with cooling of the retentate. There was no statistically significant difference in antioxidant activity between concentrates at 50 and 55 bar with cooling (0.79 mmol (Trolox)/100 ml) and concentrates at 50 and 55 bar without cooling (0.78 mmol (Trolox)/100 ml).
Table 2. Total polyphenol content (TPC), monomeric anthocyanins content (MAC), polymeric colour (PC), total flavonoid content (TFC) and antioxidant activity (DPPH) in the initial chokeberry juice and the reverse osmosis concentrates1,2,3.
Tabla 2. Contenido total de polifenoles (TPC), contenido de antocianinas monómeras (MAC), color polimérico (PC), contenido total de flavonoides (TFC) y actividad antioxidante (DPPH) en el zumo de arándano silvestre inicial y las concentraciones de ósmosis inversa 1,2,3.
Individual phenolic compounds were identified by using HPLC with PDA detection (). Four anthocyanins (cyanidin-3-galactoside, cyanidin-3-glucoside, cyanidin-3-arabinoside and cyanidin-3-xyloside), two phenolic acids (chlorogenic and neochlorogenic acid) and two flavonols (quercetin and quercetin-3-rutinoside) were found in chokeberry juice and concentrates. They are characteristics for chokeberry (Braunlich et al., Citation2013; Jakobek et al., Citation2012; Mayer-Miebach, Adamiuk, & Behsnilian, Citation2012; Oszmianski & Wojdylo, Citation2005). Quercetin-3-rutinoside was the main flavonol found in chokeberry juice (107.13 mg/L) and concentrates (86.37–97.69 mg/L). In concentrates quercetin was found below the quantification threshold. The initial juice contained it 0.27 mg/L. Chlorogenic acid was found between 318.19 and 352.34 mg/L in concentrates and 370.06 mg/L in juice. The content of neochlorogenic acid was a bit higher (334.52–422.32 mg/L in concentrates and 426.57 mg/L in juice). Cyanidin-3-galactoside and cyanidin-3-arabinoside were the main anthocyanins in juice and in all concentrates. Typical HPLC-PDA chromatograms of chokeberry concentrate, at 55 bar with cooling, recorded at 520 nm and 320 nm are presented in . The greatest retention of total and individual anthocyanins was observed at 45 (316.5 mg/L) and 55 (316.27 mg/L) bar with cooling. There was no statistically significant difference between them. Cyanidin-3-arabinoside, cyanidin-3-glucoside and cyanidin-3-xyloside retained higher at 45 than at 55 bar with cooling. The pressure also influenced the degradation of anthocyanins. The effect of pressure at 55 bar was probably minimised by the short duration of process, due to high permeate flow, and low temperature. That kind of effect was not obtained with phenolic acids and flavonols. Concentrate gain at 55 bar with cooling retained them significantly higher than in other processes.
Table 3. Contents of individual phenolic compounds in the initial chokeberry juice and the reverse osmosis concentrates.1,2,3
Tabla 3. Contenido de compuestos fenólicos individuales en el zumo de arándano silvestre inicial y los concentrados de ósmosis inversa.1,2,3
Figure 5. Typical HPLC-PDA chromatograms shown at 520 nm and 320 nm obtained from chokeberry concentrate obtained at reverse osmosis at 55 bar with cooling. Peak assignment: (1) cyanidin-3-galactoside, (2) cyanidin-3-glucoside, (3) cyanidin-3-arabinoside, (4) cyanidin-3-xyloside, (5) neochlorogenic acid, (6) chlorogenic acid, and (7) quercetin-3-rutinoside.
Figura 5. Cromogramas típicos HPLC-PDA a 520 nm y 320 nm obtenidos del concentrado de arándano silvestre obtenido con una ósmosis inversa a 55 bares con enfriamiento. Prueba pico: (1) cianidina-3-galactosido, (2) cianidina-3-glucósido, (3) cianidina-3-arabinósido, (4) cianidina-3-xilosido, (5) ácido neoclorogénico, (6) ácido clorogénico y (7) quercetin-3-rutinósido.
In all processes with cooling the content of individual phenolic were higher than in those without cooling, at the same pressure, respectively. In earlier study it was also found that temperature was one of the parameters that influenced the anthocyanin degradation (Wilkes, Howard, Brownmiller, & Prior, Citation2014).
Overall, retention of individual and total phenolic compounds was greater in all processes with cooling than in those without cooling. Due to higher retention of phenolic acids and flavonols at 55 bar with cooling, that process was the best in terms of total phenolic retention in comparison to the initial juice. It retained 84.78% of total anthocyanins and 96.73% of total phenolic acids and flavonols.
Conclusions
RO concentration at different processing conditions was found to be a good procedure for concentration with high retention of phenolic and aromatic compounds characteristics for chokeberry. Processing parameters (pressure, temperature, time) had a significant influence on permeate flow and retention of phenolic and volatile compounds. Permeate flow was higher at higher applied pressures at the same temperature regime. Cooling of the retentate and TSSC increment during processes led to the permeate flow decrease. The greatest retention of aroma was observed in concentrate gain at 50 bar with cooling. Process at 55 bar with cooling was found to be the best in terms of antioxidant activity and total phenolic compounds retention.
Disclosure statement
No potential conflict of interest was reported by the authors.
References
- Alvarez, S., Riera, F. A., Alvarez, R., & Coca, J. (1998). Permeation of apple aroma compounds in reverse osmosis. Separation & Purification Technology, 14, 209–220. doi:10.1016/S1383-5866(98)00076-8
- Bermudez-Soto, M. J., Larrosa, M., Garcia-Cantalejo, J., Espin, J. C., Tomas-Barberan, F. A., & Garcia-Conesa, M. T. (2007). Transcriptional changes in human caco-2 colon cancer cells following exposure to a recurrent non-toxic dose of polyphenol-rich chokeberry juice. Genes & Nutrition, 2, 111–113. doi:10.1007/s12263-007-0026-5
- Braunlich, M., Slimestad, R., Wangensteen, H., Brede, C., Malterud, K. E., & Barsett, H. (2013). Extracts, anthocyanins and procyanidins from aronia melanocarpa as radical scavengers and enzyme inhibitors. Nutrients, 5, 663–678. doi:10.3390/nu5030663
- Couto, D. S., Cabral, L. C. M., Matta, V. M., Deliza, R., & Castro Freitas, D. G. (2011). Concentration of pineapple juice by reverse osmosis: Physicochemical characteristics and consumer acceptance. Food Science and Technology (Campinas), 31, 905–910. doi:10.1590/S0101-20612011000400012
- Danisman, G., Arslan, E., & Toklucu, A. K. (2015). Kinetic analysis of anthocyanin degradation and polymeric colour formation in grape juice during heating. Czech Journal of Food Science, 33(2), 103–108. doi:10.17221/446/2014-CJFS
- Ganorkar, P., Nandane, A., & Tapre, A. (2012). Reverse osmosis for fruit juice concentration – a review. Research & Reviews: Journal of Food Science and Technology, 1(1), 23–36. Retrieved from http://stmjournals.com/sci/index.php?journal=RRJoFST
- Gurak, P. D., Cabral, L. M. C., Rocha-Leão, M. H. M., Matta, V. M., & Freitas, S. P. (2010). Quality evaluation of grape juice concentrated by reverse osmosis. Journal of Food Engineering, 96, 421–426. doi:10.1016/j.jfoodeng.2009.08.024
- Gusti, M. M., & Wrolstad, R. E. (2001). Characterization and measurement of anthocyanins by UV-visible spectroscopy. In R. E. Wrolstad (Ed.),Current protocols in food analytical chemistry (F1.2.3-F.1.2.13.). New York, NY: John Wiley & Sons.
- Jakobek, L., Drenjančević, M., Jukić, V., & Šeruga, M. (2012). Phenolic acids, flavonols, anthocyanins and antiradical activity of Nero, Viking, Galicianka and wild chokeberries. Scientia Horticulturae, 147, 56–63. doi:10.1016/j.scienta.2012.09.006
- Jakobek, L., Šeruga, M., Novak, I., & Medvidović-Kosanović, M. (2007). Anthocyanin content and antioxidant activity of various red fruit juices. Deutsch Lebensmittel – Rundschau, 103, 58–64. Retrieved from http://www.dlr-online.de/
- Jesus, D. F., Leite, M. F., Silva, L. F. M., Modesta, R. D., Matta, V. M., & Cabral, L. M. C. (2007). Orange (Citrus sinensis) juice concentration by reverse osmosis. Journal of Food Engineering, 81, 287–291. doi:10.1016/j.jfoodeng.2006.06.014
- Jiao, B., Cassano, A., & Drioli, E. (2004). Recent advances on membrane processes for the concentration of fruit juices: A review. Journal of Food Engineering, 63, 303–324. doi:10.1016/j.jfoodeng.2003.08.003
- Konja, G., & Clauss, E. (1991). Study of color and aroma retention of black currant juice during concentration by hyperfiltration. Prehrambeno-Tehnološka I Biotehnološka Revija, 29, 121–125. .
- Kraujalyte, V., Leitner, E., & Venskutonis, P. R. (2013). Characterization of Aronia melanocarpa volatiles by headspace-solid-phase microextraction (HS-SPME), simultaneous distillation/extraction (SDE), and gas chromatography-olfactometry (GC-O) methods. Journal of Agricultural and Food Chemistry, 61(20), 4728–4736. doi:10.1021/jf400152x
- Kulling, S. E., & Rawel, H. M. (2008). Chokeberry (Aronia melanocarpa) – a review on the characteristic components and potential health effects. Planta Medica, 74, 1625–1634. doi:10.1055/s-0028-1088306
- Matsumoto, M., Hara, H., Chiji, H., & Kasai, T. (2004). Gastroprotective effect of red pigments in black chokeberry fruit (Aronia melanocarpa Elliot) on acute gastric hemorrhagic lesions in rats. Journal of Agricultural and Food Chemistry, 52, 2226–2229. doi:10.1021/jf034818q
- Mayer-Miebach, E., Adamiuk, M., & Behsnilian, D. (2012). Stability of chokeberry bioactive polyphenols during juice processing and stabilization of a polyphenol-rich material from the by-product. Agriculture, 2(4), 244–258. doi:10.3390/agriculture2030244
- Oszmianski, J., & Wojdylo, A. (2005). Aronia melanocarpa phenolics and their antioxidant activity. European Food Research and Technology, 221(6), 809–813. doi:10.1007/s00217-005-0002-5
- Ough, C. S., & Amerine, M. A. (Eds.). (1988). Phenolic compounds. In Methods for Analysis of Musts and Wines (pp. 196–221). New York, NY: John Wiley & Sons.
- Pap, N., Kertesz, S., Pongracz, E., Myllykoski, L., Keiski, R. L., Vatai, G., & Hodur, C. (2009). Concentration of blackcurrant juice by reverse osmosis. Desalination, 241, 256–264. doi:10.1016/j.desal.2008.01.069
- Poiana, M.-A., Munteanu, M.-F., Bordean, D.-M., Gligor, R., & Alexa, E. (2013). Assessing the effects of different pectins addition on color quality and antioxidant properties of blackberry jam. Chemistry Central Journal, 121(7), 1–13. doi:10.1186/1752-153X-7-121
- Pozderovic, A., & Moslavac, T. (1999). Apple juice aroma concentration from evaporator condensate by reverse osmosis – I. Influence of process parameters on retention and final aroma concentration. Acta Alimentaria, 28(1), 71–83, SICI:0139-3006(199903)28:1<71:AJACFE>2.0.ZU;2-A.
- Pozderović, A., Moslavac, T., & Pichler, A. (2007). Influence of processing parameters and membrane type on permeate flux during solution concentration of different alcohols, esters, and aldehydes by reverse osmosis. Journal of Food Engineering, 78, 1092–1102. doi:10.1016/j.jfoodeng.2005.12.039
- Sharif, T., Alhosin, M., Auger, C., Minker, C., Kim, J. H., Etienne-Selloum, N., & Schini-Kerth, V. B. (2012). Aronia melanocarpa juice induces a redox-sensitive p73-related caspase 3-dependent apoptosis in human leukemia cells. PLoS ONE, 7(e32526). doi:10.1371/journal.pone.0032526
- Sheu, M. J., & Wiley, R. C. (1983). Preconcentration of apple juice by reverse osmosis. Journal of Food Science, 48, 422–429. doi:10.1111/j.1365-2621.1983.tb10757.x
- Shimada, K., Fujikawa, K., Yahara, K., & Nakamura, T. (1992). Antioxidative properties of xanthan on the autoxidation of soybean oil in cyclodextrin emulsion. Journal of Agricultural and Food Chemistry, 40, 945–948. Retrieved from http://pubs.acs.org/journal/jafcau
- Wilkes, K., Howard, L. R., Brownmiller, C., & Prior, R. L. (2014). Changes in chokeberry (Aronia melanocarpa L.) polyphenols during juice processing and storage. Journal of Agricultural and Food Chemistry, 62, 4018−4025. doi:10.1021/jf404281n
- Zhishen, J., Mengcheng, T., & Jianming, J. (1999). The determination of flavonoid contents in mulberry and their scavenging effects on superoxide radicals. Food Chemistry, 64, 555–559. doi:10.1016/S0308-8146(98)00102-2