
 ?Mathematical formulae have been encoded as MathML and are displayed in this HTML version using MathJax in order to improve their display. Uncheck the box to turn MathJax off. This feature requires Javascript. Click on a formula to zoom.
ABSTRACT
In this paper, the effects of ultrasonic treatment on the particle size distribution and rheological properties of red wine were investigated to explore the insight changing mechanism of organoleptic attributes. The results indicate that ultrasound irradiation did affect the particle size distribution by increasing the intervals of particle size distribution, which, especially for the larger particles, would strengthen the tyndall effect of wine, resulting in the wine’s visual effect in a goblet more bright and full of flavor. Moreover, the changes in wine’s rheological properties mediated by ultrasound could also be fitted by the models of Power-law and Casson, which might explain the taste changes of wine induced by ultrasound. In conclusion, some of the wine’s sensory properties can be modified by the ultrasound irradiation, which greatly contributes to the feasible explanation of the ultrasound’s application in wine-making.
RESUMEN
el presente estudio investigó los efectos que conlleva el tratamiento ultrasónico en la distribución de tamaño de las partículas y las propiedades reológicas del vino tinto, con el propósito de analizar los cambios en la percepción de sus atributos organolépticos. Los resultados dan cuenta de que la irradiación con ultrasonido afectó la distribución de tamaño de las partículas, aumentando los intervalos de distribución de dicho tamaño; especialmente en el caso de las partículas más grandes, esto fortalece el efecto Tyndall del vino, lo que implica que su impacto visual en una copa sea más brillante y su sabor más completo. Por otra parte, los modelos de Power-law y Casson pueden ajustar los cambios en las propiedades reológicas del vino mediadas por ultrasonido, lo que podría explicar los cambios inducidos por éste en el sabor del vino. En conclusión, algunas de las propiedades sensoriales del vino pueden modificarse a través de la irradiación con ultrasonido, lo que en gran medida constituye una explicación viable de cómo puede aplicarse el ultrasonido en su elaboración.
1. Introduction
Ultrasound is an important non-thermal processing technology widely employed in the food industry (Ulusoy, Colak, & Hampikyan, Citation2007). Especially in the field of wine-making, ultrasound has been regarded as one of the most promising and widely studied techniques to accelerate the wine aging (Chemat et al., Citation2011; García Martín, et al., Citation2013; García Martín, Zhang, & Feng, Citation2016), and its modifications on wine are mainly attributed to the physical effects (mechanical and micro-mechanical) and/or chemical effects like the free radicals of ˙H and ˙OH generated from the decomposition of the water inside the oscillating bubbles (Simunek, Jambrak, Dobrović, Herceg, & Vukušić, Citation2014; Tao, García Martín, & Sun, Citation2014). Many literatures have been reported about the application of ultrasound in modifying the wine quality (Chang, Citation2005; García Martín et al., Citation2013; Russell et al., Citation2018). Recently, a series of works has also been conducted by our group about the effects of ultrasound irradiation on the physicochemical properties of wine, including the pH, titratable acidity, electric conductivity, DPPH· free radical scavenging activity and phenolic compounds (García Martín et al., Citation2016; Zhang, Shen, Fan, & García Martín, Citation2016). Interestingly, the continuous monitoring of the wine’s electric conductivity demonstrated that the ultrasound irradiation had a particular changing type (sharp increasing, then stable and rapid decreasing) during the whole processing (Yan et al., Citation2017; Zhang, Shen, Fan, Yan, & García Martín, Citation2015). Regarding the color related to phenolics, Zhang and Wang (Citation2017) investigated the effects of ultrasound irradiation on the evolution of color properties and major phenolic compounds during the wine storage, results indicating that ultrasound not only has the temporary effect but also has a long time effect on the color evolution. In order to explore the influencing mechanisms, the changing of the components in wine and their interactions were also studied under the ultrasound irradiation (Zhang, Fu, & García Martín, Citation2017; Zhang, Shen, Fan, Shen, et al., Citation2015). All these results suggest that ultrasound irradiation definitely modifies some of the properties about the red wine. Unfortunately, these studies were mainly centered on the changes of chemical compounds in the red wine.
As a sensory characteristic, mouthfeel plays an important role in the enjoyment of drink for consumers (Sáenz-Navajas, Campo, Fernández-Zurbano, Valentin, & Ferreira, Citation2010; Zheng, Zhang, Fang, & Liu, Citation2014), which means that the mouthfeel is a key index to evaluate a product’s processing or development. Regarding the wine, previous studies have reported that its organoleptic attributes could be modified by the ultrasound irradiation to a certain extent (García Martín & Sun, Citation2013). Furthermore, a significant correlation was also reported between the osmolality of wine and its viscosity (Košmerl, Abramovič, & Klofutar, Citation2000). That is to say, the rheological properties like the viscosity possibly contribute to the wine’s mouthfeel/sensorial characteristics. However, to the best of our knowledge, little information was reported about the effect of ultrasound irradiation on the rheological properties of wine, i.e., how did the ultrasound influence the wine’s rheological properties, consequently resulting in the modification of sensory characteristics. In this paper, the effects of ultrasonic treatment on the particle size distributions and rheological properties of the red wine were investigated so as to understand the insight changing mechanism of wine organoleptic attributes exposed to ultrasound.
2. Materials and methods
2.1. Materials
The sample of red wine (made from the grape variety of Cabernet Sauvignon, harvested in 2012) was provided by the DanFeng Winery (Shaanxi Province, China) and used throughout this research.
2.2. Ultrasound treatment on the wine samples
Ultrasonic treatments were carried out in an ultrasonic bath (KQ-300VDE, Kunshan Ultrasonic Equipment Co. Ltd., Jiangsu Province, China), which can work at three frequencies (45, 80 and 100 kHz) and a variable power output from 120 to 300 W. Ultrasonic energy can be delivered from the bottom to the water in the tank by the six annealed transducers, and the total rated output power is 300 W. For each experiment set, 100 mL of red wine was placed in a 250 mL bottle with grinding plug, then the bottle with red wine sealed by parafilm was fixed in the same position of the ultrasound bath for the treatment. The ultrasound’s effects on the rheological properties were investigated with the following variables by using one factor experiment design including the ultrasonic power (120, 150, 180, 210, 240, 270 and 300 W), while the other working conditions were fixed at the ultrasound frequency of 100 kHz, 20 min and 20°C; ultrasonic frequency (45, 80 and 100 kHz), while the other working conditions were fixed at the ultrasound power of 300 W, 20 min and 20°C; temperature (20°C, 30°C, 40°C, 50°C, and 60°C), while the other working conditions were fixed at the ultrasound frequency of 100 kHz, 300 W, and 20 min; and time (20, 40, 60, 80 and 100 min), while the other working conditions were fixed at the ultrasound frequency of 100 kHz, 300 W and 20°C, respectively.
2.3. Particle size distribution of red wine treated by ultrasound
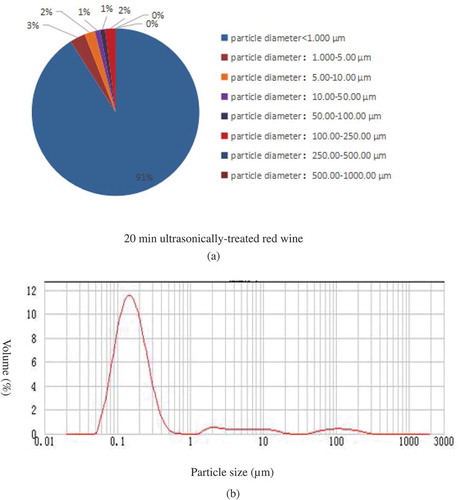
In order to accurately dilute the prepared wine sample to a concentration of 1/1000, it was tested by the method described in the references (Hennock, Rahalkar, & Richmond., Citation2010; Schokker et al., Citation1998). The measurement was conducted by the laser particle analyzer (Mastersizer 2000 Type, British Malvern Scientific Experiment Instrument Company), and the parameters were set as follows: normal analysis mode, the sample syringe of Hydro2000MU (British Malvern Scientific Experiment Instrument Company), sample refractive index of 1.370 by abbe refractometer, 0.001 of particle absorption rate, and dispersant of water with a refractive index of 1.330.
All injected samples were automatically tested by the system at the set intervals. The instrument automatically stops working when the standard deviation of the last three tests is within the acceptable range of the instrument. After the test, data is output on the particle size distribution.
2.4. Determination of the rheological properties of red wines irradiated by ultrasound
The rheological characteristics of each sample were measured using a 40 mm plate at a shear rate from 10 to 1000 s−1, a probe of φ25, and a distance of 1 mm between the sample and an AR-G2 rheometer (TA Instrument Company, American). A linear regression is then performed based on the rheological model to obtain the parameters of the rheological property.
2.5. Data fitting by the power–law model for red wines
Drawing a graph of τ versus γ, and linearizing the curve to get the values for K and n. The power law model (Andersson, Aarseth, Braud, & Dandapat, Citation1996; Liu, Liu, Shu, & Xie, Citation2003) has the equation as:
where τ is the shear stress with the unit of Pa, γ is the shear rate with the unit of 1/s or s−1, n and K are the rheological constant and the concentration factor, respectively.
2.6. Data fitting by the casson equation model for wines
In order to draw an objection graph and linearly regress the curve with intercept τo and slope K, the rheological parameter of τo can be obtained. The Casson model (Mernone, Mazumdar, & Lucas, Citation2002; Mustafa, Hayat, Ioan, & Hendi, Citation2012) is defined as:
where τ is the shear stress with the unit of Pa,τo is the yield stress (Pa), γ is the shear rate (1/s ors−1), and K is the coefficient of consistency, respectively.
3. Results and discussion
3.1. Effects of ultrasound frequency, power, temperature and exposure time on the particle size distribution of red wine
3.1.1. Effects of ultrasound frequency on the particle size distribution of red wine
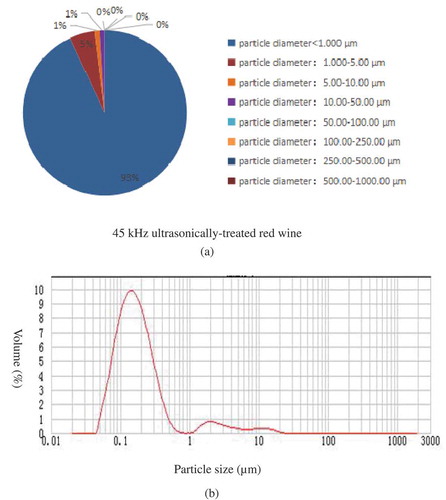
The particle size distribution of non-ultrasonically treated wine is shown in . In comparison, indicates that ultrasound frequency does affect the particle size distribution of red wines, and this variation of the particle size might be attributed to the physical and chemical effects of ultrasound irradiation (Franco, Pérez-Maqueda, & Pérez-Rodrı́Guez, Citation2004). Obviously, there are four intervals occurring in the particle size distribution of the non-ultrasonically treated red wines, i.e., smaller than 1.000 μm, 1.000 μm-5.00 μm, 5.00 μm-10.00 μm and 10.00 μm-50.00 μm. shows that the proportion of particle size smaller than 1.000 μm increased in the ultrasonically treated wine at the frequency of 45 kHz, while the other proportions slightly decreased. Regarding the treatment of 80 kHz, the particle size intervals of red wine demonstrated that it not only had the intervals of being smaller than 1.000 μm, 1.000 μm-5.00 μm, 5.00 μm-10.00 μm, and 10.00 μm-50.00 μm but also added an interval of 50.00 μm-100.00 μm. Apart from this interval addition of 50.00 μm-100.00 μm, the particle size intervals of red wine treated by 100 kHz also added another interval of 100.00 μm-250.00 μm as shown in . On the whole, the particle sizes distribution changed wider with the increase of frequency, and some larger particle size intervals came out, interestingly, which is different from our intuitive expectation. Generally, the large particles are thought to be sheared into smaller ones under the action of ultrasound irradiation, due to their more sensitivity to the higher frequency. Additionally, the mass transfer effect of ultrasound might accelerate the larger particles broken down into smaller ones through the intermolecular forces instead of the forces from chemical bonds.
Table 1. Effects of ultrasound frequency, power, temperature, exposure time on the particle size distribution of red wine.
Tabla 1. Efectos de la frecuencia, potencia, temperatura y tiempo de exposición de ultrasonido en la distribución de tamaño de las partículas en el vino tinto.
Figure 1. Effect of untreated on the particle size distribution of red wine.
Figura 1. Efecto en la distribución de tamaño de las partículas en el vino tinto sin tratamiento.
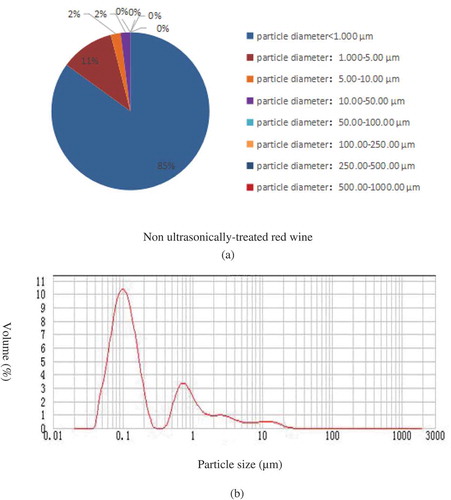
Figure 2. Effect of ultrasonic frequency on the particle size distribution of red wine.
Figura 2. Efecto de la frecuencia ultrasónica en la distribución de tamaño de las partículas en el vino tinto.
As regards to the fact that some larger particle size intervals were interestingly found at higher frequencies, the reasons remain unknown. Generally, for a certain frequency range, the lower frequency has a stronger mass transfer or physical effect, while the higher frequency has a strong chemical effect, which can induce more free radicals generated, resulting in a series of free radicals chain reaction among the components in wine (Zhang, Shen, Fan, Shen, et al., Citation2015). For example, the polymerization between the flavan-3-ols and the anthocyanins may produce larger particles, which might explain the reason why the intervals of the particle size distribution will also happen with increasing of frequency. Apart from this kind of polymerization, some smaller molecules like catechin can also form some larger molecules including xanthylium cation pigments under the irradiation of ultrasound (Fu, Zhang, Zhang, & Liu, Citation2018). In a word, the reasons should be further investigated for the increased wider intervals of the particle sizes distribution (especially for the occurring of larger particle sizes) after the wine being treated by ultrasound with higher frequency.
3.1.2. Effects of ultrasound power on the particle size distribution of red wine
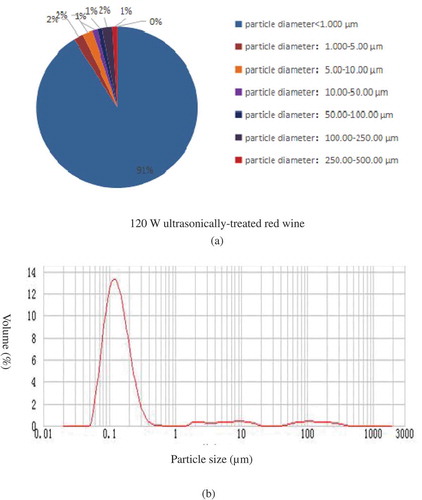
and also show that ultrasound irradiation power influences the particle size distribution of red wine. To be specific, the ratio of particle size less than 1.000 μm decreased from 92.80% to 90.50%, when the wine was ultrasonically irradiated with the power from 120 to 300 W. Similarly, the ratio of particle size in wine (5.00 μm-10.00 μm) also reduced from 2.03% at 120 W to 1.59% at 300 W. Interestingly, the proportions (10.00 μm-50.00 μm) increased from 0.81% to 1.20% with the variation of ultrasound power from 120 W to 300 W. In general, as the ultrasonic power increased, the total amounts of particles smaller than 100.00 μm changed greatly. The particles within this range have a colloidal nature, related to the rheological properties of wine, which may explain the reason why the ultrasound irradiation can influence the dispersion or rheological properties of the red wine. The erratic variations of particle size distribution indicate that the ultrasound irradiation may disturb the original distribution of particles and make the particles distribution more uniform in the system. With the increase of the ultrasound power, the power intensity delivered from the ultrasound is also raised in a fixed volume and the effects also become obvious (Gogate et al., Citation2004). Generally, the greater the power intensity of the ultrasound in an aqueous solution, the greater the pressure and the higher the temperature generated when the bubbles ruptured, and finally the more physical and chemical modifications on the red wine (Zhang, Shen, Fan, Shen, et al., Citation2015).
Figure 3. Effect of ultrasonic power on the particle size distribution of red wine.
Figura 3. Efecto de la potencia ultrasónica en la distribución de tamaño de las partículas en el vino tinto.
3.1.3. Effects of ultrasound temperature on the particle size distribution of red wine
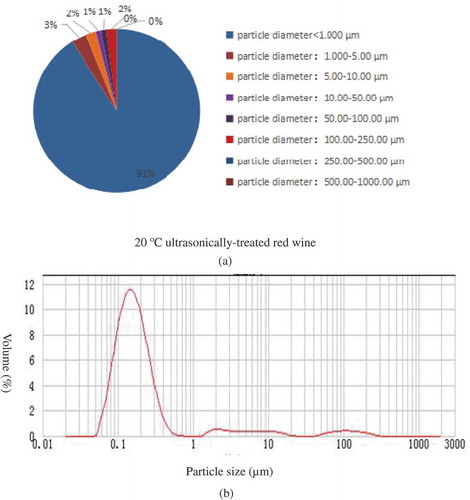
As shown in and , with the increase of ultrasound irradiation temperature from 20°C to 50°C, the particle size distribution of the red wine changed a little, while the particle size distribution showed a significant change at the temperature of 60°C. In general, the particle size distributions were all within the colloidal particle size range, and the particle sizes did not exceed 100.00 μm, which is similar to the 80 kHz ultrasonically treated red wine samples. The results suggest that the acoustic efficiency decreased at the temperature of 60°C, which is in accordance with the references (Löning, Horst, & Hoffmann, Citation2002; Thompson et al., Citation1999), i.e., the efficiency of the ultrasound irradiation decreases sharply with the increase of temperature.
Figure 4. Effect of ultrasonic temperature on the particle size distribution of red wine.
Figura 4. Efecto de la temperatura ultrasónica en la distribución de tamaño de las partículas en el vino tinto.
3.1.4. Effects of ultrasound exposure time on the particle size distribution of red wine
As shown in and , when the ultrasound exposure time was 20 min, the particle size distributions of the wine were as follows: less than 1.000 μm, 1.000 μm-5.00 μm, 5.00 μm-10.00 μm, 10.00 μm-50.00 μm, 50.00 μm-100.00 μm and 100.00 μm-250.00 μm, respectively. When the exposure time was 40 min and 60 min, only four intervals of the particle size distributions could be determined: less than 1.000 μm, 1.000 μm-5.00 μm, 5.00 μm-10.00 μm, and 10.00 μm-50.00 μm. To the wine exposed to ultrasound for 40 min, the proportions of the particle sizes in the four intervals were 86.39%, 9.84%, 1.53%, and 1.95%, respectively. Regarding wine with 60 min of ultrasound exposure time, the particle size ratios among the four intervals were 87.58%, 9.28%, 1.50%, and 1.65%, respectively. Generally, the longer the exposure time, the greater the chemical effects from the ultrasonically induced free radicals and the stronger the ultrasonic shearing forces. With these effects, the formation and recombination of larger particles would be separated again and dissolved, resulting in the variations of particle size distribution, which is also in accordance with other researchers’ reports (Wan, Zheng, Lin, Guo, & Kou, Citation2010). The results suggest that it needs the right time to speed up the aging of the wine or modify the wine property; otherwise, the opposite will happen.
Figure 5. Effect of exposure time on the particle size distribution of red wine.
Figura 5. Efecto del tiempo de exposición en la distribución de tamaño de las partículas en el vino tinto.
3.2. Rheological curves of the sonicated or non-treated red wines
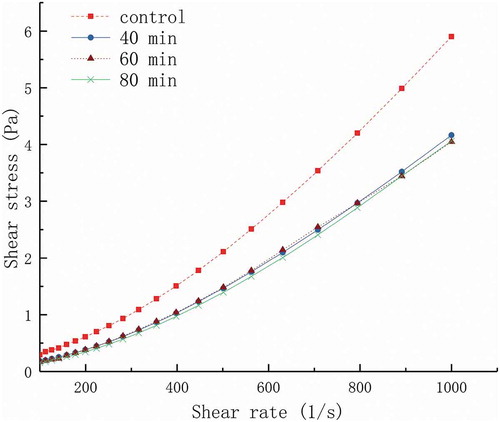
As shown in –, the rheological properties of the red wine were indeed influenced by the different ultrasound irradiation conditions like ultrasound frequency, power, temperature and exposure time. As can be seen in –, there was no obvious linear correlation between the shear stress and the shear rate for each sample under the ultrasound irradiation, which can be deduced that the red wine is not a Newtonian fluid whether it is ultrasonically treated or not. So the determination of the rheological type for the sonicated or non-sonicated red wine needs to be conducted and fitted through a rheological mathematical model in the following sections.
Figure 6. Rheological curves of sonicated red wine at different ultrasound frequency.
Figura 6. Curvas reológicas de vino tinto sometido a sonicación a diferentes frecuencias de ultrasonido.
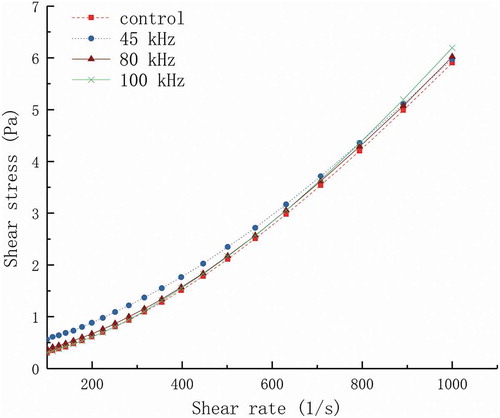
Figure 7. Rheological curves of sonicated red wine at different ultrasound temperature.
Figura 7. Curvas reológicas de vino tinto sometido a sonicación a diferentes temperaturas de ultrasonido.
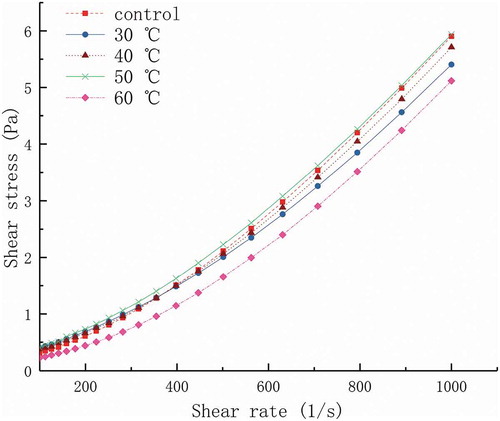
Figure 8. Rheological curves of sonicated red wine at different ultrasound power.
Figura 8. Curvas reológicas de vino tinto sometido a sonicación a diferentes potencias de ultrasonido.
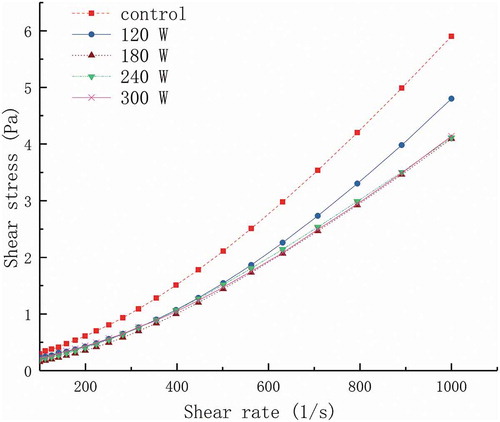
Figure 9. Rheological curves of sonicated red wine at different treatment time.
Figura 9. Curvas reológicas de vino tinto sometido a sonicación a diferentes tiempos de tratamiento.
3.3. Determination of rheological types for the ultrasonically- or non-treated red wines and the fittings of the rheological curves with the power law model
In general, the rheological type can be determined through fitting the calculated results with the power law equation of Equation (1). According to the principles, if the rheological constant of n is more than 1, the rheology type of the sample will be regarded as an expanding fluid, and if n < 1, a pseudoplastic fluid will be decided for the rheology type, and if n = 1, the rheology type is a Newtonian fluid.
As shown in , the rheological data of the wines highly fitted with the power law equation, and the average value of R2 is greater than 0.9850 (maximum value 0.9983, minimum value 0.9732) and all the rheological constants of n are greater than 1, indicating that the red wines ultrasonically- or non-treated are all expansion fluids. That is to say, although ultrasound irradiation can change the constant of the rheological properties, but not the rheological type of the red wine.
Table 2. Fitting results of the rheological curves to the power law model for the red wines.
Tabla 2. Ajuste de los resultados de las curvas reológicas al modelo de ley potencial para los vinos tintos.
Regarding the ultrasound irradiation time, it can be seen that the values of n reflecting the wine’s rheological properties increase with the increasing of exposure time. In general, the particles dispersed in the wines undergo the complex movements due to the involvements of a number of forces. Once this equilibrium is broken down by some external forces like ultrasound irradiation, the molecular or the surface structure of the particles will appear in different structures under the ultrasonic oscillation, and the wine’s colloidal property will be changed, resulting in the variation of the wine’s rheological property. Shear stress from ultrasound can also cause the stretching or deformation of the molecules or particles, resulting in changes in rheological properties(Zhang et al., Citation2013)
3.4. Data fittings of rheological properties of wine with the casson model
As mentioned above in the section of 3.3, the power law model can well describe the rheological properties of the non-sonicated and sonicated red wine. In the following section, another non-Newtonian fluid model will be employed to fit the results of the rheological properties of the red wines.
indicates that the rheological properties of all wines ultrasonically- or non-treated could be illustrated by the Casson equation. At the same time, the correlation coefficients of the fitted equations are higher than 0.98. In comparison, both the viscosity coefficient and the yield stress of the sonicated red wines were changed for the red wines irradiated by ultrasound. Furthermore, with the increase of ultrasonic frequency, the viscosity coefficient and the yield stress of red wines were also raised. Regarding the ultrasound power, the viscosity coefficient and the yield stress of red wine firstly decreased, then followed by an increase with the increase of power intensity, and the maximum value was achieved at the power of 300 W. Similarly, the changing trend of the parameters also happened with the increase of ultrasound temperature. The maximum and minimum values were obtained at the temperatures of 30°C and 60°C, respectively. There was a slight difference in the yield stress among the samples treated with the variations of the ultrasonic exposure time, while the wine’s viscosity coefficient gradually declined with the increase of exposure time. With the changes of the yield stress and viscosity coefficients, the legs of the ultrasonically treated red wine could be theoretically enhanced, relating to the improvement of wine quality. Yield stress is considered as a force relative to the torsional force before the fluid flowing driven by the shearing force. When the shear force is less than the yield stress, the fluid will only deform without flowing. That is, the yield stress is the instantaneous viscosity when the flow rate is not exactly zero.
Table 3. Fitting results of the rheological properties of wine with the Casson model.
Tabla 3. Ajuste de los resultados de las propiedades reológicas del vino con el modelo Casson.
In a word, ultrasound irradiation has an obvious impact on the viscosity coefficient and yield stress of the wine. One hand, which might be attributed to the fact that the ultrasonically broken hydrogen bonds among the wine particles changed the originally arranged pattern of the particles. The increase of viscosity coefficient of the red wine might be due to the broken colloidal structure damaged by high power ultrasound irradiation. On the other hand, considering the mass transferring effect, the particles distribution of red wine will get more uniform after ultrasound treatment, that is, the structural changes would lead to the variations of the rheological coefficient of wine. Finally, the local instantaneously high temperature and high pressure from the ultrasound cavitation effect may also lead to the aggregation of molecules, thus affecting the rheological coefficient of wine.
4. Conclusion
In summary, as a colloidal solution, the particle size distribution and rheological properties of the wine can be influenced by the ultrasound irradiation, and its efficiency is up to the parameters employed, including ultrasound frequency, intensity, temperature and exposure time. In the meantime, the changes of rheological properties of the wines can also be fitted by the classical Power law and Casson model under the ultrasound irradiation. All these results are mainly attributed to the comprehensive effects, such as the physical shear effect, mass transfer and sonochemical effect on the wines.
Especially, with the increase of the particle distribution to the larger particles range, the Tyndall effect of the wine will get more obvious, making the wine’s visual effect in the cup is more vivid and flavoring. Considering the correlation between the yield stress, viscosity coefficient, and the taste of the red wines, it can conclude that the wine’s sensory properties can be modified by the ultrasound irradiation, which also contributes to the feasible explanation of the ultrasound’s application in accelerating the wine aging process. However, further studies should be investigated about the suitable parameters of the ultrasound’s application in winery.
Disclosure statement
No potential conflict of interest was reported by the authors.
Additional information
Funding
References
- Andersson, H. I., Aarseth, J. B., Braud, N., & Dandapat, B. S. (1996). Flow of a power-law fluid film on an unsteady stretching surface. Journal of non-Newtonian Fluid Mechanics, 62(1), 1–8.
- Chang, A. C. (2005). Study of ultrasonic wave treatments for accelerating the aging process in a rice alcoholic beverage. Food Chemistry, 92(2), 337–342.
- Chemat, F., & Khan, M. K. (2011). Applications of ultrasound in food technology: Processing, preservation and extraction. Ultrasonics Sonochemistry, 18(4), 813–835.
- Franco, F., Pérez-Maqueda, L. A., & Pérez-Rodrı́Guez, J. L. (2004). The effect of ultrasound on the particle size and structural disorder of a well-ordered kaolinite. Journal of Colloid and Interface Science, 274(1), 107–117.
- Fu, X.-Z., Zhang, Q.-A., Zhang, B.-S., & Liu, P. (2018). Effect of ultrasound on the production of xanthylium cation pigments in a model wine. Food Chemistry, 268, 431–440.
- García Martín, J. F., & Sun, D.-W. (2013). Ultrasound and electric fields as novel techniques for assisting the wine ageing process: The state-of-the-art research. Trends in Food Science & Technology, 33(1), 40–53.
- García Martín, J. F., Zhang, Q.-A., & Feng, C.-H. (2016). Ultrasound for accelerating the wine ageing process from physicochemical point of view. In Applications of ultrasound in the beverage industry (pp. 89–110). Nova Science Publishers, Inc.
- Gogate, P. R., & Pandit, A. B. (2004). Sonochemical reactors: Scale up aspects. Ultrasonics Sonochemistry, 11(3–4), 105–117.
- Hennock, M., Rahalkar, R. R., & Richmond., P. (2010). Effect of xanthan gum upon the rheology and stability of oil-water emulsions. Journal of Food Science, 49(5), 1271–1274.
- Košmerl, T., Abramovič, H., & Klofutar, C. (2000). The rheological properties of Slovenian wines. Journal of Food Engineering, 46(3), 165–171.
- Liu, X., Liu, C., Shu, Q., & Xie, Y. (2003). Measuring rheological parameters of power law fluid by funnel viscometer. Natural Gas Industry, 23(4), 47–50.
- Löning, J. M., Horst, C., & Hoffmann, U. (2002). Investigations on the energy conversion in sonochemical processes. Ultrasonics Sonochemistry, 9(3), 169–179.
- Mernone, A. V., Mazumdar, J. N., & Lucas, S. K. (2002). A mathematical study of peristaltic transport of a casson fluid. Mathematical & Computer Modelling, 35(7), 895–912.
- Mustafa, M., Hayat, T., Ioan, P., & Hendi, A. (2012). Stagnation-point flow and heat transfer of a casson fluid towards a stretching sheet. Zeitschrift Für Naturforschung A, 67(1–2), 70–76.
- Russell, I., & Kellershohn, J. (2018). Advances in technology and new product development in the beer, wine, and spirit industry. In S. Panda & P. K. Shetty (Eds.), Innovations in technologies for fermented food and beverage industries. Food microbiology and food safety. Cham: Springer.
- Sáenz-Navajas, M. P., Campo, E., Fernández-Zurbano, P., Valentin, D., & Ferreira, V. (2010). An assessment of the effects of wine volatiles on the perception of taste and astringency in wine. Food Chemistry, 121(4), 1139–1149.
- Schokker, E. P., & Dalgleish, D. G. (1998). The shear-induced destabilization of oil-in-water emulsions using caseinate as emulsifier. Colloids & Surfaces A Physicochemical & Engineering Aspects, 145(1–3), 61–69.
- Simunek, M., Jambrak, A. R., Dobrović, S., Herceg, Z., & Vukušić, T. (2014). Rheological properties of ultrasound treated apple, cranberry and blueberry juice and nectar. Journal of Food Science & Technology, 51(12), 3577–3593.
- Tao, Y., García Martín, J. F., & Sun, D.-W. (2014). Advances in wine aging technologies for enhancing wine quality and accelerating wine aging process. Critical Reviews in Food Science & Nutrition, 54(6), 817–835.
- Thompson, L. H., & Doraiswamy, L. K. (1999). Sonochemistry: Science and engineering. Industrial EngineeringChemical Research, 38(4), 1215–1249.
- Ulusoy, B. H., Colak, H., & Hampikyan, H. (2007). The use of ultrasonic waves in food technology. Research Journal of Biological Sciences, 2(4), 491–497.
- Wan, Z. L., Zheng, H., Lin, J., Guo, Z. Z., & Kou, Z. M. (2010). Study on the artificial aging treatment of low-alcohol sweet orange wine. Modern Food Science & Technology, 26(10), 1127–1129.
- Yan, -Y.-Y., & Zhang, Q.-A. (2017). Ions in wine and their relation to electrical conductivity under ultrasound irradiation. Journal of AOAC International, 100(5), 1516–1523.
- Zhang, L., Ye, X., Ding, T., Sun, X., Xu, Y., & Liu, D. (2013). Ultrasound effects on the degradation kinetics, structure and rheological properties of apple pectin. Ultrasonics Sonochemistry, 20(1), 222–231.
- Zhang, Q.-A., Fu, X.-Z., & García Martín, J. F. (2017). Effect of ultrasound on the interaction between (+)-epicatechin gallate and bovine serum albumin in a model wine. Ultrasonics Sonochemistry, 37, 405–413.
- Zhang, Q.-A., Shen, H., Fan, X.-H., Shen, Y., Wang, X., & Song, Y. (2015). Changes of gallic acid mediated by ultrasound in a model extraction solution. Ultrasonics Sonochemistry, 22, 149–154.
- Zhang, Q.-A., Shen, Y., Fan, X.-H., & García Martín, J. F. (2016). Preliminary study of the effect of ultrasound on physicochemical properties of red wine. CyTA - Journal of Food, 14(1), 55–64.
- Zhang, Q.-A., Shen, Y., Fan, X.-H., Yan, -Y.-Y., & García Martín, J. F. (2015). Online monitoring of electrical conductivity of wine induced by ultrasound. CyTA - Journal of Food, 14(3), 496–501.
- Zhang, Q.-A., & Wang, -T.-T. (2017). Effect of ultrasound irradiation on the evolution of color properties and major phenolic compounds in wine during storage. Food Chemistry, 234, 372–380.
- Zheng, X., Zhang, M., Fang, Z., & Liu, Y. (2014). Effects of low frequency ultrasonic treatment on the maturation of steeped greengage wine. Food Chemistry, 162(11), 264–269.