
 ?Mathematical formulae have been encoded as MathML and are displayed in this HTML version using MathJax in order to improve their display. Uncheck the box to turn MathJax off. This feature requires Javascript. Click on a formula to zoom.
ABSTRACT
Replacing traditional extraction technology with ultrasonic or microwave-assisted extraction has attracted considerable attention. In order to maximize the yield of extracted polyphenolic compounds and antioxidants from Sakiz artichoke by-products, a central composite design (CCD) was applied to optimize the microwave-assisted extraction (MAE) in the current study. The study found that the optimal conditions for MAE of Sakiz artichoke by-products were: extraction time 6 min; ethanol/water ratio 50:50 (v/v); (ethanol-water)/solid ratio 15:1 mL/g; microwave power 320 W; and temperature 80°C; resulting in the total phenolic compounds (TPC), DPPH, and CUPRAC antioxidant activity values of 607 mg GAE/100 g, 878 mg TE/100 g, and 2922 mg TE/100 g, respectively. The extraction of TPC, DPPH, and CUPRAC antioxidants from artichoke by-products was investigated by the first-order, second-order, Peleg’s, and Page’s kinetic models. These results confirmed that MAE has a great potential for the extraction of polyphenolic compounds and antioxidants from Sakiz artichoke by-products.
Resumen
La sustitución de la técnica de extracción tradicional por la extracción ultrasónica o asistida por microondas ha generado considerable atención. Con el propósito de maximizar el rendimiento de los compuestos polifenólicos y antioxidantes extraídos de los subproductos de la alcachofa de Sakiz, en el presente estudio se aplicó un diseño compuesto central (CCD) para optimizar la extracción asistida por microondas (MAE). El estudio determinó que las condiciones óptimas para la MAE de los subproductos de dicha alcachofa eran: tiempo de extracción 6 min; relación etanol/agua 50:50 (v/v); relación (etanol/agua)/sólido 15:1 mL/g; potencia de las microondas 320 W; y temperatura 80°C. Estas condiciones produjeron valores de actividad antioxidante de los compuestos fenólicos totales (TPC), DPPH y CUPRAC de 607 mg GAE/100 g, 878 mg TE/100 g y 2,922 mg TE/100 g, respectivamente. La extracción de TPC y de antioxidantes DPPH y CUPRAC de los subproductos de la alcachofa fue investigada aplicando modelos cinéticos de primer orden, segundo orden, de Peleg y de Page. Los resultados obtenidos confirmaron que la MAE tiene gran potencial para la extracción de compuestos polifenólicos y antioxidantes de los subproductos de la alcachofa Sakiz.
PALABRAS CLAVE:
1. Introduction
Artichoke (Cynara cardunculus ssp. scolymus L.) grown around the Mediterranean Sea is an Asteraceae species and makes up an important part of the Mediterranean diet due to its rich minerals, polyphenolics, and antioxidants (Ruiz-Aceituno et al., Citation2016). The industrial processing of this vegetable creates a large amount of agricultural waste. The inner bracts and hearts of artichokes are considered edible parts, whereas the external bracts, leaves, and stems, which make up approximately 80%–85% of the total biomass, are non-food industrial by-products (Gaafar & Salama, Citation2013). By themselves, these by-products are not suitable for human diets, but they could be used as a source of phenolic compounds, antioxidants, and flavonoids in the food or pharmaceutical industries.
Extraction is the most important process in separating polyphenolic compounds and antioxidants from plant materials. Traditional techniques involve the application of solid-liquid extraction methods and solid-liquid extraction encompasses various methods such as soxhlet extraction, reflux extraction, and maceration extraction. These techniques have been utilized for more than a century for the isolation of phenolic compounds. Many factors, such as solvent type, extraction temperature, time, and solvent/solid ratio, significantly affect extraction yields. Over the last decade, advanced extraction methods such as pressurized liquid extraction, ultrasound-assisted extraction, and microwave-assisted extraction technologies have been used to obtain extracts rich in polyphenolic compounds and antioxidants (Ruiz-Aceituno et al., Citation2016). Furthermore, compared to the conventional solid-liquid extraction method, these advanced techniques effectively increase extraction yields while decreasing extraction times. Among the techniques, microwave-assisted extraction (MAE) has been of great interest in recent years in obtaining polyphenolic compounds and antioxidants from industrial by-products (Ruiz-Aceituno et al., Citation2016). MAE is a separation process in which microwave energy is used to heat a solvent to extract the solid phase, enabling the diffusion of the active substance from the solid-to-solvent phase in a short time and thereby raising the extraction yield while significantly decreasing the solvent consumption and extraction time (Dahmoune et al., Citation2015).
The objective of the current paper is to develop an efficient alternative technique for extracting polyphenolic compounds from Sakiz artichoke by-products such as external bracts and leaf mixture and also determine DPPH and CUPRAC antioxidant activities of the extracts. This work represents the first example in the literature to follow the optimization and kinetic behaviour of MAE as an alternative extraction method of Sakiz-variety artichokes, and the results offer a reference for the valorization of Sakiz artichoke by-products.
2. Materials and methods
2.1. Artichoke sample preparation
Cynara scolymus L. cv. Sakiz artichokes were collected from Izmir, Turkey. External bracts and leaf mixtures were collected from at least 10 different plants. The external bracts and leaf mixture (bract: 30% (w/w) and leaf: 70% (w/w)) of the artichoke were dried in an oven at 50°C and the samples were milled using a grinder with up to 500 µm mesh. The resulting powder was then stored at 4°C in airtight bags until analysis.
2.2. Materials
Folin–Ciocalteu’s phenol reagent, gallic acid, 2,2-diphenyl-1-picryl-hydrazine (DPPH), (±)-6-hydroxy-2,5,7,8-tetramethylchromane-2-carboxylic acid (TROLOX), neocuproine, and sodium carbonate were purchased from Sigma-Aldrich (Germany). Methanol was purchased from JT Baker Chemicals (United States). Ethanol, copper (II) chloride, and ammonium acetate were obtained from Merck (Turkey). All reagents were analytical grade.
2.3. MAE of the external bracts and leaf mixture of the artichoke
The extracts from the external bracts and leaf mixture of the artichoke were obtained using microwave extraction. In a typical experiment, 1 g of dried external bracts and leaf mixture and 5–25 mL of ethanol/water ratio (100–100:0 v/v) were placed in a 100 ml Teflon PFA-lined extraction vessel. The microwave power was set at 320 W, and the contents underwent MAE following experimental design conditions (Stumpf et al., Citation2019).
2.4. Experimental variables for optimization of MAE
Five levels and three independent variables on the phenolic content and the antioxidants extraction of the mixture were investigated using Central Composite Design (CCD). The coded and actual levels of experimental variables were time (2–6 min), (ethanol-water mixture)/solid ratio (5:1–25:1 v/w), and ethanol/water ratio (100–100:0 v/v). A total of 20 MAE experiments were carried out in randomized order, according to design ().
Table 1. Experimental design matrix with experimental data.
Tabla 1. Matriz de diseño experimental con datos experimentales.
After extraction, the extracts were filtered through a Whatman No.1 filter paper and crude extracts were stored at −18°C in amber flasks until TPC, DPPH, and CUPRAC antioxidant activities were analysed (Stumpf et al., Citation2019). All MAE experiments were performed in triplicate.
2.5. Modelling the MAE of the external bracts and leaf mixture of the artichoke using CCD
Design Expert software (Version 11.0.0, Stat-Ease, Inc., Minneapolis, MN) was employed for the modelling and optimization of the MAE process (Sahin et al., Citation2020; Saponjac et al., Citation2020). An adjusted coefficient of determination, coefficient of determination, probability value at 95% confidence interval, predicted R2, coefficient of variation, lack-of-feet, and analysis of variance (ANOVA) were used as statistical indicators.
2.6. TPC analysis
The total phenolic contents of extract phases from the external bracts and leaf mixture of the artichoke were assessed spectrophotometrically using the Folin–Ciocalteu procedure (Thaipong et al., Citation2006). TPC values were calculated as mg gallic acid equivalents (GAE) per 100 g of dry weight. All TPC analyses were performed four times.
2.7. DPPH antioxidant activity analysis
The DPPH antioxidant activities of extract phases from the external bracts and leaf mixture of the artichoke were assessed spectrophotometrically as previously reported (Thaipong et al., Citation2006). DPPH values were calculated as mg trolox equivalent per 100 g of dry weight. All DPPH analyses were performed four times.
2.8. CUPRAC antioxidant activity analysis
The CUPRAC antioxidant capacities of extract phases from the external bracts and leaf mixture of the artichoke were assessed spectrophotometrically as previously reported (Apak et al., Citation2004). CUPRAC antioxidant capacity values were calculated as mg trolox equivalent per 100 g of dry weight. All CUPRAC analyses were performed four times.
2.9. Kinetic modelling of the MAE of the external bracts and leaf mixture of the artichoke
In the present study, four mathematical models were used to fit the experimental data of TPC, DPPH, and CUPRAC analyses and evaluate the entire MAE process. The first-order, second-order, Peleg’s, and Page’s kinetic models were compared in order to determine the best fit the experimental data.
The first-order kinetic model was used to describe the MAE of TPC, CUPRAC, and DPPH from the extracts.
The model can be described as:
where Ct is the solute concentration in the liquid (mgg−1), Ce represents the solute concentration at equilibrium in the liquid phase (mgg−1), k indicates the mass transfer coefficient (min−1), and t is the extraction time (min).
The second-order kinetic model equation can be used for solid-liquid extraction kinetics (Harouna-Oumarou et al., Citation2007) and the model can be described as:
where dCt/dt is the rate of extraction (mgg−1min−1), k is the rate constant of the extraction process (g/mg.min), Ct is the solute concentration in the liquid (mgg−1), Ce represents the solute concentration at equilibrium in the liquid phase (mgg−1), and t is the extraction time (min). The initial extraction rate h is equal to kCe2 (Harouna-Oumarou et al., Citation2007).
Peleg’s model can be used to explain kinetic behavior of the solid-liquid extraction (Kaderides et al., Citation2019) and the model can be described as:
where Ct is the concentration of the solute (mgg−1), t is the extraction time (min), k1 is Peleg’s rate constant (mingmg−1), and k2 is the Peleg’s capacity constant (gmg−1).
Page’s model is commonly used in solid-liquid extraction processes (Kaderides et al., Citation2019) and the model can be described as:
where Ct is the concentration of solute at extraction time t (mgg−1), k (mgg−1) and n (mgg−1) are Page’s constants, and t is the extracted time (min).
3. Results and discussion
3.1. MAE results of the external bracts and leaf mixture of the artichoke
The effects of the three independent variables, including extraction time (2–6 min), (ethanol-water mixture)/solid ratio (5:1–25:1 v/w), and ethanol/water ratio (100–100:0 v/v) on the TPC, DPPH, and CUPRAC responses were investigated in the presenting study. The responses in correspondence with each combination of three independent variables are shown in . It was found that the TPC and antioxidant activities of the extracts varied in wide ranges (83–607 mg GAE/100 g, 94–878 mg TE/100 g, and 271–2922 mg TE/100 g for TPC, DPPH, and CUPRAC antioxidant activities, respectively) depending on the changes of process variables.
The efficiency and effectiveness of the phenolic compounds extraction using MAE method can be manipulated by several variables, such as extraction time, solvent/solid ratio, and solvent type. shows the effect of MAE time on the extraction of phenolic compounds and antioxidants in the extracts of the bracts and leaf mixture. The results indicated that the values of TPC, DPPH, and CUPRAC antioxidant activities were increased with the increase of MAE time; also Zhang et al. (Citation2013) mentioned that extraction time affected TPC, DPPH, and CUPRAC responses the most. It can be seen clearly from the table, TPC values were found to be 376 mg GAE/100 g for 2 min, 398 mg GAE/100 g for 4 min, and 607 mg GAE/100 g for 6 min; DPPH values were determined to be 590 mg TE/100 g for 2 min, 402 mg TE/100 g for 4 min, and 878 mg TE/100 g for 6 min; CUPRAC values were shown to be 1580 mg TE/100 g for 2 min, 1112 mg TE/100 g for 4 min, and 2922 mg TE/100 g for 6 min when the (ethanol-water mixture)/solid ratio was 15/1 mL/g and ethanol/water was 50:50 (v/v). Therefore, 6 min is the optimal MAE duration.
also indicates that the extraction of phenolic compounds and antioxidants was increased with the increase of (ethanol-water mixture)/solid ratio (v/w). If the extraction was investigated under high (ethanol-water mixture)/solid ratio, the values of TPC, DPPH, and CUPRAC antioxidant activities in extraction solution were quietly high. An increase in TPC, DPPH, and CUPRAC values was observed when the (ethanol-water mixture)/solid ratio (v/w) increased from 5:1 mL/g to 15:1 mL/g and 25:1 mL/g with a constant ethanol/water ratio (50:50 (v/v)) and extraction time (4 min). TPC, DPPH, and CUPRAC values increased: 83 mg GAE/100 g, 94 mg TE/100 g, 271 mg TE/100 g for 5:1 mL/g; 394 mg GAE/100 g, 486 mg TE/100 g, 1024 mg TE/100 g for 15:1 mL/g; and 504 mg GAE/100 g, 776 mg TE/100 g, and 2029 mg TE/100 g for 25:1 mL/g, respectively.
Moreover, shows that phenolic compounds and antioxidants in the artichoke extracts were significantly influenced by the ethanol concentration in water. It can be safely stated that TPC and DPPH values increased from 144 mg GAE/100 g and 220 mg TE/100 g for 75% ethanol in water to 260 mg GAE/100 g and 251 mg TE/100 g for 25% ethanol in water when the (ethanol-water mixture)/solid ratio was 10:1 mL/g and the extraction time was 3 min (). Also, CUPRAC value decreased from 732 to 576 mg TE/100 when ethanol concentration decreased from 75% to 25% in water. TPC and DPPH values increased from 322 mg GAE/100 g and 384 mg TE/100 g for 75% ethanol in water to 413 mg GAE/100 g and 575 mg TE/100 g for 25% ethanol in water when the (ethanol-water mixture)/solid ratio was 20:1 mL/g and the extraction time was 3 min. Furthermore, CUPRAC value decreased sharply in the same conditions. It is clear that TPC, DPPH, and CUPRAC values were determined to be 297 mg GAE/100 g, 252 mg TE/100 g, and 720 mg TE/100 g, respectively, for 100% water; 398 mg GAE/100 g, 402 mg TE/100 g, and 1112 mg TE/100 g, respectively, for 50% ethanol in water; and also 178 mg GAE/100 g, 242 mg TE/100 g, and 846 mg TE/100 g for 100% ethanol when the (ethanol-water mixture)/solid ratio was 15:1 mL/g and extraction time was 4 min. Therefore, 50:50 (v/v) is the optimal ethanol/water ratio ().
3.2. Fitting the model
According to the CCD experimental design matrix (), the adequacy of linear, two-factor interactive (2FI), quadratic, and cubic models are shown in . The models were applied to MAE experiments measuring the values of TPC, DPPH, and CUPRAC from the external bracts and leaf mixture of the artichokes to determine regression statistics models. Linear, two-factor interactive (2FI), quadratic, and cubic models were adapted to the MAE experimental studies to obtain the regression statistics models. The adequacy of the models was decided by two different tests, which are sequential model sum of squares (SMSS) and model summary statistics tests (Sahin et al., Citation2020). In the current study, the fit summary of the experimental results of MAE illustrated that the quadratic models for TPC, DPPH, and CUPRAC were statistically significant, with sequential p-values of <0.0001 and regression coefficients that were acceptable for MAE of artichokes. The results emphasized that the quadratic model was statistically significant for MAE and the model was suggested to describe the relationship between responses and independent process variables. The quadratic models of TPC, DPPH, and CUPRAC data have relatively higher adjusted-R2 values than that of linear, interactive (2FI), and cubic models. The adjusted-R2 values were calculated to be 0.97 for TPC, 0.96 for DPPH, and 0.98 for CUPRAC. The cubic models for TPC, DPPH, and CUPRAC data were found to be aliased. The adjusted-R2 and predicted-R2 values were higher than that of the other models, and the quadratic model was therefore selected as suitable for further analysis ().
Table 2. Regression statistics models of the MAE of the external bracts and leaf mixture of the artichoke.
Tabla 2. Modelos estáticos de regresión de la MAE de la mezcla de brácteas externas y hojas de la alcachofa.
The statistical significance of the regression equations was controlled by ANOVA and Fisher’s f-test for response surface quadratic model, which is shown in .
Table 3. ANOVA analysis and F-test data of the MAE of the external bracts and leaf mixture of the artichoke.
Tabla 3. Análisis ANOVA y datos de la prueba F de la MAE de la mezcla de brácteas externas y hojas de la alcachofa.
An empirical relationship between the responses and the independent variables was modelled in quadratic model equations in terms of actual variables; see EquationEq. (5)(5)
(5) for TPC, EquationEq. (6)
(6)
(6) for DPPH, and EquationEq. (7)
(7)
(7) for CUPRAC.
where A, B, and C, were identified to be (ethanol-water mixture)/solid ratio (v/w), extraction time (min), and ethanol/water ratio (v/v), respectively. The equation terms, such as AB, AC, and BC describe the interaction of two independent variables, and A2, B2, and C2 establish the squared effect of independent variables. EquationEq. (5(5)
(5) ), EquationEq. (6
(6)
(6) ), and EquationEq. (7)
(7)
(7) represent the independent variables, the interactions of two independent variables, and the squared effects of independent variables that influenced the TPC, DPPH, and CUPRAC responses.
MAE experimental data were controlled using ANOVA analysis, and the ANOVA analysis was used to control the statistical significance of the quadratic model by checking the p-values and the f-values. In ANOVA, a model with low p-values (p < .05) and high f-values (f > 5.0) can be accepted as suitable (Sahin et al., Citation2020). TPC, DPPH, and CUPRAC values of the external bracts and leaf mixture extracts were examined by ANOVA using p-values and f-values. The results of the ANOVA for the quadratic model p-values and f-values of TPC, DPPH, and CUPRAC responses are given in . The low p-values and high f-values show that the quadratic models were very significant and suggested a strong relationship between the independent variables and TPC, DPPH, and CUPRAC responses. The variable with the lowest p-value or the highest f-value is the variable that most affects the responses. According to p-values, A, B, C, AB, BC, A2, B2, and C2 for TPC; A, B, AB, AC, BC, B2, and C2 for DPPH; and A, B, C, AB, A2, B2, and C2 for CUPRAC were significant model variables. Furthermore, according to f-values, the most effective model variables were found to be (ethanol-water mixture)/solid ratio (v/w) (A) and extraction time (min) (B) for TPC, DPPH, and CUPRAC data. The most effective variables were A > B> C2> B2> BC>A2> AB = C for TPC, A> B2 > B> C2> AC>AB = BC for DPPH, and A> B2 > B> AB>C2 > C> A2 for CUPRAC responses.
3.3. Response surface analysis
Three-dimensional (3D) RSM graphs are very important in understanding the interactions of the independent variables and the responses. , , and show the interactions between the independent variables and the responses based on the quadratic models in EquationEq. (6)(6)
(6) , (Equation7
(7)
(7) ), and (8), respectively (Carciochi Ramiro et al., Citation2018; Hodzic et al., Citation2009). Since the regression model has three independent variables and three factors remained constant at the center levels, so six response 3D surfaces were obtained. The 3D-response surfaces presented the reasonable interactions between each of the independent factors and MAE of artichoke.
Figure 1. Response surface and contour plot showing the effects of solvent/solid ratio (v/w) and extraction time (min) on TPC, DPPH, and CUPRAC responses.
Figura 1. Superficie de respuesta y gráfico de contorno que muestran los efectos de la relación disolvente/sólido (v/p) y del tiempo de extracción (min) en las respuestas de TPC, DPPH y CUPRAC.
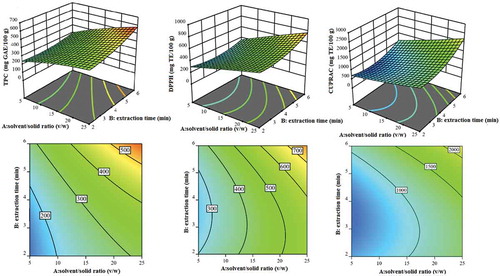
Figure 2. Response surface and contour plot showing the effects of solvent/water ratio (v/v) and extraction time (min) on TPC and DPPH responses.
Figura 2. Superficie de respuesta y gráfico de contorno que muestran los efectos de la relación solvente/agua (v/v) y del tiempo de extracción (min) en las respuestas de TPC y DPPH.
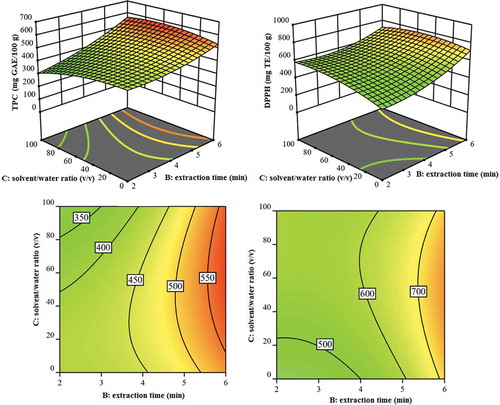
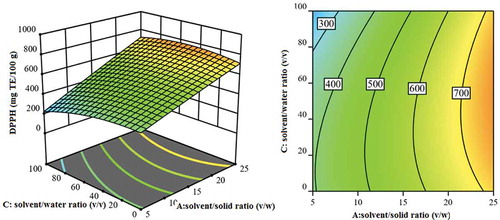
Figure 3. Response surface and contour plot showing the effects of solvent/water ratio (v/v) and solvent/solid ratio (v/w) on DPPH response.
Figura 3. Superficie de respuesta y gráfico de contorno que muestra los efectos de la relación disolvente/agua (v/v) y la relación disolvente/sólido (v/p) en la respuesta del DPPH.
According to , reasonable interactions between (ethanol-water mixture)/solid ratio (v/w) (A) and extraction time (min) (B) were emphasized on the TPC, DPPH, and CUPRAC responses. According to EquationEqs. (6)(6)
(6) , (Equation7
(7)
(7) ), and (8), (ethanol-water mixture)/solid ratio (v/w) (A) and extraction time (min) (B) were the variables that had the greatest effect (p < .05) on TPC, DPPH, and CUPRAC values. Increasing the extraction time and (ethanol-water mixture)/solid ratio displayed a positive effect on the TPC, DPPH, and CUPRAC values of the artichoke. This situation can be explained with mass transfer principles, since higher solvent/solid ratios imply higher concentration gradients between the solid and the bulk of the solvent, resulting in a greater driving force for the diffusion of compounds in the solvent. Moreover, increasing the solvent/solid ratio to a specific limit increases the yield of extraction since the concentration gradient between the solid and the liquid phase becomes greater, favoring good mass transfer (Wejnerowska & Ciaciuch, Citation2018).
indicates the effects of time (min) (B) and ethanol/water ratio (v/v) (C) on the TPC and DPPH responses while keeping the other factors constant. At a constant ethanol/water ratio (50:50 (v/v)), the TPC and DPPH responses were found to be the highest at a maximum MAE time of 6 min. It is safely mentioned that a prolonged exposure of the artichoke sample in the ethanol/water solvent system, allowed sufficient time for the desired polyphenols to diffuse into the solvent. Also, at a constant time, the TPC and DPPH responses were found to be the highest at 50:50 (v/v) ethanol/water ratio. It can be explained that increasing the water content in the ethanol-water mixture caused swelling in the artichoke sample which resulted in increased contact between the plant and the solvent, thus contributing to an increased yield. Furthermore, this could be explained by the different ethanol/water ratios affecting the polarity of the solvent system, thereby changing the solubility of the antioxidants (Chew et al., Citation2011). Pure ethanol has the polarity index of around 5.1 yielded higher values of TPC and antioxidant content. Addition of water, which has the polarity index of 9.0 increased the solubility of the desired compounds and hence improved the overall extraction yield of polyphenols (Muhammad et al., Citation2014).
shows the effects of (ethanol-water mixture)/solid ratio (v/w) (A) and ethanol/water ratio (v/v) (C) on the DPPH response while keeping the other factors constant. Result analysis for DPPH indicated that DPPH antioxidant activity was significantly affected by (ethanol-water mixture)/solid ratio. The higher (ethanol-water mixture)/solid ratio caused higher DPPH antioxidant activity (776 mg TE/100 g). It is expressed that the solvent/solid ratio has a positive effect on the extraction yield. This is consistent with mass transfer principles. The driving force during mass transfer is the concentration gradient between the solid and the bulk of the liquid, which is greater, when, a higher solvent to solid ratio is used.
3.4. Kinetic modelling of the MAE of the external bracts and leaf mixture of the artichoke
The TPC, DPPH, and CUPRAC values were followed with respect to time. These values rose rapidly over the first 4 minutes before asymptotically approaching a limiting equilibrium value (Ce), with a profile plateau occurring between 5 and 6 min. This pattern is because when the external bracts and leaf mixture were exposed to the fresh ethanol-water mixture, the polyphenolic compounds and antioxidants on the surface of artichoke were solubilized and polyphenolic compounds and antioxidants were extracted quickly, inducing a sharp increase in the extraction rate. Furthermore, since the polyphenolic compounds and antioxidant values were low in the ethanol-water mixture at the beginning of the extraction process, the polyphenols diffuse quickly from the external bracts and leaf mixture into the liquid phase due to the mass transfer effect. As time passed by, reaching 5 and 6 min, the concentration of polyphenols increases in the ethanol-water mixture, resulting in a decrease in the diffusion rate.
According to the TPC, DPPH, and CUPRAC values with respect to time, four kinetic models were made to fit the data and the highest value of R2 was chosen for the best fit. shows the model parameters and R2 values of the kinetic models.
Table 4. Kinetic parameters of the MAE of the external bracts and leaf mixture of the artichoke.
Tabla 4. Parámetros cinéticos de la MAE de la mezcla de brácteas externas y hojas de la alcachofa.
The plot of ln(Ce/(Ce – Ct)) versus t () indicates that the MAE of phenolic compounds and antioxidants from artichoke can be presented in a linear form according to the first-order model. The theory, through EquationEq. (1(1)
(1) ), suggests that the line should pass through the origin. This was not the case as seen in the first-order plot in the current study, where a semi-empirical intercept (a) was found in each instance. It is postulated that the intercept is affected by the loss of soluble, the external bracts and leaf structures, and their uptake of water at the beginning of the extraction. kmodel can be calculated in two steps for this behaviour (Linares et al., Citation2010). First, once (a) and kcalculated have been obtained from the model graph, the half-life (t1/2) can be calculated by t1/2 = ((ln2 – a)/kcalculated). Substituting t1/2 and Ct = 0.5Ce back into EquationEq. (1)
(1)
(1) gave the values of kmodel. kmodel, kcalculated, a, t1/2 and R2 values were then calculated (). The kmodel and kcalculated values of TPC, DPPH, and CUPRAC were determined to be 0.49 and 0.63 min−1; 0.51 and 0.29 min−1; and 0.16 and 0.18 min−1, respectively.
Figure 4. MAE kinetic models of TPC, DPPH, and CUPRAC values of bracts and leaf mixture of the artichoke.
Figura 4. Modelos cinéticos MAE de los valores TPC, DPPH y CUPRAC de la mezcla de brácteas y hojas de la alcachofa.
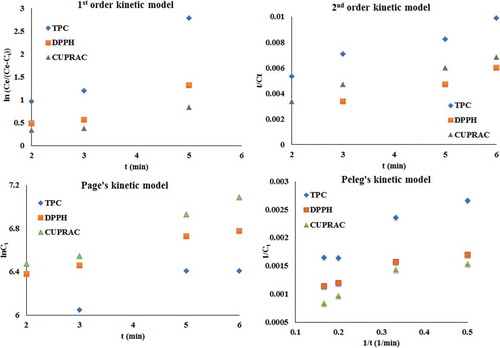
The TPC, DPPH, and CUPRAC values of the extracts were analysed using a second-order kinetic model of MAE. The results are shown as a series of plots of t/Ct versus t () (Sayyar et al., Citation2009). The equilibrium extraction capacity, Ce, the initial extraction rate, h, the extraction rate constant, k, and the coefficient of determination, R2, are given in . h and k values were calculated as 280 mgg−1min−1 and 2.8 × 10⁻⁴ gmg−1min−1; 50 mgg−1min−1 and 3.2 × 10⁻⁵ gmg−1min−1; and 387.5 mgg−1min−1 and 6.2 × 10⁻⁵ gmg−1min−1 for TPC, DPPH, and CUPRAC, respectively. According to the h values for TPC, DPPH, and CUPRAC, the rate of MAE was very fast at the beginning of the operation, followed by a slower rate for the remaining extraction period until it plateaued after 4 min of extraction. More than 60% of the polyphenolic compounds and antioxidants were obtained in the first 4 min of the extraction. On the other hand, the second-order model represented very high coefficients of determination (>0.95), and Ce,experimental and Ce,calculated values were determined to be 607 and 1000 mg GAE/100 g, 878 and 1250 mg TE/100 g, and 2922 and 2500 mg TE/100 g, for TPC, DPPH, and CUPRAC, respectively. The Ce,calculated values differed slightly from the Ce,experimental values, meaning the second-order kinetic model was not well fitted to characterize the MAE of the external bracts and leaf mixture of artichoke.
The kinetic parameters of Peleg’s model for TPC, DPPH, and CUPRAC are represented in . It can be stated that low k1 values imply a faster rate of extraction (Kojic et al., Citation2007) and that low k2 values imply maximum yield. k1 and k2 values were determined to be 0.0033 mingmg−1 and 0.0011 gmg−1 for TPC; 0.0017 mingmg−1 and 0.0009 gmg−1 for DPPH; and 0.0021 mingmg−1 and 0.0006 gmg−1 for CUPRAC. Peleg’s model represented higher coefficients of determination (>0.92), which implied good concordance between experimental and calculated data.
The R2 values were found to be higher than 0.94 for Page’s model. k and n values were calculated to be 5.65 and 0.132 for TPC; 6.15 and 0.106 for DPPH; 6.11 and 0.161 for CUPRAC.
4. Conclusion
In the current paper, the microwave-assisted extraction of phenolic compounds from the external bracts and leaf mixture of the artichoke was investigated and optimized. In this purpose (ethanol-water mixture)/solid ratio (v/w), extraction time, and ethanol/water ratio (v/v) were optimized using CCD for MAE of phenolic content, DPPH, and CUPRAC antioxidants in the extracts. The first-order, second-order, Peleg’s, and Page’s kinetic models were developed to describe the kinetic mechanisms of polyphenolic compound and antioxidant extraction. The investigation results were the best described by the first-order model appeared to be more suitable to describe MAE of artichoke by-products. An MAE process for six minutes with ethanol/water ratio 50:50 (v/v), (ethanol-water mixture)/solid ratio 15:1 mL/g, microwave power 320 W, and temperature 80°C is necessary to separate phenolic compounds. The TPC, DPPH, and CUPRAC antioxidant activity values were determined to be 607 mg GAE/100 g, 878 mg TE/100 g, and 2922 mg TE/100 g, respectively, in these conditions. It can be concluded that MAE has a considerable potential and efficiency for the separation of polyphenolic compounds and antioxidants from Sakiz artichoke by-products.
Acknowledgments
The financial support for this paper was provided by the Yalova University Scientific Research Projects Coordination Department (Project no. 2019/DR/0001) and by the Agriculture and Forestry General Directorate of Agricultural Research and Policies R&D Support Program (Project no: TAGEM/HSGYAD/A/20/A3/P4/1927).
Disclosure statement
The authors declare no conflict of interest.
References
- Apak, R., Güçlü, K., Ozyurek, M., & Karademir, S. E. (2004). Novel total antioxidant capacity index for dietary polyphenols and vitamins C and E, using their cupric ion reducing capability in the presence of neocuproine: CUPRAC method. Journal of Agricultural Food Chemistry, 52(26), 7970–7981. https://doi.org/10.1021/jf048741x
- Carciochi Ramiro, A., Sologubik, C., Manrique, G., & Fernandez, M. B. (2018). Extraction of antioxidant phenolic compounds from brewer’s spent grain: Optimization and kinetics modeling. Antioxidants, 7(45), 1–10. https://doi.org/10.3390/antiox7040045
- Chew, K. K., Khoo, M. Z., Ng, S. Y., Thoo, Y. Y., Wan Aida, M. W., & Ho, C. W. (2011). Effect of ethanol concentration, extraction time and extraction temperature on the recovery of phenolic compounds and antioxidant capacity of Orthosiphon stamineus extracts. International Food Research Journal, 18(4), 1427–1435. http://www.ifrj.upm.edu.my/18%20(04)%202011/(32)IFRJ-2011-023.pdf
- Dahmoune, F., Nayak, B., Moussi, K., Remini, H., & Madani, K. (2015). Optimization of microwave-assisted extraction of polyphenols from Myrtus communis L. leaf. Food Chemistry, 166, 585–595. https://doi.org/10.1016/j.foodchem.2014.06.066
- Gaafar, A. A., & Salama, Z. A. (2013). Phenolic compounds from artichoke (Cynara scolymus L.) by-products and their antimicrobial activities. Journal of Biology, Agriculture and Health, 3(12), 1–6. https://pdfs.semanticscholar.org/2e90/95b1bcba3c7a4ff618cb9e69241adadd8937.pdf
- Harouna-Oumarou, H. A., Fauduet, F., Porte, C., & Ho, Y. S. (2007). Comparison of kinetic models for the aqueous solid-liquid extraction of Tilia sapwood in a continuous stirred tank reactor. Chemical Engineering Communications, 194(4), 537–552. https://doi.org/10.1080/00986440600992511
- Hodzic, Z., Pasalic, H., Memisevic, A., Srabovic, M., Saletovic, M.& Poljakovic, M. (2009). The influence of total phenols content on antioxidant capacity in the whole grain extracts. European Journal of Science and Research, 28(3), 471–477. http://citeseerx.ist.psu.edu/viewdoc/download?doi=10.1.1.335.7023&rep=rep1&type=pdf
- Kaderides, K., Papaoikonomou, L., Serafim, M., & Goula, A. M. (2019). Microwave-assisted extraction of phenolics from pomegranate peels: Optimization, kinetics, and comparison with ultrasounds extraction. Chemical Engineering and Processing: Process Intensification, 137, 1–11. https://doi.org/10.1016/j.cep.2019.01.006
- Kojic, A. B., Planinic, M., Tomas, S., Bilic, M., & Velic, D. (2007). Study of solid–liquid extraction kinetics of total polyphenols from grape seeds. Journal of Food Engineering, 81(1), 236–242. https://doi.org/10.1016/j.jfoodeng.2006.10.027
- Linares, A. R., Hase, S. H., Vergara, M. L., & Resnik, S. L. (2010). Modeling yerba mate aqueous extraction kinetics: Influence of temperature. Journal of Food Engineering, 97(4), 471–477. https://doi.org/10.1016/j.jfoodeng.2009.11.003
- Muhammad, N., Muhmed, S. A., Yusoff, M. M., & Gimbun, J. G. (2014). Influence of solvent polarity and conditions on extraction of antioxidant, flavonoids and phenolic content from Averrhoa bilimbi. Journal of Food Science and Engineering, 4, 255–260. https://doi.org/10.17265/2159-5828/2014.05.006
- Ruiz-Aceituno, L., Jesus Garcia-Sarrio, M., Alonso-Rodriguez, B., Ramos, L., & Luz Sanz, M. (2016). Extraction of bioactive carbohydrates from artichoke (Cynara Scolymus L.) external bract using microwave assisted extraction and pressurized liquid extraction. Food Chemistry, 196, 1156–1162. https://doi.org/10.1016/j.foodchem.2015.10.046
- Sahin, O. I., Yalcin, B., & Saloglu, D. (2020). Adsorption of ibuprofen from wastewater using activated carbon and graphene oxide embedded chitosan-PVA: Equilibrium, kinetics, and thermodynamic and optimization with central composite design. Desalination and Water Treatment, 179, 396–417. https://doi.org/10.5004/dwt.2020.25027
- Saponjac, V. T., Canadanovic-Brunet, J. M., Cetkovic, G. S., Jakisic, M., Vulic, J., Stajcic, S., & Seregelj, V. (2020). Optimization of beetroot juice encapsulation by freeze-drying. Polish Journal of Food and Nutrition Sciences, 70(1), 25–34. https://doi.org/10.31883/pjfns/115153
- Sayyar, S., Abidin, Z. Z., Yunus, R., & Muhammad, A. (2009). Extraction of oil from Jatropha seeds-optimization and kinetics. American Journal of Applied Science, 6(7), 390–1395. https://thescipub.com/abstract/10.3844/ajassp.2009.1390.1395
- Stumpf, B., Künne, M., Ma, L., Xu, M., Yan, F., Piepho, H. P., & Honermeier, B. (2019). Optimization of the extraction procedure for the determination of phenolic acids and flavonoids in the leaf of globe artichoke (Cynara Cardunculus Var. Scolymus L.). Journal of Pharmaceuticals and Biomedical Analysis, 177, 112879. https://doi.org/10.1016/j.jpba.2019.112879
- Thaipong, K., Boonprakob, U., Crosby, K., Cisneros-Zevallos, L., & Byrne, D. H. (2006). Comparison of ABTS, DPPH, FRAP, and ORAC assays for estimating antioxidant activity from guava fruit extracts. Journal of Food Composition and Analysis, 19(6–7), 669–675. https://doi.org/10.1016/j.jfca.2006.01.003
- Wejnerowska, G., & Ciaciuch, A. (2018). Optimization of oil extraction from quinoa seeds with supercritical carbon dioxide with co-solvents. Czech Journal of Food Science, 36(1), 81–87. https://doi.org/10.17221/122/2017-CJFS
- Zhang, G., Hu, M., He, L., Fu, P., Wang, L., & Zhou, J. (2013). Optimization of microwave-assisted enzymatic extraction of polyphenols from waste peanut shells and evaluation of its antioxidant and antibacterial activities in-vitro. Food and Bioproduct Processing, 91(2), 158–168. https://doi.org/10.1016/j.fbp.2012.09.003