
ABSTRACT
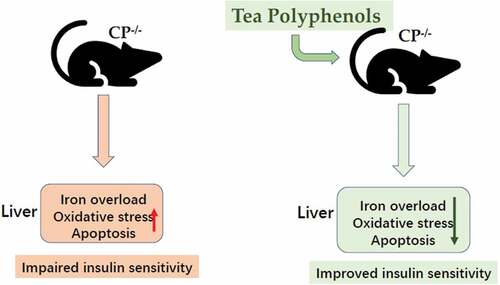
The present study aimed to investigate the role of tea polyphenols (TP) playing in glucose metabolism in male ceruloplasmin knockout mice (CP−/−), an iron-overloaded model. Compared to wild-type CP+/+ mice, CP−/− mice exhibited hyperglycemia, insulin resistance and excess iron deposition in liver tissue. Increased hepatic oxidative stress (P<0.05), apoptosis, and reduced gene expression of insulin receptor substrate 2 (IRS2) and glucose transporter 2 (GLUT2) were found in CP−/− mice (P<0.05). TP treatment may ameliorate hepatic iron overload, oxidative stress and apoptosis, improve insulin sensitivity by upregulating IRS2 and GLUT2 expressions. TP administration could improve glucose homeostasis in CP−/− mice by alleviating hepatic iron-overload, oxidative stress, hepatocyte apoptosis, and restoring insulin signaling pathway.
GRAPHICAL ABSTRACT
RESUMEN
El presente estudio se propuso investigar el papel desempeñado por los polifenoles del té (TP) en el metabolismo de la glucosa de ratones machos knockout de ceruloplasmina (CP−/−), un modelo de sobrecarga de hierro. Al compararlos con los ratones CP+/+ de tipo salvaje, los ratones CP−/− mostraron hiperglucemia, resistencia a la insulina y un exceso de depósito de hierro en el tejido hepático. Asimismo, los ratones CP−/− exhibieron aumento del estrés oxidativo hepático (P<0.05), apoptosis y reducción de la expresión génica del sustrato del receptor de insulina 2 (IRS2) y del transportador de glucosa 2 (GLUT2) (P<0.05). El tratamiento con TP podría mejorar la sobrecarga hepática de hierro, el estrés oxidativo y la apoptosis, además de mejorar la sensibilidad a la insulina mediante la suprarregulación de las expresiones de IRS2 y GLUT2. En tanto alivia la sobrecarga hepática de hierro, el estrés oxidativo, la apoptosis de los hepatocitos y restaura la vía de señalización de la insulina, la administración de TP podría mejorar la homeostasis de la glucosa en los ratones CP−/−.
Introduction
It is suggested that iron, the most abundant essential trace metal in the body, is crucial for many biochemical reactions including DNA synthesis, oxidative phosphorylation, and host defense (Fleming & Ponka, Citation2012). However, excessive iron deposition may generate massive reactive oxygen species (ROS), increase oxidative stress through the Fenton reaction (Dulal et al., Citation2014), leading to cell membranes damage and cell apoptosis (Shi et al., Citation2010), which may all be correlated with insulin resistance and type 2 diabetes (Nikooyeh & Neyestani, Citation2016). Liver plays a key role in iron homeostasis and is regarded as the main target of iron toxicity during iron overload (Meynard et al., Citation2014). Hepatic iron overload and increased oxidative stress has been shown to result in insulin resistance (Sanchez-Valle et al., Citation2012).
Ceruloplasmin (CP) is mainly expressed in hepatocytes, which is a multi-copper ferroxidase that facilitates iron binding to transferrin and promotes iron export from hepatocytes. Therefore, it has been found that CP might inhibit iron overload-induced auto-oxidation (Dulal et al., Citation2014). CP knockout (CP−/−) mice exhibit endogenous iron overload (Guo et al., Citation2009).
Tea polyphenols (TP), which is regarded as the natural antioxidants, have been suggested to have iron chelating properties (Mandel et al., Citation2008), possessing strong antioxidant and free radical scavenging abilities as well as anti-inflammatory effects (Li et al., Citation2014), which could protect liver from oxidative stress injury (Chacko et al., Citation2010). In addition, it has been found previously that, TP treatment could improve insulin resistance in high-fat diet-fed rats (Cheng et al., Citation2020; Chung et al., Citation2019) . A study performed by Xie et al. has indicated that TP treatment led to decreased hepatic lipid content and improved fasting blood glucose in high fat diet rats (Xia et al., Citation2019), indicating the role of TP played in maintaining glucose homeostasis. However, whether TP administration may improve metabolic disorders in CP−/− mice has been little studied. In the present experiment, we checked the glucose metabolism in CP−/− mice and investigated whether TP treatment may achieve protective effects by targeting liver metabolism.
Materials and methods
Animals
Ten-month-old male CP−/− mice were obtained from Kunihiro Yoshida (Department of Brain Disease Research, Shinshu University Hospital, Japan), Shinʼichi Takeda (National Center of Neurology and Psychiatry, National Institute of Neuroscience, Japan). These CP−/− mice were backcrossed into the BALB/cJ × 129SvJ background. Age-matched CP−/− and wild-type male mice (CP+/+) were used in this study. Genotype was determined by PCR amplification. All animals were fed on standard rodent chow and tap water, and housed in a facility with temperature of 21 ± 2°C and humidity of 55 ± 10% and under a 12-h dark/light cycle. All procedures were carried out in accordance with the National Institutes of Health Guide for the Care and Use of Laboratory Animals, and were approved by the Animal Care and Use Committee of Hebei Science and Technical Bureau in PRC.
Tea polyphenols (TP) treatment
TP was kindly provided by Biophysical Institute of Chinese Academy of Sciences. TP consisted of 98% catechins, 58% epigallocatechingallate (EGCG), 18% epicatechingallate (ECG), 12% epigallocatechin (EGC), and 1% epicatechin (EC). TP was dissolved by sterilized double distilled water, and the concentration was adjusted to 50 mg/mL.
Male mice were randomly divided into four groups: (1) wild-type mice treated with saline (CP+/+); (2) wild-type mice treated with TP (CP+/+ TP); (3) CP knockout mice treated with saline (CP−/−); and (4) CP knockout mice treated with TP (CP−/− TP) (n = 12 per group). Mice were treated with TP (0.5 mg/g/day) or saline through intragastric administration for 4-weeks.
Glucose metabolism measurement
Intraperitoneal glucose tolerance test (IPGTT) and insulin assay: Mice (n = 6 per group) were allowed to adapt to their living condition for 3 days, and glucose (2 g/kg body weight, dissolved in 0.9% saline) was administered by an intraperitoneal (i.p.) injection after overnight fasting. Tail vein blood glucose was measured using an Accucheck glucometer (Roche, Germany) at the indicated time points (0, 15, 30, 60, and 120 min) following i.p. administration of glucose. Blood samples at 0 min and 10 min were collected for insulin measurement by radioimmunoassay.
Insulin tolerance test: Mice (n = 6 per group) were injected with recombinant human insulin (0.75 U/kg body weight, dissolved in 0.9% saline) after overnight fasting. Tail vein blood glucose was analyzed by the Accucheck glucometer at the indicated time points (0, 15, 30, and 60 min).
Non-haem iron determination in liver tissue
Mice (n = 6 per group) were anesthetized by an i.p. injection of 0.4% sodium pentobarbital and then sacrificed. Liver tissue was collected and homogenized in 1:9 (w/v) ice-cold saline solution. The homogenate was centrifuged at 3000 g at 4°C for 15 min, and the supernatant was used for the measurement of non-haem iron content by using tissue iron kit according to the manufacturer’s instructions (Jiancheng, Nanjing, China).
Hepatic oxidative stress measurement
The liver tissue was homogenized in 1:9 (w/v) ice-cold saline (n = 6 per group). The homogenate was centrifuged at 3000 g at 4°C for 15 min, and the supernatant was collected. Malondialdehyde (MDA) content and superoxide dismutase (SOD) activity were detected by MDA Assay Kit (Jiangcheng, Nanjing, China) and SOD Assay Kit (Jiancheng, Nanjing, China), respectively, according to the protocol.
TUNEL staining
Liver tissue was dehydrated gradiently, embedded in paraffin and sectioned at 4 μm (n = 6 per group). The terminal deoxynucleotidyl transferase-mediated FITC-dUTP nick-end labeling (TUNEL) was performed following the protocol as previously described (Kim et al., Citation2009; Wu et al., Citation2013). Nuclei were stained with 4, 6-diamino-2-phenyl indole (DAPI). The number of positive cells was counted as described previously (Zhou et al., Citation2019). Data were presented as the ratio of TUNEL-positive cells in CP−/− mice compared with that in the control CP+/+ mice.
Real-time PCR
Total RNA was extracted from liver tissue with TRIzol reagent (Invitrogen, USA) following the manufacturer’s instructions (n = 6 per group). Total RNA was purified using the RNeasy kit (Qiagen, Valencia, CA). Total RNA (1 μg per sample) was reverse transcribed into cDNA by using the RT kit (Takara, Dalian, China). Gene expression was determined by monitoring SYBR green fluorescence intensity using an ABI 7900HT Fast Real-Time PCR System (Applied Biosystems, USA). Each PCR reaction (final volume: 20 μL) consisted of 5 ng cDNA, 10 μL of SYBR Green PCR master mix (Applied Biosystems Gen Star), and 150 nM of each PCR primer. PCR amplification was performed with the BIO-RAD CFX Connect™ Optics Module with the following cycling parameters: 95°C for 10 min, followed by 40 cycles at 95°C for 15 s, 60°C for 1 min, and then 72°C for 1 min. The expression of GAPDH served as an internal control. The expression of the target gene was determined by normalizing to the respective GAPDH levels. The 2−ΔΔCt method was used to compare fold changes in mRNA expression among different groups. The primer sequences used were as follows: GLUT2: Forward: 5′- GAGATCGCTCCAACCACA −3′, Reverse: 5′- ATCCTGATTGCCCAGAATA −3′. IRS2: Forward: 5′-CTGCGTCCTCTCCCAAAGTG-3′, Reverse: 5′-GGGGTCATGGGCATGTAGC-3′. GAPDH: Forward: 5′-TGTTTCCTCGTCCCGTAG-3′, Reverse: 5′-CAATCTCCACTTTGCCACT-3′
Western blot
Proteins were extracted in lysis buffer (50 mM Tris, pH 7.5, 250 mM NaCl, 0.1% sodium dodecyl sulfate (SDS), 2 mM dithiothreitol, 0.5% NP-40, 1 mM phenylmethylsulfonyl fluoride (PMSF), and protease inhibitor cocktail on ice for 30 min) containing protease inhibitors. Protein concentration was determined by Coomassie Brilliant Blue method. SDS-polyacrylamide gel electrophoresis (SDS-PAGE) was performed as described previously (Shi et al., Citation2010). Total 40 ug protein samples were subjected to SDS-PAGE and transferred to PVDF membranes. The membranes were incubated with rabbit anti-mouse GLUT2 (1:1000, Proteintech, USA), rabbit anti-mouse IRS2 (1:1000, Abcam,USA), and rabbit anti-mouse GAPDH (1:1000, Affinity, USA) separately at 4°C overnight, and then incubated with anti-rabbit secondary antibody (1:1000, Amersham, UK) for 90 min at room temperature. Blots were developed with ECL reagents (Pierce Biotechnology, USA). The bands were quantified with densitometry software. Protein contents were normalized by the GAPDH level.
Statistical analysis
Statistical analysis was performed by SPSS software (version 21.0, SPSS Inc, Chicago). Normally distributed data were presented as mean ± standard deviation (mean ± SD). The statistical analysis of differences was assessed by a one-way ANOVA. P value less than 0.05 was considered statistically significant.
Results
TP treatment may reduce hepatic iron deposition in CP−/− mice
In the present experiment, compared to CP+/+ mice, CP−/− mice showed dramatic increased non-haem iron content in liver tissues (, CP−/− vs. CP+/+: P < 0.001) and this increment can be alleviated by TP treatment (; CP−/− TP vs. CP−/−: P < 0.001). TP treatment had no effect on hepatic iron content in CP+/+ mice (. CP+/+ TP vs. CP+/+: P > 0.05)
Figure 1. Non-Haem iron determination in liver tissue. The levels of non-haem iron were detected in the liver tissue of both CP+/+ and CP−/− mice with or without TP treatment. CP−/− mice showed significantly increased hepatic non-haem content compared with CP+/+ mice (CP−/− vs. CP+/+: P <0.001), while this increment could be alleviated by TP treatment (CP−/− TP vs. CP−/−: P <0.001).
Figura 1. Determinación de los niveles de hierro no hemo en el tejido hepático. Se detectaron los niveles de hierro no hemo en el tejido hepático de ratones CP+/+ y CP−/− con o sin tratamiento con TP. Los ratones CP−/− presentaron un contenido hepático de hierro no hemo significativamente mayor que el de los ratones CP+/+ (CP−/− vs. CP+/+: P < 0.001; este incremento pudo paliarse con el tratamiento con TP (CP−/− TP vs. CP−/−: P <0.001).
TP treatment could improve glucose metabolism and insulin sensitivity in CP−/− mice
In the present study, CP−/− mice exhibited increased blood glucose levels at all time points after IPGTT compared to CP+/+ mice (, CP−/− vs. CP+/+: P all <0.05), indicating impaired glucose tolerance. TP treatment led to largely improved glucose levels in CP−/− mice (, CP−/− TP vs. CP−/−: P all <0.05). TP had no effect on glucose levels at all time points in CP+/+ mice when compared with its saline-treated controls. (, CP+/+ TP vs. CP+/+: P all >0.05).
Figure 2. TP might improve glucose metabolism and insulin sensitivity in CP−/− mice. (a) CP−/− mice exhibited increased blood glucose levels at all time point after IPGTT compared to control mice (CP−/− vs. CP+/+: P all <0.05). TP treatment might improve glucose levels in CP−/− mice. (CP−/− TP vs. CP−/−: P all <0.05). (b) Insulin tolerance test indicated that, compared to CP+/+ mice, blood glucose levels were significantly higher in CP−/− mice at all time points (CP−/− vs. CP+/+: P <0.05). Blood glucose levels were significantly improved by TP treatment in CP−/− mice (CP−/− TP vs. CP−/−: P <0.05). TP treatment caused no alteration in glucose levels in CP+/+ mice (CP+/+ TP vs. CP+/+: P >0.05). (c) Compared with CP+/+ mice, CP−/− mice showed significantly higher fasting insulin levels (0 min) (CP−/− vs. CP+/+: P <0.05), which could be significantly reduced by TP treatment (CP−/− TP vs. CP−/−: P <0.05). TP treatment had no effect on insulin levels in CP+/+ mice at 0 min (CP+/+ TP vs. CP+/+: P >0.05). (d) TP treatment had no effect on first-phase insulin secretion (10 min) in both CP−/− mice (, CP−/− TP vs. CP−/−: P >0.05) and CP+/+ mice (CP+/+ TP vs. CP+/+: P >0.05).
Figura 2. El TP podría mejorar el metabolismo de la glucosa y la sensibilidad a la insulina en los ratones CP−/−. (a) En comparación con los ratones de control, los ratones CP−/− mostraron un aumento de los niveles de glucosa en sangre en todos los momentos después del IPGTT (CP−/− vs. CP+/+: P todos <0.05). El tratamiento con TP podría mejorar los niveles de glucosa en los ratones CP−/−. (CP−/− TP vs. CP−/−: P todos <0.05). (b) La prueba de tolerancia a la insulina indicó que, en comparación con los ratones CP+/+, los niveles de glucosa en sangre eran significativamente más altos en los ratones CP−/− en todos los puntos temporales (CP−/− vs. CP+/+: P < 0.05,). Los niveles de glucosa en sangre mejoraron significativamente con el tratamiento con TP en los ratones CP−/− (CP−/− TP vs. CP−/−: P < 0.05). El tratamiento con TP no causó alteraciones en los niveles de glucosa en los ratones CP+/+ (CP+/+ TP vs. CP+/+: P >0.05). (c) En comparación con los ratones CP+/+, los ratones CP−/− en ayunas mostraron niveles de insulina (0 min) significativamente más altos (CP−/− vs. CP+/+: P < 0.05), que se redujeron significativamente tras el tratamiento con TP (CP−/− TP vs. CP−/−: P < 0.05). El tratamiento con TP no tuvo ningún efecto sobre los niveles de insulina en los ratones CP+/+ a los 0 min. (CP+/+ TP vs. CP+/+: P >0.05). (d) El tratamiento con TP no tuvo ningún efecto sobre la secreción de insulina durante la primera fase (10 min) tanto en los ratones CP−/− (, CP−/− TP vs. CP−/−: P > 0.05) como en los ratones CP+/+ (CP+/+ TP vs. CP+/+: P > 0.05).
Data from insulin tolerance tests showed that, compared to CP+/+ mice, blood glucose levels were significantly higher in CP−/− mice at all time points (, CP−/− vs. CP+/+: all P < 0.05), and increased blood glucose can be improved by TP treatment (, CP−/− TP vs. CP−/−: P < 0.05), indicating TP treatment may improve insulin resistance in CP−/− mice. TP treatment caused no alterations in glucose levels at all time points in CP+/+ mice (, CP+/+ TP vs. CP+/+: P all >0.05).
Compared with CP+/+ mice, CP−/− mice exhibited significantly higher fasting (0 min) insulin levels (, CP−/− vs. CP+/+: P < 0.05), which could be reduced by TP treatment (, CP−/− TP vs. CP−/−: P < 0.05). Glucose administration led to elevated plasma insulin level at 10 min time point in CP−/− mice, which was comparable to that in CP+/+ mice (, CP−/− vs. CP+/+: P > 0.05). TP treatment had no effect on first-phase insulin secretion (10 min) in CP−/− mice (, CP−/− TP vs. CP−/−: P > 0.05). TP treatment also had no effect on insulin levels in CP+/+ mice both at 0 min and 10 min time points (, CP+/+ TP vs. CP+/+: P all >0.05).
TP may alleviate hepatic oxidative stress and apoptosis in CP−/− mice
Compared with CP+/+ mice, hepatic SOD activity was declined while the level of MDA was increased in CP−/− mice (, CP−/− vs. CP+/+: P all <0.05), indicating increased oxidative stress, and these alterations can be largely reversed by TP treatment (, CP−/− TP vs. CP−/−: P < 0.05), indicating TP treatment may alleviate hepatic oxidative stress.
Figure 3. TP alleviated hepatic oxidative stress injury and apoptosis in CP−/− mice. Compared with CP+/+ mice, hepatic SOD activity was significantly declined while the level of MDA was significantly increased in CP−/− mice, and all these alterations could be reversed by TP treatment (. CP−/− TP vs. CP−/−: P <0.05). The ratio of hepatic TUNEL-positive cells was found significantly increased in CP−/− mice when compared with that in wild-type controls (, CP−/− vs. CP+/+: P <0.05), and increased apoptosis ratio could be significantly reduced by TP treatment (, CP−/− TP vs. CP−/−: P <0.05). TP treatment had no effect on cell apoptosis in CP+/+ mice. (, CP+/+ TP vs. CP+/+: P >0.05).
Figura 3. El TP alivió la lesión por estrés oxidativo hepático y la apoptosis en los ratones CP−/−. En comparación con los ratones CP+/+, tras el tratamiento con TP todas las alteraciones experimentadas por los ratones CP−/− pudieron revertirse: la actividad de la SOD hepática se redujo significativamente, mientras que el nivel de MDA aumentó de manera significativa (. CP−/− TP vs. CP−/−: P <0.05). La ratio de células hepáticas positivas a TUNEL se encontró significativamente aumentada en los ratones CP−/− en comparación con la de los controles de tipo salvaje ()), CP−/− vs. CP+/+: P <0.05); el aumento de la ratio de apoptosis podría reducirse significativamente mediante el tratamiento con TP (, CP−/− TP vs. CP−/−: P <0.05). El tratamiento con TP no tuvo ningún efecto sobre la apoptosis celular en los ratones CP+/+ (, CP+/+ TP vs. CP+/+: P >0.05).
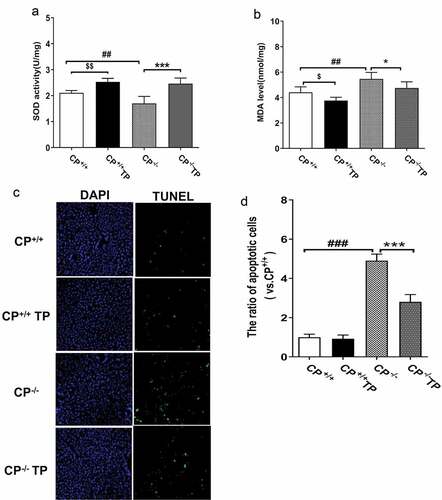
The ratio of TUNEL-positive cells was found to be significantly increased in liver tissue in CP−/− mice when compared with that in wild controls (, CP−/− vs. CP+/+: P < 0.05), and the increased apoptosis ratio in CP−/− mice was alleviated by TP treatment (, CP−/− TP vs. CP−/−: P < 0.05), indicating TP may improve hepatocyte survival in CP−/− mice by reducing apoptosis.
Intriguingly, significantly increased activity of SOD and decreased MDA level were also found in the liver of CP+/+ mice with TP treatment (, CP+/+ TP vs. CP+/+: all P < 0.05), indicating TP may also improve tissue oxidative stress under normal status. TP had no effect on hepatic apoptosis ratio in CP+/+ animals (, CP+/+ TP vs. CP+/+: P > 0.05).
TP treatment may improve hepatic expression of IRS2 and GLUT2 in CP−/− mice
In the present experiment, compared with CP+/+ mice, CP−/− mice exhibited reduced hepatic expression of IRS2 and GLUT2 at both mRNA (; CP−/− vs. CP+/+: all P < 0.05) and protein levels (); CP−/− vs. CP+/+: all P < 0.05), indicating impaired insulin signaling pathways in this animal model. Hepatic IRS2 and GLUT2 expression were found improved by TP treatment (, CP−/− TP vs. CP−/−: P < 0.05), indicating TP might improve hepatic insulin sensitivity by restoring GLUT2 and IRS2 gene expression. TP treatment had no effect on hepatic IRS2 and GLUT2 gene expression in the CP+/+ mice both at mRNA and protein levels (, CP+/+ TP vs. CP+/+: all P > 0.05).
Figure 4. TP treatment increased hepatic expression of IRS2 and GLUT2 in CP−/− mice. CP−/− mice exhibited reduced hepatic expression of IRS2 and GLUT2 at both mRNA (; CP−/− vs. CP+/+: all P <0.05) and protein levels (; CP−/− vs. CP+/+: all P <0.05). Hepatic IRS2 and GLUT2 expression were found improved by TP treatment at both mRNA and protein level in CP−/− mice (, CP−/− TP vs. CP−/−: P <0.05).
Figura 4. El tratamiento con TP aumentó la expresión hepática de IRS2 y GLUT2 en los ratones CP−/−. Los ratones CP−/− mostraron una expresión hepática reducida de IRS2 y GLUT2 en el ARNm (; CP−/− vs. CP+/+: todos P <0.05) y los niveles de proteína (; CP−/− vs. CP+/+: todos P <0.05). Se encontró que la expresión hepática de IRS2 y GLUT2 en los ratones CP−/− mejoró con el tratamiento con TP, tanto a nivel de ARNm como de proteínas (, CP−/− TP vs. CP−/−: P <0.05).
Discussion
Epidemiological studies have reported a positive association between high body iron stores and increased risk of obesity, metabolic disorders (Datz et al., Citation2013), insulin resistance, and type 2 diabetes (Montonen et al., Citation2012; Rajpathak et al., Citation2009). It has been found that, iron overload may lead to oxidative stress (Gammella et al., Citation2015; Lee et al., Citation2015), cell growth inhibition (Xia et al., Citation2019), cell apoptosis (Chen et al., Citation2014; Yang et al., Citation2017) and mitochondria damage (Shi et al., Citation2010; Volani et al., Citation2017; Zheng et al., Citation2018). Animal model with iron overload exhibited iron deposition in insulin-sensitive organs such as adipose tissue (Dongiovanni et al., Citation2013; Ma et al., Citation2017), skeletal muscle (Jahng et al., Citation2019) and liver (Zhou et al., Citation2019), which may lead to insulin resistance and diabetes. In addition, hepatocyte with iron overload was found to be associated with hepatocyte apoptosis (Han et al., Citation2017), increased oxidative stress and blunted response to insulin and insulin resistance (Varghese et al., Citation2018).
Ceruloplasmin (CP) is a multi-copper ferroxidase that facilitates the export of iron from cells and hence protects tissues from oxidative damage (Jeong & David, Citation2003; Olivieri et al., Citation2011). Individuals with mutations in the CP gene (Aceruloplasminemia) display significant iron deposition in the brain, liver and pancreas (Yoshida et al., Citation1995). And, CP deficiency (Jeong & David, Citation2003) or inactivated (Olivieri et al., Citation2011), was found to be participated in central nervous system diseases. However, studies about CP knockout animals were quite limited. Increased iron deposition and oxidative stress in brain (You et al., Citation2015) and liver (Guo et al., Citation2009) were found in CP−/− mice previously. In the present experiment, we have found that CP knockout caused hepatic iron deposition, increased oxidative stress and elevated ratio of hepatocyte apoptosis, which were all similar with the phenotype of Irp2−/− mice models (Zhou et al., Citation2019). Also in the present study, we are first to investigate the metabolic profile in CP−/− mice, which exhibited impaired glucose tolerance, insulin resistance and blundered insulin secretion after glucose stimulation. Reduced hepatic IRS2 and GLUT2 expression in CP−/− mice contributed to impaired hepatic insulin signaling pathway. Therefore, CP knockout may lead to insulin resistance and impaired insulin signaling pathways, which might be attribute to iron overload in insulin-sensitive organ such as liver. Similar studies in this animal model have been little performed previously.
Polyphenols are organic chemicals that contains several different groups of phenols. Flavonoids, phenolic acids, lignans, and stilbenes are four groups of polyphenols well identified. Polyphenols have been considered to have high antioxidant ability and free radical scavenging capacity (Li et al., Citation2014) and may improve metabolic disorders in diabetes (Dragan et al., Citation2015; Xiao & Hogger, Citation2015). In the present experiment, we have found that TP treatment improved hepatic iron overload in CP−/− mice, indicating TP might process tissue iron-chelating properties. Similar results has been described in iron-overload rats by Al-Basher GI that green tea extract reduced hepatic iron accumulation (Al-Basher, Citation2019). The detailed mechanisms still remain unknown. We assume this might be largely due to the effects of flavonoids, one of the main components of TP, on iron metabolism (Lesjak & Srai, Citation2019; Wang et al., Citation2021), which has been mostly described in recent years. Previous data have indicated that, some plant extract containing flavonoids, such as quercetin (Sajadi Hezaveh et al., Citation2019), and Taxifoin (Salama & Kabel, Citation2020), might improve tissue iron overload, and which might through increasing hepcidin expression via targeting Nrf2 signaling pathway (Granado-Serrano et al., Citation2012; Vanhees et al., Citation2011).
In the present study, we observed reduced hepatic oxidative stress and hepatocyte apoptosis, improved insulin sensitivity, and increased hepatic gene expression of IRS2 and GLUT2 in CP−/− mice with TP treatment. Evidences from recent years have indicated that TP may achieve anti-oxidative effects (Cai et al., Citation2002; Dai et al., Citation2008) , improve glucose metabolism by improving tissue insulin signaling pathway, reducing tissue inflammation (Xia et al., Citation2019), and reducing carbohydrate uptake in intestine (Kobayashi et al., Citation2000). TP may also improve hepatocyte mitochondria functions (Qi et al., Citation2018), prevent cell apoptosis through caspase-3 dependent pathway (Diao et al., Citation2019), ameliorate oxidative stress and inflammation (Wang et al., Citation2020), improve lipid metabolism and insulin resistance by upregulation AMPK pathway (Tan et al., Citation2017) . Therefore, the protective effects of TP on CP−/−mice might be archived by its iron-chelating, anti-oxidative stress, anti-apoptosis and restoring hepatic insulin signaling pathways.
In this study, relative blundered insulin secretion after glucose administration was noticed in CP−/− mice, which is inconsistent with previous result we performed in IRP−/− mice (Zheng et al., Citation2018). While in the experiment performed by Shu et al. impaired insulin secretion was found in iron overloaded beta-cells caused by low hepcidin level (Shu et al., Citation2019). Therefore, different research model might cause the diverse. More detailed in vitro study of the functions of beta-cell from CP−/− mice should be performed.
Conclusions
CP knockout may lead to hyperglycemia. Increased hepatic oxidative stress, apoptosis, and impaired insulin signaling orchestrated by iron overload may lead to hepatic insulin resistance, contributing to the pathogenesis of abnormal glucose metabolism. TP could improve glucose homeostasis in CP−/− mice by reducing liver iron overload, alleviating hepatic oxidative stress, apoptosis, and restore hepatic insulin singling pathways.
Disclosure statement
No potential conflict of interest was reported by the author(s).
Additional information
Funding
References
- Al-Basher, G. I. (2019). Green tea activity and iron overload induced molecular fibrogenesis of rat liver. Saudi Journal of Biological Sciences, 26(3), 531–540. https://doi.org/10.1016/j.sjbs.2017.08.007
- Cai, Y. J., Ma, L. P., Hou, L. F., Zhou, B., Yang, L., & Liu, Z. L. (2002). Antioxidant effects of green tea polyphenols on free radical initiated peroxidation of rat liver microsomes. Chemistry and Physics of Lipids, 120(1–2), 109–117. https://doi.org/10.1016/S0009-3084(02)00110-X
- Chacko, S. M., Thambi, P. T., Kuttan, R., & Nishigaki, I. (2010). Beneficial effects of green tea: A literature review. Chinese Medicine, 5(1), 13. https://doi.org/10.1186/1749-8546-5-13
- Chen, M. P., Cabantchik, Z. I., Chan, S., Chan, G. C., Cheung, Y. F., & Obukhov, A. G. (2014). Iron overload and apoptosis of HL-1 cardiomyocytes: Effects of calcium channel blockade. PLoS One, 9(11), e112915. https://doi.org/10.1371/journal.pone.0112915
- Cheng, J., Tan, Y., Zhou, J., Xiao, L., Johnson, M., & Qu, X. (2020). Green tea polyphenols ameliorate metabolic abnormalities and insulin resistance by enhancing insulin signaling in skeletal muscle of Zucker fatty rats. Clinical Science, 134(10), 1167–1180. https://doi.org/10.1042/CS20200107
- Chung, E., Campise, S. N., Joiner, H. E., Tomison, M. D., Kaur, G., Dufour, J. M., Cole, L., Ramalingam, L., Moustaid-Moussa, N., & Shen, C. -L. (2019). Effect of annatto-extracted tocotrienols and green tea polyphenols on glucose homeostasis and skeletal muscle metabolism in obese male mice. The Journal of Nutritional Biochemistry, 67, 36–43. https://doi.org/10.1016/j.jnutbio.2019.01.021
- Dai, F., Chen, W. F., & Zhou, B. (2008). Antioxidant synergism of green tea polyphenols with alpha-tocopherol and L-ascorbic acid in SDS micelles. Biochimie, 90(10), 1499–1505. https://doi.org/10.1016/j.biochi.2008.05.007
- Datz, C., Felder, T. K., Niederseer, D., & Aigner, E. (2013). Iron homeostasis in the metabolic syndrome. European Journal of Clinical Investigation, 43(2), 215–224. https://doi.org/10.1111/eci.12032
- Diao, J. X., Ou, J. Y., Dai, H., Li, H. Y., Huang, W., Hua, H. Y., Xie, T., Wang, M., & Yang, Y. -G. (2019). Antioxidant and antiapoptotic polyphenols from green tea extract Ameliorate CCl4-induced acute liver injury in mice. Chinese Journal of Integrative Medicine, 26(10), 736–744. https://doi.org/10.1007/s11655-019-3043-5
- Dongiovanni, P., Ruscica, M., Rametta, R., Recalcati, S., Steffani, L., Gatti, S., Girelli, D., Cairo, G., Magni, P., Fargion, S., & Valenti, L. (2013). Dietary iron overload induces visceral adipose tissue insulin resistance. The American Journal of Pathology, 182(6), 2254–2263. https://doi.org/10.1016/j.ajpath.2013.02.019
- Dragan, S., Andrica, F., Serban, M. C., & Timar, R. (2015). Polyphenols-rich natural products for treatment of diabetes. Current Medicinal Chemistry, 22(1), 14–22. https://doi.org/10.2174/0929867321666140826115422
- Dulal, H. P., Lamsal, M., Sharma, S. K., Baral, N., & Majhi, S. S. (2014). Status of iron, oxidant and antioxidants in chronic type 2 diabetes mellitus patients. Nepal Medical College Journal : NMCJ, 16(1), 54–57.
- Fleming, R. E., & Ponka, P. (2012). Iron overload in human disease. The New England Journal of Medicine, 366(4), 348–359. https://doi.org/10.1056/NEJMra1004967
- Gammella, E., Recalcati, S., Rybinska, I., Buratti, P., & Cairo, G. (2015). Iron-Induced damage in cardiomyopathy: Oxidative-dependent and independent mechanisms. Oxidative Medicine and Cellular Longevity, 2015, 230182. https://doi.org/10.1155/2015/230182
- Granado-Serrano, A. B., Martín, M. A., Bravo, L., Goya, L., & Ramos, S. (2012). Quercetin modulates Nrf2 and glutathione-related defenses in HepG2 cells: Involvement of p38. Chemico-Biological Interactions, 195(2), 154–164. https://doi.org/10.1016/j.cbi.2011.12.005
- Guo, P., Cui, R., Chang, Y. Z., Wu, W. S., Qian, Z. M., Yoshida, K., Qiao, Y. -T., Takeda, S., & Duan, X. -L. (2009). Hepcidin, an antimicrobial peptide is downregulated in ceruloplasmin-deficient mice. Peptides, 30(2), 262–266. https://doi.org/10.1016/j.peptides.2008.09.017
- Han, S., Tang, Q., Chen, R., Li, Y., Shu, J., & Zhang, X. (2017). Hepatic iron overload is associated with hepatocyte apoptosis during Clonorchis sinensis infection. BMC Infectious Diseases, 17(1), 531. https://doi.org/10.1186/s12879-017-2630-3
- Jahng, J. W. S., Alsaadi, R. M., Palanivel, R., Song, E., Hipolito, V. E .B., Sung, H. K., Botelho, R. J., Russell, R. C., & Sweeney, G. (2019). Iron overload inhibits late stage autophagic flux leading to insulin resistance. EMBO Reports, 20(10), e47911. https://doi.org/10.15252/embr.201947911
- Jeong, S. Y., & David, S. (2003). Glycosylphosphatidylinositol-Anchored ceruloplasmin is required for iron efflux from cells in the central nervous system. Biometals, 278, 27144–27148. https://doi.org/10.1074/jbc.M301988200
- Kim, T. I., Lee, Y. K., Park, S. G., Choi, I. S., Ban, J. O., Park, H. K., Nam, S. -Y., Yun, Y. W., Han, S. B., Oh, K. W., & Hong, J. T. (2009). l-Theanine, an amino acid in green tea, attenuates β-amyloid-induced cognitive dysfunction and neurotoxicity: Reduction in oxidative damage and inactivation of ERK/p38 kinase and NF-κB pathways. Free Radical Biology & Medicine, 47(11), 1601–1610. https://doi.org/10.1016/j.freeradbiomed.2009.09.008
- Kobayashi, Y., Suzuki, M., Satsu, H., Arai, S., Hara, Y., Suzuki, K., Miyamoto, Y., & Shimizu, M. (2000). Green tea polyphenols inhibit the sodium-dependent glucose transporter of intestinal epithelial cells by a competitive mechanism. Journal of Agricultural and Food Chemistry, 48(11), 5618–5623. https://doi.org/10.1021/jf0006832
- Lee, H. J., Choi, J. S., Lee, H. J., Kim, W. H., Park, S. I., & Song, J. (2015). Effect of excess iron on oxidative stress and gluconeogenesis through hepcidin during mitochondrial dysfunction. The Journal of Nutritional Biochemistry, 26(12), 1414–1423. https://doi.org/10.1016/j.jnutbio.2015.07.008
- Lesjak, M., & Srai, K. S. (2019). Role of dietary flavonoids in iron homeostasis. Pharmaseuticals (Basel), 12. https://doi.org/10.3390/ph12030119
- Li, A. N., Li, S., Zhang, Y. J., Xu, X. R., Chen, Y. M., & Li, H. B. (2014). Resources and biological activities of natural polyphenols. Nutrients, 6(12), 6020–6047. https://doi.org/10.3390/nu6126020
- Mandel, S. A., Amit, T., Kalfon, L., Reznichenko, L., Weinreb, O., Youdim, M. B., & Chohan, M. O. (2008). Cell signaling pathways and iron chelation in the neurorestorative activity of green tea polyphenols: Special reference to epigallocatechin gallate (EGCG). Journal of Alzheimer’s Disease, 15(2), 211–222. https://doi.org/10.3233/JAD-2008-15207
- Ma, X., Pham, V. T., Mori, H., MacDougald, O. A., Shah, Y. M., Bodary, P. F., & Aalto-Setala, K. (2017). Iron elevation and adipose tissue remodeling in the epididymal depot of a mouse model of polygenic obesity. PLoS One, 12(6), e0179889. https://doi.org/10.1371/journal.pone.0179889
- Meynard, D., Babitt, J. L., & Lin, H. Y. (2014). The liver: Conductor of systemic iron balance. Blood, 123(2), 168–176. https://doi.org/10.1182/blood-2013-06-427757
- Montonen, J., Boeing, H., Steffen, A., Lehmann, R., Fritsche, A., Joost, H. G., Schulze, M. B., & Pischon, T. (2012). Body iron stores and risk of type 2 diabetes: Results from the European Prospective Investigation into Cancer and Nutrition (EPIC)-Potsdam study. Diabetologia, 55(10), 2613–2621. https://doi.org/10.1007/s00125-012-2633-y
- Nikooyeh, B., & Neyestani, T.R. (2016). Oxidative stress, type 2 diabetes and vitamin D: Past, present and future. Diabetes/Metabolism Research and Reviews, 32(3), 260–267. https://doi.org/10.1002/dmrr.2718
- Olivieri, S., Conti, A., Iannaccone, S., Cannistraci, C. V., Campanella, A., Barbariga, M., Codazzi, F., Pelizzoni, I., Magnani, G., Pesca, M., Franciotta, D., Cappa, S. F., & Alessio, M. (2011). Ceruloplasmin oxidation, a feature of Parkinson’s disease CSF, inhibits ferroxidase activity and promotes cellular iron retention. Journal of Neuroscience, 31(50), 18568–18577. https://doi.org/10.1523/JNEUROSCI.3768-11.2011
- Qi, G., Wu, W., Mi, Y., Shi, R., Sun, K., Li, R., Liu, X., & Liu, X. (2018). Tea polyphenols direct Bmal1-driven ameliorating of the redox imbalance and mitochondrial dysfunction in hepatocytes. Food and Chemical Toxicology, 122, 181–193. https://doi.org/10.1016/j.fct.2018.10.031
- Rajpathak, S. N., Crandall, J. P., Wylie-Rosett, J., Kabat, G. C., Rohan, T. E., & Hu, F. B. (2009). The role of iron in type 2 diabetes in humans. Biochimica et Biophysica Acta (BBA) - General Subjects, 1790(7), 671–681. https://doi.org/10.1016/j.bbagen.2008.04.005
- Sajadi Hezaveh, Z., Azarkeivan, A., Janani, L., Hosseini, S., & Shidfar, F. (2019). The effect of quercetin on iron overload and inflammation in β-thalassemia major patients: A double-blind randomized clinical trial. Complementary Therapies in Medicine, 46, 24–28. https://doi.org/10.1016/j.ctim.2019.02.017
- Salama, S. A., & Kabel, A. M. (2020). Taxifolin ameliorates iron overload-induced hepatocellular injury: Modulating PI3K/AKT and p38 MAPK signaling, inflammatory response, and hepatocellular regeneration. Chemico-Biological Interactions, 330, 109230. https://doi.org/10.1016/j.cbi.2020.109230
- Sanchez-Valle, V., Chavez-Tapia, N. C., Uribe, M., & Mendez-Sanchez, N. (2012). Role of oxidative stress and molecular changes in liver fibrosis: A review. Current Medicinal Chemistry, 19(28), 4850–4860. https://doi.org/10.2174/092986712803341520
- Shi, Z. H., Nie, G., Duan, X. L., Rouault, T., Wu, W. S., Ning, B., Zhang, N., Chang, Y. -Z., & Zhao, B. -L. (2010). Neuroprotective mechanism of mitochondrial ferritin on 6-hydroxydopamine-induced dopaminergic cell damage: Implication for neuroprotection in Parkinson’s disease. Antioxidants & Redox Signaling, 13(6), 783–796. https://doi.org/10.1089/ars.2009.3018
- Shu, T., Lv, Z., Xie, Y., Tang, J., & Mao, X. (2019). Hepcidin as a key iron regulator mediates glucotoxicity-induced pancreatic β-cell dysfunction. Endocrine Connections, 8(3), 150–161. https://doi.org/10.1530/EC-18-0516
- Tan, Y., Kim, J., Cheng, J., Ong, M., Lao, W. G., Jin, X. L., Lin, Y. -G., Xiao, L., Zhu, X. -Q., & Qu, X. -Q. (2017). Green tea polyphenols ameliorate non-alcoholic fatty liver disease through upregulating AMPK activation in high fat fed Zucker fatty rats. World Journal of Gastroenterology, 23(21), 3805–3814. https://doi.org/10.3748/wjg.v23.i21.3805
- Vanhees, K., Godschalk, R. W., Sanders, A., van Waalwijk van Doorn-Khosrovani, S. B., & van Schooten, F. J. (2011). Maternal quercetin intake during pregnancy results in an adapted iron homeostasis at adulthood. Toxicology, 290(2–3), 350–358. https://doi.org/10.1016/j.tox.2011.10.017
- Varghese, J., James, J., Vaulont, S., McKie, A., & Jacob, M. (2018). Increased intracellular iron in mouse primary hepatocytes in vitro causes activation of the Akt pathway but decreases its response to insulin. Biochimica et Biophysica Acta (BBA) - General Subjects, 1862(9), 1870–1882. https://doi.org/10.1016/j.bbagen.2018.05.022
- Volani, C., Doerrier, C., Demetz, E., Haschka, D., Paglia, G., Lavdas, A. A., Gnaiger, E., & Weiss, G. (2017). Dietary iron loading negatively affects liver mitochondrial function. Metallomics, 9(11), 1634–1644. https://doi.org/10.1039/C7MT00177K
- Wang, D., Gao, Q., Wang, T., Kan, Z., Li, X., Hu, L., Peng, C. -Y., Qian, F., Wang, Y., & Granato, D. (2020). Green tea polyphenols and epigallocatechin-3-gallate protect against perfluorodecanoic acid induced liver damage and inflammation in mice by inhibiting NLRP3 inflammasome activation. Food Research International, 127, 108628. https://doi.org/10.1016/j.foodres.2019.108628
- Wang, X., Li, Y., Han, L., Li, J., Liu, C., & Sun, C. (2021). Role of Flavonoids in the treatment of iron overload. Frontiers in Cell and Developmental Biology, 9, 685364. https://doi.org/10.3389/fcell.2021.685364
- Wu, W. S., Zhao, Y. S., Shi, Z. H., Chang, S. Y., Nie, G. J., Duan, X. L., Zhao, S. -M., Wu, Q., Yang, Z. -L., Zhao, B. -L., & Chang, Y. -Z. (2013). Mitochondrial ferritin attenuates β -amyloid-induced neurotoxicity: Reduction in oxidative damage through the Erk/P38 mitogen-activated protein kinase pathways. Antioxidants & Redox Signaling, 18(2), 158–169. https://doi.org/10.1089/ars.2011.4285
- Xiao, J. B., & Hogger, P. (2015). Dietary polyphenols and type 2 diabetes: Current insights and future perspectives. Current Medicinal Chemistry, 22(1), 23–38. https://doi.org/10.2174/0929867321666140706130807
- Xia, H. M., Wang, J., Xie, X. J., Xu, L. J., & Tang, S. Q. (2019). Green tea polyphenols attenuate hepatic steatosis, and reduce insulin resistance and inflammation in high-fat diet-induced rats. International Journal of Molecular Medicine, 44(4), 1523–1530. https://doi.org/10.3892/ijmm.2019.4285
- Xia, D., Wu, J., Xing, M., Wang, Y., Zhang, H., Xia, Y., Zhou, P., & Xu, S. (2019). Iron overload threatens the growth of osteoblast cells via inhibiting the PI3K/AKT/FOXO3a/DUSP14 signaling pathway. Journal of Cellular Physiology, 234(9), 15668–15677. https://doi.org/10.1002/jcp.28217
- Yang, F., Li, Y., Yan, G., Liu, T., Feng, C., Gong, R., Yuan, Y., Ding, F., Zhang, L., Idiiatullina, E., Pavlov, V., Han, Z., Ma, W., Huang, Q., Yu, Y., Bao, Z., Wang, X., Hua, B., Du, Z., … Yang, L. (2017). Inhibition of iron overload-induced apoptosis and necrosis of bone marrow mesenchymal stem cells by melatonin. Oncotarget, 8(19), 31626–31637. https://doi.org/10.18632/oncotarget.16382
- Yoshida, K., Furihata, K., Takeda, S., Nakamura, A., Yamamoto, K., Morita, H., Hiyamuta, S., Ikeda, S. -I., Shimizu, N., & Yanagisawa, N. (1995). A mutation in the ceruloplasmin gene is associated with systemic hemosiderosis in humans. Nature Genetics, 9(3), 267–272. https://doi.org/10.1038/ng0395-267
- You, L. H., Li, F., Wang, L., Zhao, S. E., Wang, S. M., Zhang, L. L., Zhang, L. -H., Duan, X. -L., Yu, P., & Chang, Y. -Z. (2015). Brain iron accumulation exacerbates the pathogenesis of MPTP-induced Parkinson’s disease. Neuroscience, 284, 234–246. https://doi.org/10.1016/j.neuroscience.2014.09.071
- Zheng, Q., Zhao, Y., Guo, J., Zhao, S., Fei, C., Xiao, C., Wu, D., Wu, L., Li, X., & Chang, C. (2018). Iron overload promotes mitochondrial fragmentation in mesenchymal stromal cells from myelodysplastic syndrome patients through activation of the AMPK/MFF/Drp1 pathway. Cell Death & Disease, 9(5), 515. https://doi.org/10.1038/s41419-018-0552-7
- Zhou, Y., Wu, W., Xu, Z., Liu, Y., Chang, H., Yu, P., Zhang, X., Yang, Y., Liu, K., & Chang, Y. (2019). Iron regulatory protein 2 deficiency may correlate with insulin resistance. Biochemical and Biophysical Research Communications, 510(2), 191–197. https://doi.org/10.1016/j.bbrc.2019.01.022
- Zhou, Y., Yang, Y., Liu, Y., Chang, H., Liu, K., Zhang, X., & Chang, Y. (2019). Irp2 knockout causes osteoporosis by inhibition of bone remodeling. Calcified Tissue International, 104(1), 70–78. https://doi.org/10.1007/s00223-018-0469-2