
 ?Mathematical formulae have been encoded as MathML and are displayed in this HTML version using MathJax in order to improve their display. Uncheck the box to turn MathJax off. This feature requires Javascript. Click on a formula to zoom.
ABSTRACT
This study investigated the proximate, cyanide, and glycemic indices of roots and eba (gari dough) made from improved cassava cultivars. Twenty cassava cultivars were obtained from the IITA research farms and analyzed for proximate and carbohydrate compositions and cyanogenic potential using standard procedures. Afterward, four cassava varieties were selected using the agglomerate hierarchical cluster analysis. The selected varieties were processed into gari and reconstituted in hot water into eba, and the glycemic indices(GIs) of the four eba samples were determined in apparently 23 healthy volunteers. The starch content of the selected varieties was 69.1% for IITATMEB7419, 71.6% for TMSIBA980505, 72.7% for TMSIBA981089A, and 74.5% for TMSIBA980002. The ratios of starch to sugar were significantly (p > 0.05) comparable for all the samples. The GIs obtained for the four eba samples were 88.1% for TMSIBA980002; 87.2% for TMS980505; 84.4% for TMEB7419, and 89.1% for TMS IBA961089A.
1. Introduction
The Glycemic Index (GI) ranks carbohydrates in foods according to how they influence blood glucose levels (Candindo et al., Citation2013). Two foods with equal amounts of carbohydrates may have different glycemic index numbers depending on the type of carbohydrates contained in the food. The effect of food on blood sugar levels decreases with decreasing carbohydrate content. For example, 55 or less are classified as low (good), 56–69 as a medium, and above 70 are considered high and harmful considering the contributions made to molecular body development (Sacks et al., Citation2014). The rate at which digested starch is absorbed into body cells depends on the effectiveness of the metabolic system and responses to a consumed meal (Parada et al., Citation2019). Previous research findings on the starch digestibility of rich foods have shown that slowly digested, and absolvable carbohydrates are favorable to the dietary management of non-communicable diseases such as obesity, diabetes, and hyperlipidemia (Ang & Linn, Citation2014). This depends on the digested nutrients from the food matrix, absorbed by intestinal cells and transported to body cells.
Most foods available to most African families, especially in Nigeria, are rich in carbohydrates (Chakona & Shackleton, Citation2019). Some of these carbohydrates elicit a quicker glucose response from insulin than others due to differences in how glucose is produced and released into the bloodstream (Eli-Cophie et al., Citation2017). And this depends on the effectiveness of the metabolic system that utilizes them for oxidation. In determining the glycemic index of carbohydrate food, the postprandial glycemic response of a food is measured against a reference food (Candindo et al., Citation2013). One of Africa’s most made available cassava-based product foods is gari. The importance of this food cannot be overemphasized in Nigeria.
Gudi et al. (Citation2019) say gari is a dry, crispy, creamy-white, granular cassava product. It is the most popular form in which cassava is consumed in Nigeria and West Africa. In the production of gari, cassava roots are peeled, grated, fermented, dewatered, sieved, and roasted. It is vital to ensure that each unit operation is monitored carefully, as it may make or mar the quality of the final product. These processes have been found to effectively reduce the residual cyanide content of the product (Ojo & Akande, Citation2013). In Nigeria, gari is widely accepted and consumed by all social classes and is a significant source of carbohydrates. It can be consumed in various forms, either as a gelatinized form called eba, with stew, or drunk by soaking in water with groundnut, mashed beans, bean cake (akara), or bean pudding (moin-moin). However, a few studies examined traditional products’ antioxidant and anti-hyperglycaemic activities from yellow-fleshed cassava and maize genotypes (Babajide et al., Citation2022; Elemosho et al., Citation2021). Babajide et al. (Citation2022) reported that “lafun” from different genotypes of yellow-fleshed cassava had the most potent antioxidant and starch-digesting enzymes inhibitory activities and the least glucose responses.
The consumption of high-carbohydrate foods has been associated with an increased risk of Diabetes mellitus, obesity, cardiovascular diseases, and some cancers (Medina-Remon et al., Citation2018). Epidemiology and dietary intervention research findings have suggested that low GI diets are more beneficial for managing blood glucose control than the consumption of high GI foods that contribute to insulin resistance (Unwin et al., Citation2016). Therefore, it is necessary to assess the proximate, cyanogenic potential and glycemic indices of various cassava varieties that can be purchased in local markets and used to make cooked gari paste (eba) when consumed by healthy individuals. Thus, this study determines the proximate, cyanogenic potential and glycemic indices of the cassava-based product (gari) and eba made from the selected cassava cultivars grown and consumed in Nigeria.
2. Materials and method
2.1. Materials
Twenty cassava varieties from IITA cassava breeding fields were harvested 12 months after planting and characterized for proximate and carbohydrate components. Four cassava varieties were selected based on the total free reducing sugars and starch content and processed into gari. The varieties are IITA TMSIBA980002, IITA TMS980505, IITA TMEB7419, and IITA TMS IBA961089A. These varieties were analyzed for moisture, ash, protein, fat, dietary fiber, amylose, amylopectin, free sugar, total starch, and in-vivo glycemic index determination. The equipment used included knives, cutting boards, bowls, big and small sample bags, clean tap water, a soft sponge, brown sample bags, and a drying oven.
2.1.1. Processing of cassava roots
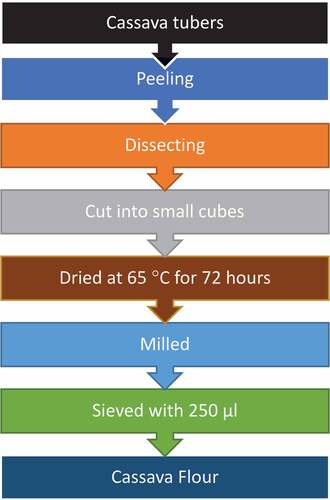
Cassava flour samples were prepared according to Ooye et al. (Citation2014) (). Freshly harvested cassava roots were washed to remove contaminants and soil particles, then dried with the soft absorbent paper. After that, the washed roots were cut into four equal parts longitudinally, cut into cubes, weighed into brown sample bags, and put into the oven at 65°C for 72 h. The dried samples were milled using a Hammermill (Laboratory Mill 310, Perten) of 250 µm sieve size and packed inside airtight polyethylene sample bags.
Figure 1. The flow chart of production of cassava flour.
2.1.2. Production of gari
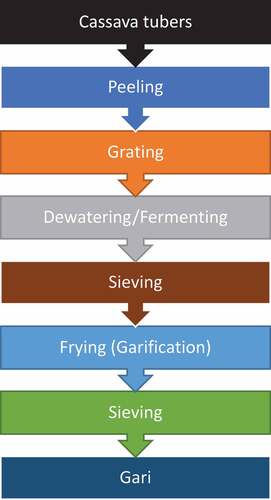
Cassava roots were processed according to the traditional method of processing cassava roots into gari described by Ramota Karim et al. (Citation2015) (). Twenty kg of each mature cassava variety cultivar roots were randomly obtained from the IITA Ibadan research farm, Nigeria, and carefully peeled (manually). The pulp was washed thoroughly to remove dirt. The washed pulp was grated into a mash, packed into black pots covered with a plastic lid, and left to ferment for three days at ambient temperature. Then, the 5 kg fermented mash was packed in bags and pressed with a screw press to extrude the water. The cake was crushed manually in the fiber sieve before roasting over a low and increased fire and heat. The gari was allowed to cool, then packed in airtight polyethylene bags.
Figure 2. The flow chart of production of gari.
2.2. Methods
2.2.1. Cyanogenic potential (CNP) analysis
2.2.1.1. Extraction procedure
The cyanogenic potential analysis of cassava roots and gari was carried out following the method reported by Emmanuel et al. (Citation2012). Samples (15 g) were weighed into 250 ml of 0.1 M orthophosphoric acid and homogenized using a laboratory blender for 30 seconds (low speed) and 1 minute (high speed). The homogenates were centrifuged (3500 rpm) for 10 minutes to collect the extract for analysis, and the extracts were the supernatants. The extracts were analyzed for CNP using a Pulse Instrumentation Auto analyzer machine.
2.2.1.2. Determination of CNP
The sample extracts were mixed with phosphate buffer pH 7.0 Linamarase containing 3-unit ml-1 activity. This was allowed to hydrolyze the bond cyanide (cyano substituted glycosides) while integrated with the samples in a heating bath coil maintained at 45°C. When the free cyanide and monoglycosides were determined, the enzyme bi-phosphate buffers were pH 6.0 and McIlvaine buffer pH 4.0. Linamarase breaks down the cyano-substituted glycosides to appropriate cyanohydrin to dissociate into hydrogen cyanide rapidly above pH 6.0. When diffused through the dialyzer, the cyanide enters the stream of NaOH (0.1 N). The reaction with chloramine T, isonicotinate, and dimethyl barbiturate forms a red complex that can be converted and quantified colorimetrically using a standard curve generated from commercial Linamarin. The regression (R2 = 0.99) curve used was y = 8.043e2x + 2.7476e3.
The calculation for cyanide extraction and quantification is as follows:
Where mgHCN/l was obtained from the calibration curve of standard solution at 5 ug/ml, 10 ug/ml, 20 ug/ml, 30 ug/ml, and 40 ug/ml.
Where:
Total volume of extracts = 250 mL.
Weight of the flour used = 30 g
2.2.2. Dry matter analysis
Total dry matter was determined for cassava roots and flour according to (Benesi et al., Citation2005) and reported by Cuvaca et al. (Citation2015). The moisture content percentages were determined using the standard method (AOAC, Citation2000).
2.2.2.1. Procedure
Samples (2 g) were weighed accurately into a pre-weighed clean weighing/drying dish (can) with an easily removable lid. The uncovered dish and lid were placed in a well-ventilated oven (Memmert, Germany) maintained at 103 ± 2°C for 24 h. After 24 h, the cap was replaced and transferred to a desiccator to cool at room temperature (about 30 minutes.) The cooled can and its contents were weighed as quickly as possible.
Calculation
Where M2 = weight in (g) of dish, lid, and sample after drying
M1= weight in (g) of dish, lid, and sample before drying
M0 = weight in (g) of dish and lid only.
Note that M1 - M0=weight of sample prepared for drying
2.2.3. Determination of crude protein (Kjeidah Nitrogen method)
The percentage of protein was determined using the standard method (AOAC, Citation2000).
2.2.3.1. Procedure
Briefly weigh 0.20 g of dried sample into a digestion tube with 4 ml of H2S04, and add one kjeldahl catalyst tablet. The tubes were put into the Protein digester manufactured by FOSS Scientific (Sweden) pre-set at 375°C. The samples were allowed to digest until a gray color was obtained.
Calculation
Where N = Normality of the acid
Therefore % crude protein = % total Nitrogen × conversion factor
Conversion factor use: 6.25
2.2.4. Determination of ash content
The percentage of ash content was determined using the standard method (AOAC, Citation2000).
2.2.4.1. Procedure
Briefly weigh 2–3 g of dried material into an empty porcelain crucible previously ignited, cooled in a desiccator, and weighed. Then arrange the samples in a muffle furnace (Dentsply/Vulcan, USA) at a temperature of 600°C for 6 hours; then, transfer the crucible with the samples directly into a desiccator; cool and weigh immediately.
Calculation
2.2.5. Determination of fat
The percentages of fat content were determined using the standard method (AOAC, Citation2000).
2.2.5.1. Procedure
Place samples of 2–3 g into thimbles, plug them with cotton wool and insert them into the Soxtex HT. The extraction cups were dried and pre-weighed; 25–50 ml of the solvent was dispensed into each cup and inserted into Soxtec HT (FOSS Scientific, Sweden). Samples were extracted for 15–20 minutes in a “boiling position” and 30–45 minutes in a “rinsing position.” The solvents were evaporated and re-condensed into a recovery chamber. Cool the cups in a desiccator and weigh them.
Calculation
Weight of the can with the extracted oil = W3.
Weight of the empty can = W2
Weight of sample = W1
2.2.6. Analysis of free sugars and total starch in root flour and gari
The total starch and reducing sugars were determined using the method of Dubois et al. (Citation1956) and Albalasmeh et al. (Citation2013).
2.2.6.1. Sample preparation
About 0.02–0.03 g of prepared samples were weighed into the centrifuge tubes, and then we added 1.0 mL of ethanol and 2.0 mL of distilled water. Ten mL of hot ethanol was added to the mixture vortex and centrifuged for 10 mins at 2000 rpm, then the supernatant was decanted into the test tube and made up to 20 ml of the extract.
2.2.6.2. Color development
An aliquot of 0.01 to 2 ml of extract (0.2 ml) was used for the assay. Distilled water (0.8 ml) with 0.5 ml of 5% phenol was vortexed using a vortex mixer manufactured by Thomas Scientific (USA) with 2.50 ml of concentrated H2S04. Then the solution was cooled and read for absorbance using a Spectrophotometer (manufactured by Thermo-Fisher Scientific/Genesys, USA) at 490 nm.
2.2.6.3. Analysis of starch
To the residue from sugar analysis, 7.5 ml of perchloric acid was added and allowed to stand for 1 hour. The hydrolysate and 17.5 ml distilled water are made up to 25 ml in the centrifuge tube and filtered. A portion of 0.05 ml of the filtrate was diluted with 0.95 ml of distilled water and vortexed before assaying. Color development was done with phenol and H2S04, and the absorbance at 490 nm using a spectrophotometer (Thermo-Fisher Scientific/Genesys, USA) was recorded.
Calculation
Where A = Absorbance of sample
I = Intercept of sample
D.F. = Dilution factor (depends on aliquot taken for assay).
V = Volume
B = Slope of the standard curve
W = Weight of the sample
2.2.7. Determination of amylose
The percentages of Amylose content of samples were determined as reported by Idowu et al. (Citation2013). 0.1 g or 100 mg weighed into a centrifuge tube with 1 ml of 95% ethanol and 9 ml of 1 N NaOH and well mixed. Samples were heated for 10 minutes in a 25-model reciprocal shaking water bath (Precision, USA) to gelatinize the starch content before being cooled. The total sample volume should contain 10 ml of extract. Extracts were diluted 10 times with an aliquot of 0.5 ml of the digest for analysis. 1 ml of extract was added to 0.1 ml of acetic acid solution with 0.2 ml of iodine solution was made up to 10 ml with 9.2 ml of distilled water. The samples are left for 20 mins for color development, vortexed, and read in a spectrophotometer at 620 nm.
Calculation
2.2.8. Determination of total dietary fiber (TDF)
The percentage of total dietary fiber was determined using Prosky et al. (Citation1985) and Infante et al. (Citation2013).
2.2.8.1. Procedure
Briefly, 0.01 g of a sample was digested with thermostable α-amylase (Sigma) at pH 6.0 for 30 min at 100°C and cooled. Then, the pH was adjusted to 7.5 and incubated with protease VIII (Sigma) for 30 min at 60°C. After cooling, the sample was adjusted to pH 4.5 and incubated with amyloglucosidase at 60°C for 30 min. The sample was precipitated and pre-weighed in crucibles containing celite (Sigma Chemical Co.), filtering the phase digested by the above enzymes. The residue was washed with ethanol and acetone.
Protein and ash were determined as described by Prosky et al. (Citation1985) and reported by Phillips et al. (Citation2019), the AOAC gravimetric method nº 955.29 (15). The TDF was determined through protein and ash determinations. One residue from each type of fiber was analyzed for protein, and the second residue of the duplicate for ash. The TDF was calculated based on the results of ash and protein.
Calculation
R1 = residue weight 1 from m1;
R2 = residue weight 2 from m2;
m1 = sample weight 1;
m2 = sample weight 2
A = ash weight from R1;
p = protein weight from R2
B = blank
Where: BR = blank residue;
BP = blank protein from BR1 BA = blank ash from BR2
2.2.9. Determination of available carbohydrates
The determinations were by recommendations of FAO (Citation2003) and reported by Nasreen and Azeem (Citation2020). The available carbohydrate was calculated by difference (direct analysis) and was determined through in 100 g of food. This is the percentage of carbohydrates that can be broken down by human enzymes, absorbed, and then used in the intermediary metabolism.
2.2.9.1. Procedure
The twenty varieties of cassava flour and the four select cassava varieties of gari were determined with the analyzed proximate results of cassava varieties flour and gari varieties. This was determined by subtracting the total dietary from the total carbohydrate to determine the available carbohydrate.
2.2.10. Determination of glycaemic index of gari using apparently healthy human subjects
The vivo glycemic was carried out in line with the method of glycaemic indexing of food using modified versions of the methods of Wolever et al. (Citation1991) and Anyakudo (Citation2014) to determine GI in 50 healthy-looking volunteers were randomly selected for cross-examination on the first day, out of which 23 healthy volunteers were chosen for this study. The excluded volunteers were based on the reported history of gastrointestinal disorders or taking medication for chronic disease conditions, pregnancy, breastfeeding, or some form of intolerance or allergy to cassava foods. After that, they were screened for a high level of blood glucose. Twenty-three participants were selected for the study based on the screen results.
Ten subjects were randomly selected for each food test; eba, a paste made by constituting gari with boiled water and stirring to form a paste. The twenty-three participants were randomly used to access the four gari samples and the reference glucose to minimize physiological variations that may arise from using too many participants. The prepared eba was served with ewedu. The ewedu soup was prepared by picking the green leaves on the stalk, de-veined the leaves, and finely chopping using a blender before pouring them into boiled water to cook with the addition of salt. FAO (Citation2003) recommendations were used for measuring and calculating the GI of the foods, as reported by Wolever et al. (Citation2015). Subjects were instructed to have 10 hours overnight fast and not consume large meals, drink alcohol, or exercise vigorously on the previous day before the testing day.
2.2.11. Determination of blood glucose response after consumption
The research protocol, the consent forms, and other participant information materials were evaluated by the University of Ibadan/University College Hospital(UI/UCH) Ethics Committee (NHREC/05/0 l/2008a) and gave final permission with the registration number UI/EC/17/0230.
The 23 informed volunteers with documented normal fasting blood glucose results were fed 50 g of anhydrous glucose in 250 ml of water on the first and second days to serve as a control. The volunteers’ blood samples were taken and assessed at intervals of 30 minutes, 60 minutes, 90 minutes, and 120 minutes after 2 hours after feeding. Each of the drawn blood samples was applied to the slides of the strip, which was curved to fit the shape of the finger. This makes it easy for the tiny drop of blood to be drawn into the strip and avoids blood contamination to the meter. The results were gradually displayed after 26 seconds and recorded. Routine calibration of the One Touch Glucometer was done each time a new strip batch was needed for analysis.
Four select cassava varieties were made into gari and turned into eba.
According to the Nigerian food composition table, 50 g-portion of eba of each cassava variety (215 g of gari gave 50 g of available carbohydrate) were served to participants with ewedu (a vegetable soup). After that, postprandial glucose after food consumption was determined at 0, 30, 60, 90, and 120 minutes to assess glycaemic response.
All subjects were also used in the reference group, to whom glucose was administered twice, both on the first and second days.
2.2.12. Determination of Glycemic Index (GI)
The Glycaemic Index of the test foods and the reference food was calculated using the trapezoid method of different time intervals (Myke-Mbata et al., Citation2021). A plot of concentration against time was used for the calculation.
where T is the average glucose level at each time.
Glycaemic index was computed by dividing the sum of the area under the curves for each variety of cassava by the sum of the areas under the curves for conventional glucose and multiplying the result by 100. The values obtained are the glycaemic index of the food.
The formula is given below,
(Lucy et al., Citation2021)
2.3. Statistical analysis
The results of cyanogenic potentials, proximate, and carbohydrate compositions of twenty select cassava cultivars and gari were analysed for Analysis of Variance (ANOVA) using the Statistical Package for Social Sciences (SPSS), version 20.0. The LSD (Least significant difference) and Duncan Multiple Range Test (DMRT) were used for means separation. Results were presented as mean ± standard deviations. All analyses were done in minimum duplicate runs.
3. Results and discussion
3.1. Cyanogenic potential and proximate composition of 20 cassava varieties (fresh roots and flours)
shows the mean ± standard deviations (± SD) of total hydrogen cyanide concentrations of twenty different cassava cultivars as measured and recorded in milligrams per 100 g (mgHCN) fresh weight. The mean values of the Total cyanide content of fresh cassava roots ranged from 7.40 mg/100 g in TMEB 419 to 9.68 mg/100 g in TMS IBA 950289. However, shows the mean (± SD) percentages of moisture, ash, protein, fat, total carbohydrate, total dietary fiber, and available carbohydrate content of twenty different cassava cultivars flour. The moisture content ranged from 5.17% in TMS IBA 980002 to 7.54% in TMS IBA30572, while the ash content varied from 1.38% in TMS IBA961632 to 5.23% in TMS IBA011371. The protein content digressed from 1.18% in TMS IBA980505 to 3.25% in TMS IBA011371, and the fat content drifted from 0.29% in TMEB419 to 1.74% in TMS IBA120008. The total carbohydrate varied from 83.01% in TMS IBA 011371 to 90.12% in TMS IBA 980002, and the total dietary fiber ranged from 0.64% in TMS IBA30572 to 2.08% in TMS IBA011368. The available carbohydrate content varied from 81.19% in TMS IB070337 to 85.80% in TMEB419.
Table 1. Total hydrogen cyanide content in fresh cassava root.
Table 2. Proximate composition of twenty different cassava cultivars flours.
shows the mean (± SD) percentages of total starch, free sugar, amylose, and amylopectin content in the flour of 20 different cassava varieties and the ratio of total starch to sugar and amylose to amylopectin. The total starch varied from 60.43% in TMS IBA IBA120008 to 79.85% in TMS 980002. The free sugar content digressed from 4.70% in TMS 961632 to 9.96% in TMS 070539, the amylose varied in percentage from 10.25 in TMS 070539 to 24.16 in TMS 980002, and the amylopectin was from 75.85% in TMS IBA 980002 to 89.75% in TMS IBA070593. The ratio of starch to free sugar content ranged from 6.42% in IBA120008 to 15.15% in TMS IBA 961632, and the ratio of the amylose to amylopectin varied from 0.12% in TMS IBA 070539 to 0.32% in TMS IBA 961089A. shows the mean (±SD) of total hydrogen cyanide concentrations in gari samples produced from four cassava varieties and recorded in milligrams per 100 g (mgHCN) dry weight. The total cyanide content of these four gari samples ranged from 1.04 mg/100 g dry weight in TMSIBA980002 to 2.42 mg/100 g dry weight in TMS IBA961089A.
Table 3. Carbohydrate compositions of twenty cassava cultivars flours.
Table 4. Total hydrogen cyanide in gari.
shows the mean (± SD) percentages of moisture, ash, protein, fat, total carbohydrate, total dietary fiber, and available carbohydrate content of four different cassava cultivars selected based on relatively medium-low free sugar content and high total starch content and calculated available carbohydrate. The moisture content ranged from 6.87% in TMS IBA 980002 to 8.7% 6 in TMS IBA961089A, and the ash content varied from 0.99 in TMS IBA980505 to 1.34 in TMS IBA961089A, the protein content digressed from 1.00 to 1.81 in TMS IBA961089A. The fat content of the gari varied from 0.36 in TMS IBA980505 to 0.39 in TME419. The total carbohydrate in the four varieties of gari ranged from 87.87% in TMSIBA961089A to 90.49% in TMSIBA980505. The total dietary fiber varied from 3.13% in TMSIBA980002 to 3.82% in TMEB419, and the available carbohydrate varied from 84.60% in TMSIBA961089A to 87.48% in TMSIBA961089.
Table 5. Proximate composition of gari.
shows the mean (± SD) percentages of total starch, free sugar, amylose, and amylopectin content in four different cassava varietal gari and the ratio of total starch to sugar and amylose to amylopectin. The percentages of the total starch ranged from 71.60 in TMSIBA980505 to 74.54 in TMSIBA980002, the percentages of free sugar varied from 1.36 in TMEB419 to 1.46 in TMSIBA980002, the ratio of total starch to free sugar varied from 51.20 in TMS IBA 980002 to 53.30 in TMS IBA961089A, the percentage of amylose ranged from 21.68 in TMSIBA980505 to 24.64 in TMEB419. In contrast, percentages of amylopectin ranged from 75.36 in TMEB419 to 78.33 in TMS980505. The ratio of starch to sugar is insignificantly different for all the samples, and the ratio of amylose to amylopectin ranged from 0.28 in TMS980505 to 0.33 in TMEB4914.
Table 6. Carbohydrate composition of gari for four varieties of cassava in Ibadan.
The reduction in the total hydrogen cyanide concentrations observed in the processed gari compared with cassava roots agreed with studies on cyanogenesis hydrolysis (Piero et al., Citation2015). However, it confirmed the quality of the processes involved in gari production (). As seen in the gari, the total hydrogen cyanide concentrations alleviate the fear of food poisoning and death reports due to cyanide intake from cassava products. The twenty cassava cultivars from the International Institute of Tropical Agriculture (IITA) and in circulation as released varieties in Nigeria used for this study were of low cyanogenic potentials (CNP) varieties that will ultimately prevent possible food poisoning cases in human subjects. They were all below the World Health Organization recommendation reports of a safe cyanide level of 10 mg/kg body weight, cited in Chaouali et al. (Citation2013). Therefore, the gari made from the different cassava varieties made into eba was safe for consumption and consequently posed no intoxication to the human digestive system of the healthy subjects in the study.
The proximate composition profile analysis from cassava roots samples and the gari; the moisture, ash, proteins, fats, total carbohydrate, total dietary fiber, and available carbohydrate results reveal no significant difference in all varieties. The proximate compositions analysis in show the decomposable biological nutrients as a major nutritional constituent. The moisture content of cassava flour () and cassava gari () is within 8.4%, as reported by Eleazu and Eleazu (Citation2012) for cassava gari. The cassava roots used for this study were harvested in the dry season when the moisture of cassava roots and products was very high.
The moisture content of a gari indicates the good quality of the product. According to Pirasath et al. (Citation2015), high moisture content enhances the digestion of food and glucose formation and its release into the blood.
The ash content of cassava products is the inorganic minerals found in cassava products. show the low level of these minerals found in cassava products and are comparable to 1.71% to 2.34%, as observed by Emmanuel et al. (Citation2012). Although, they are usually lost at different stages of processing cassava roots into cassava-based products Onyenwoke and Simonyan (Citation2014).
Proteins are bodybuilding blocks that assist in repairing worn-out tissues and make enzymes, hormones, and other body chemicals. The proteins from this study confirmed the long-held view that the protein content of cassava is very low, from 1% to 3% on a dry matter basis Emmanuel et al. (Citation2012) and Sulistyo et al. (Citation2016). Cassava’s protein has a more negligible effect on carbohydrate digestion and assimilation rate (Wanapat et al., Citation2013).
Fat content in cassava flour and the gari is very low (). Although fats are vital to cells structure and biological functions, they are usually deficient in cassava products except for value addition, as reported by Jisha et al. (Citation2010) but do not increase its insulin resistance (Wylie-Rosett et al., Citation2013).
Before entering the bloodstream, the carbohydrates in the food are digested and converted to glucose. Total carbohydrate content values in cassava flours and gari were within the range of 80% to 90% and agree with what has been reported (Emmanuel et al., Citation2012) while the dietary fiber as an indigestible part of carbohydrates remains relatively low for the gari samples investigated in this study. Dietary fiber is mainly carbohydrate, and its role as fiber is to keep the digestive system healthy. The total dietary fiber of the gari varieties agreed with values reported by Infante et al. (Citation2013). Dietary fiber is regarded as a crucial component of a healthy diet since it helps ease constipation or guard against colon cancer. Calculating available carbohydrates by the method of FAO (Citation2003), also known as a carbohydrate by difference, enables the determination of both available and non-available carbohydrates and i is regarded as suitable for the majority of foods when evaluating their energy content. Total dietary fiber is essential to quantify the actual available carbohydrate. Therefore, starchy foods, including gari, are an important energy source. After being eaten, they are broken down into glucose as the body’s main fuel, especially for our brain and muscles.
According to Oladunmoye et al. (Citation2019), cassava starch is the essential factor of carbohydrates in cassava products. Some other factors present in starchy foods, like free sugar, influence how the starch is hydrolyzed and absorbed. The chemical structure of starch and other intrinsic factors of starchy foods affect the α-amylase activity and the breakdown of the starch molecules. The ratio of starch to sugar in gari was not significantly different for all four selected varieties. Hence, the values of the ratio of total starch to free sugar differ from one variety to the other on a dry weight basis. At the same time, cassava-based products like gari are not significantly different. This could be attributed to fermentation or cyanogenic glucosides, removal during the processing stages, especially the fermenting stages, pressing, and frying of gari, as affirmed by Bayata (Citation2019).
The variation in the amylose content of gari ranged from 21.68 ± 0.11 in TMSIBA980505 to 24.64 ± 0.00 in TMEB7419. This result agrees with Oladunmoye et al. (Citation2014), who reported a highly significant correlation of amylose level with a factor of swelling power of cassava-based products and responsible for the pasting properties of the product eba. The variation observed in the percentage of amylose content could be attributed to the processing techniques of making cassava roots into gari. The amylose content of cassava-based products makes it a choice diet for non-communicable diseases based on its ability to lower blood glucose response when consumed.
3.2. Postprandial blood glucose response of reference food and the test food eba for the four varieties of gari
The postprandial blood glucose response of reference food and the test food eba from the four varieties of gari are shown in and graphically represented in . The blood glucose response curves were used to show the test food’s rapid and slow release against the reference food’s postprandial blood glucose at different times. The blood glucose responses were taken at zero minutes, 30 min, 60 min, 90 min, and 120 min.
Figure 3. Postprandial blood glucose response of reference food and the test food eba for the four varieties of gari.
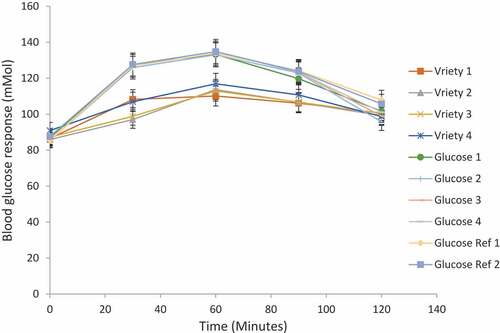
Table 7. The postprandial blood glucose responses of eba and the reference food.
The mean blood glucose response taken on different days by randomly selected volunteers ( and ) was very high at thirty minutes and slid down as the time increased to 120 min. The mean blood glucose response of the four varieties of gari (test food) was high at 60 min and decreased to 120 min. The blood glucose response of one of the gari variety TMSIBA980002 was similar to the reference food glucose because its highest blood glucose response was seen at 30 min.
Compared with the reference food, the GI of the four eba samples had the maximum blood glucose responses at the sixtieth minute, and the reference food was at the thirtieth minute after the consumption. Eba from TMSIBA980002 had the highest GI value (89.06%) and had a starch content of 74.54%, free sugar content of 1.46%, available carbohydrate value of 87.47%, amylose 22.67%, and amylopectin 77.34% (). However, the amylose and amylopectin ratio was 1:4. More so, TMSIBA961089A had a GI value of 88.11%, a starch content of 72.74%, free sugar content of 1.37%, available carbohydrate value of 85.06%, amylose of 22.82%, amylopectin 77.19%; and the ratio of amylose and amylopectin was 1:4 (). Furthermore, TMS IBA980505 had a GI of 87.62%, a total starch content of 71.60%, a free sugar content of 1.39%, available carbohydrate value of 90.49%, amylose of 21.68%, and amylopectin was found at 78.33%. The amylose and amylopectin ratio was 1:4 ().
Lastly, TMEB419 had a GI of 86.41%, a starch content of 69.07%, free sugar content of 1.30%, available carbohydrate value of 87.17%; the amylose was 24.64%, and amylopectin was 75.36%. The amylose and amylopectin ratio was 1:4 (). The rate of release of blood glucose, as observed in the above-aforementioned varieties of eba, shows the same pattern of blood glucose responses. It follows the trend in GI with TMSIBA980002 > TMSIBA961089A > TMS IBA980505 > TMEB419.
This can be attributed to high starch content and the ratio of the amylose to amylopectin that made up the starch in the molecular matrix of the food; it was the same for all varieties.
The high amylopectin part of the starch contents found in the molecular matrix of the eba could also be responsible for the incremental blood glucose response. It is based on its ability to produce more glucose response than the amylose part of starch within one hour of food consumption, as observed by Raigond et al. (Citation2015).
The enzymatic reactions at different levels and branches of the amylopectin coupled with the physiological system of the volunteering participants are factors to be considered. The glycemic index of all the varieties is high. These glycemic indices may not be suitable for non-communicable diseases, especially in the case of managing diabetics or obesity.
The reference glucose taken twice on the first and second days shows a gradual increase in releasing glucose into the blood from zero minutes to the first thirty minutes and continues to descend until one hundred and twenty minutes. This might be as a result of the digestive enzymes being less effective in breaking down complicated molecules into simpler ones. Hence, the rapid absorption into the bloodstream was responsible for the spikes of blood glucose in lesser time.
The trend of blood glucose response, as observed in the four cassava varieties of eba, could be the effect of enzymatic activities on the breakdown of complex molecules to the smaller units’ prior absorption into the bloodstream.
The percentage of amylopectin of gari ranged from 75.36 ± 0.00 in TMEB7419 to 78.33 ± 0.11 in 980505 (). An increase in amylopectin molecular weight has increased glucose production in the blood over time (Jiang et al., Citation2014). The reduction in the percentage value of the amylopectin in gari compared to the dry weight basis in the cassava flour resulted from the processing techniques as observed by Olusegun et al. (Citation2017). Processing of cassava roots affect the nutritional value of cassava products through modification and loss of nutrients of high value in gari, a cassava root product that involves grating, fermenting, drying, and storage.
The ratio of amylose to amylopectin of gari ranged from 0.28 ± 0.00 in TMS980505 to 0.33 ± 0.00 in TMEB419. The ratio of amylose to amylopectin influences starch digestibility. Amylose and amylopectin share some similarities but drastically different in how they are digested and processed. The differences are based on their physical structure; amylose is long and linear, while amylopectin has thousands of branches of glucose units.
4. Conclusions
Findings from this work have proven that the four varieties of eba selected for this work are high in glycemic index. The GIs obtained for the four eba samples were 88.1% for TMSIBA980002; 87.2% for TMS980505; 84.4% for TMEB7419, and 89.1% for TMS IBA961089A. This implies that TMEB7419 will produce fewer health problems with a percentage decrease of 5.57%, 4.38%, and 3.32% relative to TMS IBA961089A, TMSIBA980002, and TMS980505. It implies that a high intake of such food is suitable for those involved in sports or daily energy demands works but could enhance health problems for persons with high blood pressure, obesity, and diabetes mellitus. However, it is advised that people associated with underline illness should take it along with vegetable soups with high fiber content to reduce the absorption rate into the blood vessels, which will, in turn, increase the sugar level in the blood.
Authors contributions
Conceptualization: BM-D and RAS; methodology: EOA and NNG; software: BM-D and EOA; formal analysis: NNG, EOA and RAS.; investigation: NNG; resources: B.M-D and RAS data curation: NNG; writing – original draft preparation: NNG and EOA writing – review and editing: EOA, RAS and BM-D; supervision: BM-D and RAS; project administration: BM-D, RAS and EOA; funding acquisition: BM-D and RAS. All authors have read and agreed to the published version of the manuscript.
Acknowledgements
The authors acknowledged the support from the International Institute of Tropical Agriculture (IITA), University of Ibadan (Department of Human Nutrition and Dietetics), the Staff of Food and Nutrition Sciences Laboratory (FNSL), IITA, especially Mr Adesokan Michael and the staff of IITA Cassava Breeding Unit, especially Dr Peter Kulakow, Dr Elizabeth Parkes and Mr Peter Illuebey. Also, the support of the subjects and the field staff who participated in this study was acknowledged.
Disclosure statement
No potential conflict of interest was reported by the authors.
Data availability statement
The data supporting this study’s findings are available on request from the corresponding author.
Additional information
Funding
References
- Albalasmeh, A. A., Berhe, A. A., & Ghezzehei, T. A. (2013). A new method for rapid determination of carbohydrate and total carbon concentrations using UV spectrophotometry. Carbohydrate Polymers, 97(2), 253–261. https://doi.org/10.1016/j.carbpol.2013.04.072
- Ang, M., & Linn, T. (2014). Comparison of the effects of slowly and rapidly absorbed carbohydrate on postprandial glucose metabolism in type 2 diabetes mellitus patients: A randomized trials. The American Journal of Clinical Nutrition, 100(4), 1059–1068. https://doi.org/10.3945/ajcn.113.076638
- Anyakudo, M. M. (2014). Effects of food processing methods on diets proximate nutrient composition and glycemic profile in male type 2 diabetic subjects. British Journal of Applied Science & Technology, 4(27), 3995. https://doi.org/10.9734/BJAST/2014/10271
- AOAC. (2000). Official methods of analysis of AOAC (International 17th ed.). Association of Analytical Communities.
- Babajide, K., Irondi, E. A., Alamu, E. O., Ajani, E. O., Abass, A., Adesokan, M., Parkes, E., & Maziya Dixon, B. (2022). Influence of traditional processing and genotypes on the antioxidant and antihyperglycaemic activities of yellow-fleshed cassava. Frontiers in Nutrition. https://doi.org/10.3389/fnut.2022.894843
- Bayata, A. (2019). Review on nutritional value of cassava for use as a staple food. Science: Journal of Analytical Chemistry, 7(4), 83–91. https://doi.org/10.11648/j.sjac.20190704.12
- Benesi, A. J., Grutzeck, M. W., O’Hare, B., & Phair, J. W. (2005). Room-temperature icelike water in Kanemite detected by 2H NMR T 1 relaxation. Langmuir, 21(2), 527–529. https://doi.org/10.1021/la048302s
- Candindo, F. G., Pereira, E. V., & Alfenas, R. C. (2013). Use of the glycemic index in nutrition education. Revista de nutricao, 26(1), 89–96. https://doi.org/10.1590/S1415-52732013000100009
- Chakona, G., & Shackleton, C. (2019). Food taboos and cultural beliefs influence food choice and dietary preferences among pregnant women in the Eastern Cape, South Africa. Nutrients, 11(11), 2668. https://doi.org/10.3390/nu11112668
- Chaouali, N., Gana, I., Dorra, A., Khelifi, F., Nouioui, A., Masri, W., Belwaer, I., Ghorbel, H., & Hedhili, A. (2013). Potential toxic levels of cyanide in almonds (Prunus amygdalus), apricot kernels (Prunus armeniaca), and almond syrup. ISRN Toxicology, 2013, 1–6. https://doi.org/10.1155/2013/610648
- Cuvaca, I. B., Eash, N., Zivanovic, S., Lambert, D. M., Walker, F., & Rustrick, B. (2015). Cassava (Manihot esculenta Crantz) tuber quality as measured by starch and cyanide (HCN) affected by nitrogen, phosphorus, and potassium fertilizer rates. Journal of Agricultural Sciences, 7(6), 36. https://doi.org/10.5539/jas.v7n6p36
- Dubois, M., Gilles, K. A., Hamilton, J. K., Rebers, P. A., & Smith, F. (1956). Colorimetric method for determination of sugars and related substances. Analytical Chemistry, 28(3), 350–356. https://doi.org/10.1021/ac60111a017
- Eleazu, C. O., & Eleazu, K. C. (2012). Determination of the proximate composition, total carotenoid, reducing sugars and residual cyanide levels of flours of 6 New Yellow and White Cassava (Manihot esculenta Crantz) Varieties. American Journal of Food Technology, 7(10), 642–649. https://doi.org/10.3923/ajft.2012.642.649
- Elemosho, A. O., Irondi, E. A., Alamu, E. O., Ajani, E. O., Menkir, A., & Maziya Dixon, B. (2021). Antioxidant and starch-hydrolyzing enzymes inhibitory properties of striga-resistant yellow-orange maize hybrids. Molecules, 26, 6874. https://doi.org/10.3390/molecules26226874
- Eli-Cophie, D., Agbenorhevi, J. K., & Annan, R. A. (2017). Glycemic index of some local staples in Ghana. Food Science & Nutrition, 5(1), 131–138. American Journal of Food Technology, 5, 131–138. https://doi.org/10.1002/fsn3.372
- Emmanuel, O. A., Clement, A., Agnes, S. B., Chiwona-Karltun, L., & Drinah, B. N. (2012). Chemical composition and cyanogenic potential of traditional and high yielding CMD resistant cassava (Manihot esculenta Crantz) varieties. International Food Research Journal, 19(1), 175–181.
- FAO. (2003). Food energy-methods of analysis and conversion factors. Food and Agriculture Organization of the United Nations.
- Gudi, K. C., Adesayo, A. S., Solomon, A. I., & Saheed, I. A. (2019). Quantitative evaluation of hydrogen cyanide content, chemical and functional properties of gari from Akwanga from Nasarawa State Nigeria. World Journal of Advanced Research and Reviews, 4(1), 013–024. https://doi.org/10.30574/wjarr.2019.4.1.0081
- Idowu, O., Olaoye, O., Sogotemi, C., & Ajayi, B. (2013). Quality assessment of flours and amala produced from three varieties of sweet potato Ipomea batatas. International Journal of Food Sciences and Nutrition, 2(4), 2320–7876.
- Infante, R. B., Garcia, O. O., & Rivera, C. (2013). Characterization of dietary fiber and pectin of cassava bread obtained from different regions of Venezuela. Revista chilena de nutrición, 40(2), 169–173. https://doi.org/10.4067/S0717-75182013000200012
- Jiang, H., Miao, M., Ye, F., Jiang, B., & Zhang, T. (2014). Enzymatic modification of corn starch with 4-α-glucanotransferase results in increasing slow digestible and resistant starch. International Journal of Biological Macromolecules, 65, 208–214. https://doi.org/10.1016/j.ijbiomac.2014.01.044
- Jisha, S., Sheriff, J. T., & Padmaja, G. (2010). Nutritional, functional and physical properties of extrudates from blends of cassava flour with cereal and legume flours. International Journal of Food Properties, 13(5), 1002–1011. https://doi.org/10.1080/10942910902934090
- Lucy, M., Bürger, C., Shami, A., Ahmadsei, M., Winkels, H., Nitz, K., van Tiel, C. M., Seijkens, T. T. P., Kusters, P. J. H., Karshovka, E., Prange, K. H. M., Wu, Y., Brouns, S. L. N., Unterlugauer, S., Kuijpers, M. J. E., Reiche, M. E., Steffens, S., Edsfeldt, A., Megens, R. T. A. … Lutgens, E. (2021). Cell-specific and divergent roles of the CD40L-CD40 axis in atherosclerotic vascular disease. Nature Communications, 12(1), 1–12. https://doi.org/10.1038/s41467-021-23909-z
- Medina-Remon, A., Kirwan, R., Lamuela-Raventos, R. M., & Estruch, R. (2018). Dietary patterns and the risk of obesity, type 2 diabetes mellitus, cardiovascular diseases, asthma, and neurodegenerative diseases. Critical Reviews in Food Science and Nutrition, 58(2), 262–296.
- Myke-Mbata, B. K., Meludu, S. C., Dioka, C. E., & Amah, U. K. (2021). Glycaemic index of commonly eaten dough staple foods among diabetics and non-diabetics in Makurdi. Western Journal of Medical and Biomedical Sciences, 2(1), 27–34.
- Nasreen, S., & Azeem, Z. (2020). Glycemic index and glycemic load of multigrain chapatti (Indian flatbread) in healthy adult individuals. International Journal of Food and Nutritional Sciences, 1(9), 16.
- Ojo, A., & Akande, E. A. (2013). Quality evaluation of gari produced from cassava and sweet potato tuber mixes. African Journal of Biotechnology, 12(31), 4920–4924.
- Oladunmoye, O. O., Aworh, O. C., Maziya-Dixon, B., Erukainure, O. L., & Elemo, G. N. (2014). Chemical and functional properties of cassava starch, durum wheat semolina flour, and their blends. Food Science & Nutrition, 2(2), 132–138. https://doi.org/10.1002/fsn3.83
- Olusegun, O. A., Francis, K. P., & Ainamensa, G. (2017). Effect of selected processing and modification methods on quality of cassava and its starch. Asian Journal of Agricultural Research, 11(3), 48–56. https://doi.org/10.3923/ajar.2017.48.56
- Onyenwoke, C. A., & Simonyan, K. J. (2014). Cassava post-harvest processing and storage in Nigeria: A review. African Journal of Agricultural Research, 9(53), 3853–3863.
- Ooye, D., Oso, G., & Olalumade, B. (2014). Effects of different processing methods on the proximate and cyanogenic composition of flour from different cassava varieties. Research and reviews. Journal of Agriculture and Allied Sciences, 3(3), 1–6.
- Parada, J., Perez-Correa, J. R., & Perez-Jimenez, J. (2019). Design of low glycemic response foods using polyphenols from seaweed. Journal of Functional Foods, 56, 33–39.
- Phillips, K. M., Haytowitz, D. B., & Pehrsson, P. R. (2019). Implications of two different methods for analyzing total dietary fiber in foods for food composition databases. Journal of Food Composition and Analysis, 84, 103253.
- Piero, N. M., Njagi, J., Oduor, R. O., Jalemba, M. A., Omwoyo, O. R., & Cheruiyot, R. C. (2015). Determination of cyanogenic compounds content in transgenic acyanogenic Kenyan cassava (Manihot esculenta Crantz) genotypes: Linking molecular analysis to biochemical analysis. Journal of Analytical & Bioanalytical Techniques, 6(264), 2.
- Pirasath, S., Balakumar, B., & Arasaratnam, V. (2015). Glycaemic index of Sri Lankan meals. Journal of Blood Disorders, 6(254), 1–6.
- Prosky, L., Asp, N. G., Furda, I., Devries, J. W., Schweizer, T. F., & Harland, B. F. (1985). Determination of total dietary fiber in foods and food products: Collaborative study. Journal of the Association of Official Analytical Chemists, 68(4), 677–679.
- Raigond, P., Ezekiel, R., & Raigond, B. (2015). Resistant starch in food: A review. Journal of the Science of Food and Agriculture, 95(10), 1968–1978.
- Ramota Karim, O., Adebanke Balogun, M., Adeoye Oyeyinka, S., & Morenike Abolade, R. (2015). Comparative analysis of the physicochemical and acceptability of enriched gari (fermented cassava product). Carpathian Journal of Food Science & Technology, 2(7), 98–108.
- Sacks, F. M., Carey, V. J., Anderson, C. A. M., Miller, E. R., Copeland, T., Charleston, J., Harshfield, B. J., Laranjo, N., McCarron, P., Swain, J., White, K., Yee, K., & Appel, L. J. (2014). Effect of high vs low glycemic index of dietary carbohydrate on cardiovascular disease risk factors and insulin sensitivity. The omniCarb Randomized Clinical Trial: Jama, 312(23), 2531–2541.
- Sulistyo, J., Shya, L. J., Mamat, H., & Wahab, N. A. (2016). Nutritional value of fortified cassava flour prepared from modified cassava flour and fermented protein hydrolysates. AIP Publishing LLC.
- Unwin, D., Livesey, G., & Haslam, D. (2016). It is the glycaemic response to, not the carbohydrate content of food that matters in diabetes and obesity: The glycaemic index revisited. Journal of Insulin Resistance, 1(1), 1–9.
- Wanapat, M., Pilajun, R., Polyorach, S., Cherdthong, A., Khejornsart, P., & Rowlinson, P. (2013). Effect of carbohydrate source and cottonseed meal level in the concentrate on feed intake, nutrient digestibility, rumen fermentation and microbial protein synthesis in swamp buffaloes. Asian-Australasian Journal of Animal Sciences, 7(26), 952–960.
- Wolever, T. M., Giddens, J. L., & Sievenpiper, J. L. (2015). Effect of ethnicity on glycaemic index: A systematic review and meta-analysis. Nutrition & Diabetes, 5(7), e170.
- Wolever, T. M., Jenkins, D. J., Jenkins, A. L., & Josse, R. G. (1991). The glycemic index: Methodology and clinical implications. The American Journal of Clinical Nutrition, 54(5), 846–854.
- Wylie-Rosett, J., Aebersold, K., Conlon, B., Isasi, C. R., & Ostrovsky, N. W. (2013). Health effects of low-carbohydrate diets: Where should new research go? Current Diabetes Reports, 13(2), 271–278.