
ABSTRACT
Injera is a staple fermented food in Ethiopia and is prepared from teff (Eragrostis teff (Zucc) Trotter). However, due to the higher price of teff recently, only middle- and high-income people can afford it. Hence, this study investigated the effect of the Blending Ratio (BR) of Teff flour (TF), Buckwheat Flour (BWF), and Pearl Millet Flour (PMF) and Fermentation Time (FT) on the overall quality of injera. The prepared injera showed protein as 9.06–11.82%, crude fat as 2.60–5.10%, crude fiber as 1.97–2.56%, total ash as 1.78–2.24%, carbohydrate as 71.43–75.34%, and energy as 364.99–375.29 kcal/100 g. Injera prepared from all the blends was sensorially accepted; however, injera prepared from 20% PMF, 65% TF, and 15% BWF fermented for 72 h was the most preferred. From this study, it is concluded that up to 30% FMF, 20% BWF, and 72 h fermentation time is recommended for the preparation of nutritionally improved injera with good sensory acceptability.
1. Introduction
Injera is a widely consumed, fermented, traditional, and major staple food in Ethiopia and currently appreciated globally due to its gluten-free nature (Neela & Fanta, Citation2020). It is a thin, pancake-like, spongy, circular flatbread with a small honeycomb-like structure on top surface that is formed due to the production of CO2 during fermentation and escape during baking (Woldemariam et al., Citation2019). Teff is the primary and most popular grain used for making injera. The growing interest in teff and its popularity is attributed to the outstanding nutritional compositions (Gebremariam et al., Citation2014) and its gluten-free nature. So, researchers are recommending teff preparation in wide range of food products to help people with celiac disease (Nascimento de Oliveira Do et al., Citation2018) and recently it has been considered as a “super grain” (Neela et al., Citation2018). Teff grain provides relatively high protein content with an excellent balanced and complete set of amino acids (W. Abebe et al., Citation2015). It is also high in iron content and other minerals such as calcium, and copper quantities are sillier with other cereals like barley, sorghum, maize, and wheat (Y. Abebe et al., Citation2007).
Teff demand is constantly increasing in domestic and in international markets. However, the teff production in Ethiopia is not achieving to meet this demand. The factors like lack of higher yielding improved teff varieties, fragmented traditional agricultural practices, high harvesting losses, and very poor public investments are responsible for the lower production than the demand (Fikadu et al., Citation2019). Hence, teff is the most expensive cereal grain in Ethiopia at present. Due to the higher teff prices, even the middle-income households tend to mix teff flour with low-cost cereals in preparation of injera (Berhane et al., Citation2011). Nowadays, injera is prepared in combination of teff with other cereals like wheat, sorghum, millet, maize, rice, barley, amaranths, and quinoa (Ashenafi et al., Citation2006; Batu et al., Citation2016; Mihrete & Bultosa, Citation2017; Neela & Fanta, Citation2020). However, sensory qualities of the injera produced from the composite flours are not well defined. So, this study tried to optimize the blending ratio of TF, PMF, and BWF for the preparation of injera.
Pearl millet (Pennisetum glaucum) is termed as “Nutri-cereal” due to its high fiber, protein, fatty acids, and mineral composition with good anti-oxidant properties (Kumar et al., Citation2018). It is considered as the alternative food for the gluten-sensitive people (Annor et al., Citation2015). The use of underutilized crops can be cultivated under uncertain and extreme climate, and soil conditions can play a key role in the substitution of the high-cost ingredients like teff. Although the pearl millet is grown in different parts of Ethiopia, the use of its flour in injera preparation is not common. Therefore, the preparation of injera from PMF has considerable economic benefit since it has a low cost compared to teff.
Buckwheat (Fagopyrum esculentum Moench) is recognized as a noble source of nutritionally valuable protein, dietary fiber, minerals, and health-promoting components such as phenolic acids and vitamins (Qin et al., Citation2010). Protein from buckwheat have high biological value due to a well-balanced amino acid composition with a good quality of lysine, which is generally recognized as the first limiting amino acid in other cereals (Mahata, Citation2018). Therefore, the incorporation of buckwheat into food products ensures to cover the broad range of essential amino acids which human body needs.
Traditional fermentation improves the palatability, organoleptic characteristics, and the health-beneficial components in injera (Adebo et al., Citation2019). It is also enhancing nutritional profile by the degradation of anti-nutritional factors. Natural fermentation reduces about 50% of the existing phytic acid and improves the bioavailability of iron and zinc (Shumoy, Lauwens, et al., Citation2017). However, the optimum fermentation durations for the best sensory quality of the injera were not well documented.
Meanwhile, pearl millet and buckwheat are less expensive grains in Ethiopia, there are opportunities to blend with TF to replace the higher cost teff and improve the nutritional quality of injera with better sensory acceptability. Fermentation time is also a vital factor that positively affects the nutritional qualities and sensory acceptability of injera, and there is considerably limited information on the effect of fermentation time on composite flour-based injera nutritional quality and sensory acceptability.
By considering all the above gaps, this study was focused to investigate the effects of BR and FT on the physicochemical, microbiological, and sensory qualities of injera made from different ratios of TF, PMF, and BWF blended flours.
2. Materials and methods
2.1. Sample collection and raw material preparation
Teff (Qouncho ver.), Pearl millet (kola-1 ver.), and Buckwheat (Shashe ver.) were obtained from Adet Agricultural Research Institute, Sekota Agricultural Research Center, and Debre Zeit Agricultural Research Center, respectively.
The collected samples were cleaned manually to remove stones, dust, lighter particles, undersized and immature grain. Pearl millet and buckwheat were washed to remove dirt and then sun-dried. Buckwheat was dehulled by impact milling process (Wronkowska & Haros, Citation2014), then the three raw materials individually milled into fine flours using the roller mill (Kingman M&E Complete Plant Co., Ltd, Model: M6FY–35, China). After milling, the flours were sifted to pass through 710-μm sieve (Kebede et al., Citation2010) and 500 g of each sample packed in polyethylene bags and stored at 4°C for further laboratory analysis and the remaining flours were subjected to injera preparation.
2.2. Experimental design
This study was conducted in two-factor factorial design arranged in completely randomized design (CRD). The first factor BR is considered in five levels: they are BR1 (PMF 40: TF 55: BWF 5), BR2 (PMF 30: TF 60: BWF 10), BR3 (PMF 20: TF 65: BWF 15), BR4 (PMF 10: TF 70: BWF 20), and Control (100% TF). The second factor is FT with three levels they are FT1 (36 h), FT2 (72 h), and FT3 (108 h). The selection of the BR was considered based on the observations of the preliminary studies. The fermentation duration is very important as it imparts all the sensory and textural quality of the injera. However, the FT is selected based on the traditional practice. In traditional practice, injera was fermented for 2 to 4 days. So, FT is considered lower than the 2 days and higher than 4 days. In addition, the factor FT is also considered based on the preliminary study. This experiment is conducted in triplicate for all the runs.
2.3. Preparation of fermented dough and preparation of injera
Injera from the composite flour was prepared using previously reported preparation method (Mihrete & Bultosa, Citation2017). The injera preparation involves starter (“Ersho”) preparation, batter preparation, fermentation (primary and secondary), and preparation of injera from batter by baking. The “Ersho” is prepared by combining water and teff flour in a 2:1 ratio and leaving the mixture to ferment for up to 72 h without any mixing. The injera batter was made by combining the teff flour and water in a ratio of 1:2 and mixed with 160 ml of “Ersho”. Then, the mixture was kneaded for 5 minutes with by hand, covered with the lid, and kept aside at room temperature (at 25°C). Then, the fermentation was allowed for 36–108 hours as indicated in the experimental design. This fermentation step was considered as the primary fermentation.
Then, 10% of the fermented mass (from the primary fermentation) was taken for the preparation of “Absit”, which serves as a binder and prepared with a ratio of 1:3 v/v (Batter: Water) by boiling on a hot plate and then cooled to temperature of 45°C (Yegrem et al., Citation2021). It was then added back to the remaining fermented batter from the primary fermentation, mixed carefully, and allowed 3 hours for secondary fermentation. The resulting batter was used for the injera preparation.
Initially, the baking pan (“Metad”) surface was greased with the rapeseed flour using a piece of clean cloth. The injera was backed by pouring about 500 ml of batter using a circular motion from the outer perimeter toward the center onto a hot (at a temperature of 220°C) round smooth baking griddle. The metad is then covered with its lid locally called “Akimbalo” to hold the steam and injera was baked for 3 minutes (Fikiru et al., Citation2020). Once injera is baked, the samples were collected and stored in a traditional storage bin known as “Missob”; a portion of injera is subjected to the sensory analysis and the remaining is dried for physicochemical analysis. In Appendix, depicted all the 15 injera samples prepared in this study.
2.3.1. Preparation of dried injera flour
The freshly baked injera from all the treatment combinations were separately subjected to drying at 65°C for 24 hours in a hot air oven (Model: DHG- 9140A; Zenith Lab Inc., China) by spreading on aluminum foil. The dried injera was powdered and passed through 710 µm sieve. These injera samples were packed in polyethylene plastic bottles and stored at 4°C (Girma et al., Citation2013) until further laboratory analysis was carried out.
2.4. Data collection
2.4.1. Physical properties of fermented batter and injera
The following physical properties of batter, fresh injera, and injera stored for 4 days were determined.
2.4.1.1. Color
The color of injera samples were determined using a Hunter colorimeter (Model, CM-600d KONICA MINOLTA, INC) with optical sensor works based on L*, a*, and b* values. A glass cell containing flour and an injera sample was placed below the light source, and L*, a*, and b* color values were recorded.
2.4.1.2. pH
The pH of the fermented batter was determined directly by dipping the calibrated electrode of pH meter in homogenated batter after the completion of fermentation time. The injera samples (10 g) were mixed with 100 ml of distilled water and boiled and cooled, and pH was determined (AOAC, Citation1995).
2.4.1.3. Titratable acidity (TA)
The TA of batter and injera was determined according to the methods described by Sadler and Murphy (Citation2010). The samples (10 g) were mixed with 100 ml of distilled water and titrated with 0.1 N NaOH. The volume of NaOH utilized to reach to endpoint was recorded, and TA was expressed as lactic acid equivalence.
2.4.1.4. Instrumental texture analysis
The texture (firmness) of injera was determined using a texture analyzer as described by Zaidel et al. (Citation2008). The injera was cut into uniform strips (4 cm width and 15 cm length) using a sharp knife. The injera strips were placed in polyethylene plastic bags and stored at room temperature for 4 days. The peak force (N) of fresh and stored injera (2nd and 4th day) was determined using a texture analyzer in a compression mode with a sharp blade cutting probe and TA 90 heavy-duty platform. The testing profile was considered as pre-test speed (1.0 mm/s), test speed (3.0 mm/s), post-test speed (10.0 mm/s), distance (15 mm), and trigger type (0.049N auto).
2.4.2. Determination of proximate composition of injera
The moisture content of all the dried injera samples was determined according to AOAC (Citation2000) using the official method No. 925.10 which is oven-drying method (Model: DHG- 9140A; Zenith Lab Inc, China). The crude protein content was determined by the Kjeldahl method (AOAC, Citation2000), using the official method No. 920.87. The crude fat of injera samples was determined by the Soxhlet extraction method (AOAC, Citation2000), according to the official method No. 920.39, using the hexane as the extraction solvent. The crude fiber content of injera was determined by AOAC (Citation2000), official method No. 962.09, using the acid and base digestion method. The ash content of injera samples was determined according to the AOAC (Citation2000), official method number 923.03 using the muffle furnace. The carbohydrate content was determined by difference method according to Onyeike (Citation1995). The total energy content of the injera samples was determined according to AOAC (Citation2000), by multiplying the mean value of crude fat, total carbohydrate, and crude protein by the factor 9, 4, and 4, respectively. The results are expressed on dry base value.
2.4.3. Determination of mineral content
The iron, zinc, and calcium contents of injera samples were determined according to the methods described by AOAC (Citation2000). The wet digestion method was used in sample preparation using 20 ml of concentrated HNO3 and 4 ml of 70% HClO4 for mineral content determination. The digested samples were kept aside for 30 min at room temperature to cool. Then, digested samples were filtered into 100-ml volumetric flask and filled up to the calibration mark by distilled water and kept at 4°C. The Atomic Absorption Spectrophotometry (PG Instruments Ltd, model AA500G, England) was used to determine the selected mineral concentration and the absorption was measured at 248 nm, 422.7 nm, and 213.9 nm for iron, calcium, and zinc, respectively. The mineral concentrations were calculated from the prepared standared graph.
2.4.4. Determination of anti-nutritional factors and phenolic content
2.4.4.1. Phytic acid
The phytic acid content of injera sample was determined using spectrophotometric methods described by Reichwald and Hatzack (Citation2008). The sample was prepared by taking around 0.1 g of injera sample into screw-capped test tube and 1 mL of 1 M HCl (1 mL) was added. The mixture was boiled in boiling water bath (100°C) for 45 min. Then, the tubes were cooled to room temperature and centrifuged for 5 min at 13,000 × g. Supernatant aliquots (500 µL) were transferred to new centrifuge tubes and diluted with 2 mL of deionized water. The FeCl3 (800 µL) was added to the diluted solution (400 µL) and then this mixture was incubated at 100°C for 45 min in shaking water bath. Further, samples were cooled in an ice bath for 15 min to allow the formation of an iron-phytate precipitate and subsequently centrifuged at 13,000 × g for 10 min at 0°C. Supernatant aliquots (600 µL) were mixed with the 800 µL of the complexing reagent (consisting of 1 g of 2, 2-bipyridine, and 0.13 mL thioglycolic acid in 100 mL 0.2 M HCl), and absorbance was measured at 540 nm, the same procedure was followed for the standard phytic acid solution to prepare the calibration curve. The phytic acid content of samples was determined by the calibration curve.
2.4.4.2. Condensed tannin
The tannin content of injera samples was determined by modified vanillin- HCl method (Price et al., Citation1978). First, 0.15 g sample was taken to centrifuge tubes and 4 mL of 1% HCl in methanol is added and mixed for 10 s. The homogenized samples were placed in water bath (30°C) for 20 min. In the first half of the incubation period (at 10th min), tubes were mixed with the help of vortex mixture for 10s and placed them back into the water bath for remaining period. Exactly after 20 min of incubation, the tubes were again vortexed for 10 s and centrifuged at 4000 rpm for 10 min. The supernatant was collected carefully and 1 mL aliquots was taken. Further, supernatant tubes were placed in water bath (30°C) for 20 min. After, 5 mL of the vanillin reagent was added and allowed for 20 min. The absorbance was measured at 500 nm in a spectrophotometer (Agilent, Model G6860A, Malaysia). The tannin concentrations were determined using the standard graph prepared using different Catechin concentrations.
2.4.5. Total phenolic content
The total phenolic content of injera samples was determined according to the adapted Folin-Ciocalteu methods (Zieliński & Kozłowska, Citation2000). Around 5 g of sample was homogenized with 10 mL of 60% methanol containing 0.1% HCl solution, and placed in a water bath for 2 h at 85°C to eliminate vitamin C as described by Georgé et al. (Citation2005). After cooled, the solution was transferred to 100-ml volumetric flask and filled distilled water up to the calibration mark. The extracts were filtered under reduced pressure through Whatman No. 1 filter paper. An aliquot of 5 mL was added to 15 mL distilled water, 5 mL of Folin-Ciocalteu reagent, and 10 mL of saturated sodium carbonate solution. Then, the mixture was kept aside for 30 min at room temperature, the absorbance was measured at 750 nm using UV-spectrophotometer (Agilent, Model G6860A, Malaysia). The total phenolic content was calculated from calibration curves obtained with standard Gallic acid. The total phenolic contents of samples are expressed as mg GAE/100 g.
2.4.6. Determination of microbial quality of injera
The microbial quality of the injera was determined immediately after baking and after 3rd and 6th days of storage.
2.4.6.1. Total aerobic plate count and total yeast and mold count
The total aerobic plate count and mold count of injera samples were determined according to AOAC (Citation2005). Injera samples (10 gram) were taken aseptically and homogenized in 90-ml sterilized peptone water (0.1%), and then serial dilutions were conducted in laminar flow unit. Exactly, 1 ml of the sample from the serial dilution was inoculated by spread plate method on pre-solidified plate count agar media and inoculated at 35°C for 48 h. In case of mould enumeration, serially diluted sample was spread on to the pre-solidified Potato Dextrose Agar (PDA) media and incubated at 25°C for five days. Tartaric acid was used as bacterial inhibitor. Further, the viable colonies were counted and recorded as Colony Forming Unit (CFU) per grams of injera and transferred to log cfu/g of samples.
2.4.7. Sensory evaluation of injera
The sensory acceptability of the injera samples was determined according to the methods described by Lim (Citation2011). A total of 50 untrained panelists were randomly selected from Bahir Dar Institute of Technology students and staff. All the samples were subjected to sensory evaluation after 2 h of baking. The sensory attributes like color, texture (degree of softness), taste, eye uniformity, top and bottom surface (degree of being powdery and sticky), rollability, and overall acceptability were determined using a five-point hedonic scale.
2.5. Statistical analysis
The statistical analysis of the data was analyzed using Minitab 19.2 version, and results were expressed as mean ± standard deviation (SD). Two-way analysis of variance (ANOVA) was used to investigate both the main and interaction effect of each factor on response variables. Further, the mean comparison was conducted by honestly significant difference (Tukey`s test) and the statistical significance was set at a 95% confidence level (p < .05). Sigma plot version 12.5 was used to prepare all the graphs presented in this manuscript.
3. Results and discussions
3.1. Effect of BR and FT on physical properties of batter and injera
In this section, the effect of BR and FT on the physical properties of batter and injera was presented.
3.1.1. pH and TA of batter
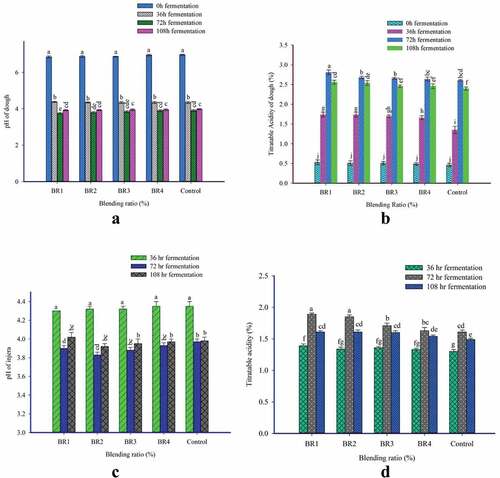
The typical sour taste of Ethiopian traditional fermented injera is prompted by pH as a result of the change in lactic acid concentration during fermentation (Yigzaw et al., Citation2004). The interaction of BR and FT had a significant (p < .05) effect on the pH of batter as shown in . The pH value of the batter ranged from 3.75 to 6.97. The lowest pH value (3.75) was observed from BR1, fermented for 72 h, while the highest pH value (6.97) was obtained from the control batter at the initial point. However, the pH values of the batter from BR1, BR2, and BR3 fermented for 72 h were not statistically significantly different from each other. In contrast the BR1 and control samples are statistically different in 72 h of fermentation durations. In case of highest pH value of the batter, all the BRs are statistically not significantly different. It meansthat the highest pH values are reported at the time of experiment initiation.
Figure 1. Effect of blending ratio and fermentation time on (a) pH of batter; (b). Titratable acidity of batter; (c) pH of injera; (d) Titratable acidity of injera. The values expressed were mean±sd with triplicate experiments. Bars with different superscript (a, b, c.) letters are significantly different at p < .05. Where BR1 (Perl millet flour 40: Teff flour 55: Buckwheat flour 5), BR2 (Perl millet flour 30: Teff Flour 60: Buckwheat flour 10), BR3 (Perl millet flour 20: Teff flour 65: Buckwheat flour 15), BR4 (Perl millet flour 10: Teff Flour 70: Buckwheat flour 20), and Control (100% Teff Flour).
These results were in close agreement with the finding of Shumoy, Gabaza, et al. (Citation2010), a reported rapid decrease in the pH of fermented batter. In general, there was a rapid decline in pH in all the batter samples from initial to 36 h, a steady decline from 36 h to 72 h fermentation and slightly increased at 108 h fermentation due to the interaction of BR and FT effects. This acidity variation of the batter could be attributed to the lactic acid bacteria and yeast growth and metabolisms occurred during the fermentation (Kunyanga et al., Citation2009). However, the pH value of the batter slightly increased on 108 h fermentation. This minimal increase in pH value may be because of fungal species that were shown to be grown rapidly toward the ends of fermentation (108 h). It can utilize acids and lead to an increase in the pH value of the batter (Hassan et al., Citation2012).
The TA is a reliable way of controlling the extent of fermentation and acidity developed in sourdough. The interaction of BR and FT had a significant effect on TA as shown in . The highest TA (2.81%) was observed in batter from BR1 fermented for 72 h (FT 2) and it is statistically different from other treatments. The lowest (0.46%) total TA was observed at the onset of experiment of all the runs (BR1, BR2, BR3, BR4, and Control).
The TA of all the composite batter was shown considerably increased up to 72 h fermentation (FT 2) and slightly decreased during the 108 h fermentation. The increase in TA of the batter may be attributed to the lactic acid producing bacteria and yeast activities which degrades carbohydrates resulting in acidification (Ojokoh et al., Citation2013). The progressive increase of the total titratable acidity during fermentation has been previously reported for pearl millet and acha flour blends (Ojokoh et al., Citation2015), kuncho and magna teff flour injera dough (Desiye et al., Citation2018), maize-based dough (Mwizerwa et al., Citation2018), and sorghum-based gluten-free bread (Almaiman et al., Citation2021).
3.1.2. pH and TA of injera
The interaction of BR and FT had a significant (p < .05) effect on the pH value of injera as shown in . The pH value of injera samples ranged from 3.77 to 4.35. The highest pH value (4.35) was observed from BR4 and control injera fermented for 36 h (FT 1). However, the pH of all the injera samples fermented for 36 hours is not significantly different from each other among the studied runs (BR1, BR2, BR3, BR4, and control). The lowest pH value (3.77) was obtained for the BR2 injera sample fermented for 72 h. However, it was not statistically different from the pH value of the other BR samples fermented for 72 hours. In the present study, there was a rapid decline in pH in injera from all blended and control injera from initial to 36 h, and a steady decline was observed from 36 h to 72 h fermentation due to the interaction effect of BR and FT.
The pH value of injera was significantly (p < .05) influenced by the interaction effect of BR and FT. However, injera prepared from BR1, BR2, BR3, and BR4 fermented for 108 h, and BR3 and BR4 fermented for 72 h (FT 2) were not significantly (p < .05) different from the control. The present study results showed similar trends with the previous report of Jula (Citation2020); injera prepared from Bambara groundnut and teff blending flours fermented for 72 h (FT 2) reported pH value decreased from 3.8 to 3.6. In general, the Ethiopian standard agency (ESA) set the pH of teff injera in the range of 3.45–4.00 (Ethiopian Standard Agency [ESA], Citation2018). The pH value (3.98–3.77) of injera obtained in the present study is within the range of ESA specification of teff injera except injera fermented for 36 h (4.30–4.35).
The interaction effect of BR and FT significantly (p < .05) increased the TA of injera samples from 1.30% to 1.89% (). The highest TA value (1.89%) was observed for the BR1 injera sample fermented for 72 h (FT 2), while the lowest pH value (1.30%) was obtained from the control injera sample fermented for 36 h (FT 1). The total TA of injera also significantly (p < .05) increased as the fermentation period prolonged. Increase in TA may be attributed to the rapid decline of pH as the FT increased. The decrease in pH and increase in TA followed the same trends as reported for Kuncho and magna teff injera (Desiye et al., Citation2018). The TA obtained in the present study was also comparable with the TA value (0.42–1.82) reported by Obadina et al. (Citation2013).
3.2. Effect of BR and FT on color of injera stored for 4 days
Color change provides information about the magnitude of browning reactions such as caramelization, maillard reaction, degree of cooking, and pigment degradation that takes place during the food preparation process (Altan et al., Citation2008). The color properties of food products disclose the first impression before consumption. The color characteristics of injera samples are presented in . The interaction of BR and FT had a significant (p < .05) effect on the surface color (L* value) of injera samples stored for 4 days. However, there was no significant difference in the lightness of injera samples stored for the 2 days. The lightness color of injera samples was varied from 47.18 to 59.82; 44.58 to 57.23; and 40.92 to 53.11 for sample from the day of baking, 2nd, and 4th days of storage, respectively. Injera prepared from BR1 composite flour, fermented for 108 h had the highest L* value (59.82) and showed a significant (p < .05) difference with the control. The lowest L* value was observed for BR4 composite flour and fermented for 36 h.
Table 1. Effect of blending ratio and fermentation time on color (L*, a* and b*) of different injera samples stored for four days.
As the proportion of PMF and FT increased the L* value of injera also increased, whereas the proportion of BWF increased in the injera batter the lightness decreased. The increased L* value also observed as the FT increased and this may be attributed to the pigment extraction during the starch hydrolysis process occurred in fermentation (Altan et al., Citation2008). However, the decline in lightness of injera samples as the proportion of BWF increases and the FT decreased, this trend might be due to the presence of lower level of pigments in BWF. These results were in-line with the reports of Cherie, Ziegler, Fekadu Gemede, et al. (Citation2018), reported that L* value ranged between 54.65 and 63.17 for injera prepared from teff-maize-rice composite flour.
There was significant (p < .05) effects on the yellowness (b*) values of prepared injera from blends on 1st and 2nd days due to interaction between BR and FT. The highest yellowness (19.10, and 15.41) was determined for the injera on the day of baking and 2nd days of storage were recorded for the injera prepared from BR1 composite flour fermented at 36 h (FT 1). In contrast, the lowest yellowness (b*) values (9.39, and 9.13) were observed for injera prepared from BR4 composite flour fermented at 108 h. However, blended injera stored for the 4th day does not have a significant (p ˃ .05) effect on the yellowness of injera due to the interaction of BR and FT.
The interaction of BR and FT had shown a significant (p < .05) effect on the redness (a*) value of injera and ranged from 1.79 to 4.67; 2.23 to 5.40; and 2.84 to 5.87 for 1st, 2nd, and 4th days of storage, respectively. This result observed in the present study is in close agreement with Dasa and Binh (Citation2019), reported a* values varied from 2.12 to 4.46 for injera prepared from improved millet varieties. The highest value of a* at 1st, 2nd, and 4th days of storage were observed for injera prepared from BR4 composite flour fermented for 36 h. While the lowest value of a* observed for 2nd and 4th days of storage was obtained for injera made from BR1 composite flour fermented for 108 h (FT 3). However, the lowest values for 1st day storage were observed for injera made from the control fermented at 108 h (FT 3). The present study results are in agreement with Yasin (Citation2021), observed similar trends of increase in L* value and decrease in both a* and b* values of injera prepared from quality maize and teff composite flour as the FT increased from 48 h to 72 h. The results of L*, a*, and b* values of the present study were similar to Dasa and Binh (Citation2019) reported as L*, a*, and b* values varied between 47.96–57.88; 2.12–4.46; and 3.63–8.40, respectively, for injera made from improved millet varieties.
3.3. Effect of BR and FT on texture of injera stored for 4 days
Several changes always happen during the injera-making process and storage. This changes may lead to the issues in safety, quality, and acceptance of injera. One of these alteration is staling that incurred during storage, referring to the loss of freshness which imposes organoleptic change primarily in baked products texture, in addition to taste and aroma (Chavan & Chavan, Citation2011). Staling primarily leads to the firming of the injera that begins during the cooling periods of products which progressively become harder and dry during the storage (Cappelli et al., Citation2020).
The instrumental texture (firmness) measurement of prepared injera on the day of baking and the 2nd and 4th days of storage are presented in . The interaction of BR and FT had a significant (p < .05) effect on the firmness of injera samples. The highest cutting force value (13.62 N, 20.10 N, and 28.55 N) was obtained for injera made from BR1 composite flour fermented at FT 1 while the lowest value (9.66 N, 13.20 N, and 15.50 N) was recorded for injera prepared from BR4 fermented at 108 h on the day of baking, 2nd and 4th days of storage, respectively.
Table 2. Effect of blending ratio and fermentation time on texture (N)of different injera.
The increase in the PMF significantly increased the firmness of prepared injera. The increase in hardness (firmness) of prepared injera may be due to the result of starch retrogradation and moisture distribution (Lee et al., Citation2008). An interesting observation was made for the injera with greater than 10% BWF incorporation, the firmness of injera significantly less than the control. Whereas incorporation of higher than 20% PMF significantly increased the hardness of injera than the control. As a result, injera from BR3 and BR4 just after baking, on 2nd and 4th days of storage were softer texture and showed lower firmness than the control. From the results of this study, firmness of injera decreases with an increase of BWF incorporation in the composite flour at higher FT, and the firmness trends observed in the present study were found consistent with the finding of Chis et al. (Citation2020).
3.4. Effect of BR and FT on proximate composition of injera
The effects of BR and FT on the proximate composition of injera samples are presented in .
Table 3. Effect of blending ratio and fermentation time on proximate composition (on dry base) of different injera samples.
3.4.1. Moisture content
The interaction of BR and FT had not showed significant (p ˃ .05) effect on the moisture content of blended injera (). However, the BR effect on the moisture content of injera was significant (p < .05). The highest moisture value (8.39%) of injera was obtained from BR1 while, the lowest moisture value (6.75%) was observed in BR4. This may be due to the low water absorption of PMF and high water absorption of BWF. These results were similar to the moisture content (5.55% to 8.25%) of composite injera formulated from teff, sorghum, and faba bean reported by Mihrete and Bultosa (Citation2017).
The moisture content of blended injera is significantly (p < .05) influenced by FT. As the FT increased from 36 h to 108 h, the moisture content of injera significantly increased from 7.57% to 7.83%, respectively. Mihrete and Bultosa (Citation2017) reported that moisture content of composite injera formulated from teff, sorghum, and faba bean increased when FT increased.
3.4.2. Crude protein
The interaction effect of BR and FT showed significant (p < .05) difference on protein content of the injera. The protein content of injera prepared in this study ranged from 9.06% to 11.82%. The highest protein content (11.82%) was observed in the injera prepared from BR1 fermented for FT 3, while the lowest protein content (9.06%) was found in the control injera fermented for 36 h (FT 1). The protein content in all formulated injera samples was increased with an increase in ratio of PMF and BWF. This increase in protein content of the injera samples was attributed to the blending effect of high protein contained in PMF and BWF. Hence, the entire blended injera had more protein content than the control injera. In reality, buckwheat is considered as an attractive protein source due to its high content of essential amino acids, especially lysine and tryptophan are limited quantities in other common cereal grains (Zhou et al., Citation2015).
The protein content of the injera reported in the current study was higher than the protein content (6.37% to 8.67%) of quality protein maize, teff, and cassava incorporated injera (Woldemeskel et al., Citation2014). The protein content of injera obtained in this study is comparable to the protein content of quality protein maize and teff composite injera varied from 11.17% to 13.75% (Asrat Yasin, Citation2019). Hence, the combination of cereal grain protein and pseudocereal protein would provide balanced essential amino acid, helping to overcome the world protein-energy malnutrition problems (Mahata, Citation2018). Particularly, this is important for low-income countries like Ethiopia, where injera is the major staple food prepared from cereals. Hence, the injera prepared in this study is a good source of protein for gluten-sensitive consumers.
The protein content was also increased as the FT extended from 36 h to 108 h. The partial loss of dry matter occurred during fermentation is responsible for the increase in the protein levels of the injera (Wedad et al., Citation2008). Additionally, it is known that fermentation particularly bacterial fermentation increases the concentration of the amino acid lysine in cereals formulations. It is also reported by researchers where bacterial fermentation increases the lysine content and it facilitates the good quality cereal proteins (Stephen et al., Citation2000). In addition, the enzymes produced due to the microflora in the fermentation hydrolysis of the anti-nutritional factors takes place. This reduction in phytic acid and tannins (complexes of phytate-protein and tannin-protein released) contributes to the improved digestibility of the proteins and the protein bioavailability also enhanced in the fermented foods (Bautista-Expósito et al., Citation2018; Pranoto et al., Citation2013). The same is true in case of the injera fermentations. Similarly, Mihrete and Bultosa (Citation2017) reported that injera prepared from TF fermented for 24, 48, and 72 h had a protein content of 11.08%, 12.52%, and 12.66%, respectively. The protein content of injera was significantly increased as the BR of PMR and BWF and FT increased.
3.4.3. Total ash
The interaction of BR and FT is not significantly (p ˃ .05) affected the total ash content of the injera samples. However, the total ash content of the injera samples was significantly (p < .05) affected by the BR only. The total ash content of injera samples in the study ranged from 1.79% to 2.22%. The total ash content of injera samples was increased with rise in TF and BWF portions in the formulation. This may be due to the presence of higher mineral content in TF and BWF. The total ash content obtained in the present study was in line with the ash value (1.74%–2.76%) of injera prepared from teff, maize, and rice flour reported by Cherie, Ziegler, Gemede, et al. (Citation2018).
The total ash content of blended injera fermented for 36 h, 72 h, and 108 h observed as 2.02%, 2.00%, and 1.99%, respectively. This study showed that FT had not showed a significant (p ˃ .05) effect on the ash content of injera. Although the effect of FT is not shown statistically significant influence, the ash content of injera samples were decreased as FT increased.
3.4.4. Crude fat
The interaction of BR and FT showed a significant (p < .05) effect on the fat content of prepared injera as shown in . The crude fat content in injera samples ranged from 2.60% to 5.10%. The highest crude fat content (5.10%) of injera samples was observed for injera prepared from BR1 fermented for FT1, while the lowest value (2.60%) was observed in the control injera sample fermented for FT 3. These results were in close agreement with the finding of Nehra et al. (Citation2018), reported crude fat content of bread incorporated with PMF varied between 4.18% and 4.54%. When the BR of PMF increased in the composites, the percentage of crude fat content was significantly increased and this could be due to the higher crude fat content of the PMF (7.50%) compared to BWF (5.40%) and TF (4.70%).
As the FT increased from 36 h to 108 h, the gradual decrease in crude fat content was observed. The decrease in the fat content of fermented maize samples has been reported by Adegbehingbe (Citation2013). Similarly, Assohoun et al. (Citation2013) reported reduction in fat content during the fermentation of maize-based foods. The reduction in fat content observed as the FT increased, and this might be due to the utilization of lipids by the microorganisms part of their metabolic activities during the fermentation (Mbata et al., Citation2007). It could also be attributed to the increased activities of the lipolytic enzymes, which hydrolyze fat components into fatty acid and glycerol during fermentation (Bello et al., Citation2020).
3.4.5. Crude fiber
The interaction of BR and FT had a significant (p < .05) influence on the crude fiber content of blended injera and the values were ranged from 1.97% to 2.56%. The highest crude fiber content (2.56%) of injera sample was observed in injera from BR4 fermented for 36 h while, the lowest value (1.97%) was observed for injera prepared from the 100% teff flour fermented for 108 h (FT 3). The results of the current study were in line with the finding of Mihrete and Bultosa (Citation2017), reported the crude fiber content of injera prepared from teff, sorghum, and faba bean flours blend in the range of 1.23% to 2.79%. The crude fiber content of injera samples showed an increasing trend with the higher proportion of BWF and PMF as compared with control injera. The increase in crude fiber content could be attributed to the presence of more fiber in BWF and PMF. Studies have revealed that higher fiber foods provide different health benefits such as reducing in blood pressure and controlling blood sugar levels, reducing the risk of developing type-2 diabetes, and helping to achieve a healthy weight (Smith & Tucker, Citation2011). Therefore, based on this study results, it is important to blend different proportions of TF and PMF with BWF to easily meet the recommended daily allowance of the fiber (Rasane et al., Citation2013).
The crude fiber values were also found to significantly decrease with increasing the FT. This could be attributed to the partial solubilization of cellulose and hemicellulose type of material through microbial enzymes (Afify et al., Citation2012). It could also attribute to the enzymatic breakdown of the fiber during fermentation by lactic acid bacteria which utilized the fiber as a carbon source (Ojokoh et al., Citation2013). Similarly, Asrat Yasin (Citation2019) concluded that injera prepared from blending flour of maize and teff flour fermented for 48 h, 60 h, and 72 h had a crude fiber content of 2.81%, 2.78%, and 2.74%, respectively. This study revealed that the crude fiber content of injera was significantly decreased as both the BR of TF and the FT increased.
3.4.6. Carbohydrate content
The interaction of BR and FT had not shown any significant (p ˃ .05) effect on the carbohydrate content of blended injera. However, the main effect of BR had a highly significant (p < .05) influence on the carbohydrate content of injera and the values ranged from 71.60% to 74.41%. Injera prepared from control flour fermented for 36 h obtained the highest content of carbohydrate, while injera made from BR1 composite flour fermented for 108 h observed the lowest carbohydrate content. The results showed that as the proportion of TF increased, the carbohydrate content of injera significantly increases. This could be due to the highest carbohydrate content of TF (74.90%) than PMF (69.87%) and BWF (69.63%). Hence, the carbohydrate content of the control teff injera was higher than the injera from blended flours. This result was in agreement with carbohydrates (60.74% to 75.66%) reported for teff, sorghum, and faba bean blended injera (Mihrete & Bultosa, Citation2017).
The significant (p < .05) differences in the carbohydrate content of blended injera were observed due to FT. The carbohydrate content of injera samples subjected to different fermentation times set at 36 h, 72 h, and 108 h was 73%, 72%, and 71%, respectively. This results revealed that carbohydrate content decreased as the FT extended from 36 h to 108 h. The reduction in carbohydrates might be due to the degradation of principal substances by fermenting microorganisms, particularly starch and soluble sugars (Feyera et al., Citation2021). These findings were in close agreement with the report of Asrat Yasin (Citation2019) that showed a gradual decrease in carbohydrate content as the FT increased.
3.4.7. Total energy
The gross energy content is the reflection of the presence of carbohydrate, protein, and fat content in the food samples. There was no significant (p ˃ .05) difference was observed in gross energy of injera samples due to the interaction effect of BR and FT. However, the BR (the main effect) had a significant (p < .05) effect on the gross energy content of the injera, and the values varied from 370.24 to 374.29 kcal/100 g. The highest energy value (374.29 Kcal/100 g) was recorded in BR1, while the lowest value (370.24 kcal/100 g) was observed in injera from BR4 composite flour. The result has shown that the addition of more proportion of PMF and BWF into the formulation of the energy content of injera also increased. The possible reason might be due to the highest value of fat in PMF and protein in BWF. The results were in accordance with the findings of Mihrete and Bultosa (Citation2017), reported that the energy value ranged from 337.37 to 376.43 kcal/100 g of injera made from teff, sorghum, and faba bean flour. Significant difference between the injera samples prepared from the composite flour and the control injera was observed in this study. The energy values of composite flour injera were greater than the control injera due to the higher fat content observed in composite injera.
Significant (p < .05) effect was observed in the energy content of injera due to FT. The energy values of injera fermented for 36 h, 72 h, and 108 h were 372.98 kcal/100 g, 370.59 kcal/100 g, and 369.20 kcal/100 g, respectively. The highest energy value (372.98 kcal/100 g) was shown for FT 36 h (FT 1), while the lowest (369.20 kcal/100 g) was found at 108 h (FT 3). The decrease in energy content with an increase in FT might be due to consumption of basic nutrients like, carbohydrates, fat, and protein by the fermentative microbes (Mbata et al., Citation2007). The current finding on energy value in injera is in agreement with the work of Mihrete and Bultosa (Citation2017), reported the fat content of teff, sorghum, and faba bean composite injera energy composition had decreased with an increase in FT from 24 h to 72 h.
3.5. Effect of BR and FT mineral (Fe, Ca and Zn) composition of injera
3.5.1. Iron content
The iron content of injera prepared by composite flour is presented in . The interaction of BR and FT had a highly significant (p < .01) influence on the iron content of injera. The iron content of injera ranged from 9.56 to 12.82 mg/100 g.
Figure 2. Effect of blending ratio and fermentation time on the mineral content and total phenolic contents of injera (a). Iron; (b) Calcium; (c) Zinc; (d) Total phenolic contents. The values expressed were mean±sd with triplicate experiments. Bars with different superscript (a, c, b, c.) letters are significantly different (p < .05). Where BR1 (Perl Millet Flour 40: Teff Flour 55: Buckwheat flour 5), BR2 (Perl Millet Flour 30: Teff Flour 60: Buckwheat flour 10), BR3 (Perl Millet Flour 20: Teff Flour 65: Buckwheat flour 15), BR4 (Perl Millet Flour 10: Teff Flour 70: Buckwheat flour 20), and Control (100% Teff Flour).
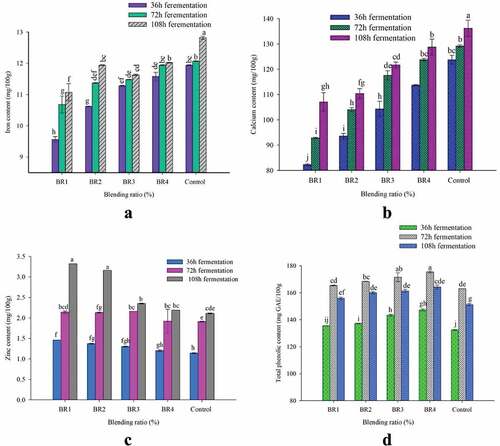
The highest Fe content was obtained from the control (12.82 mg/100 g) sample fermented at 108 h (FT 1), while the lowest value was obtained in BR1 fermented for 36 h. The similar Fe contents in the injera were also reported by Mihrete and Bultosa (Citation2017) ranged from 11.56 to 21.65 mg/100 g for teff, sorghum, and faba bean flour fermented for 24, 48, and 72 h. Results of this study revealed that the blending of PMF and BWF showed a negative impact on the iron content of injera. Out of the three components considered in the preparation of injera in this study, the TF is known as the good source of iron. However, as the FT increased from 36 h to 108 h the iron content significantly increased. The increase in iron content might be attributed to the release of iron from chelated complex by the action of fermenting microorganisms (Wedad et al., Citation2008). Moreover, fermentation pH is reduced and it leads to an optimal environment for phytase activity to degrade phytate (Castro‐Alba et al., Citation2019).
3.5.2. Calcium content
The interaction of BR and FT had shown a significant (p < .05) effect on the Ca content of injera (). The Ca values ranged from 82.28 to 136.22 mg/100 g in the prepared injera. The highest Ca (136.22 mg/100 g) value was noted for the control injera fermented at 108 h, while the lowest (82.28 mg/100 g) was obtained in BR1 fermented for 36 h (FT 1). The Ca composition of the injera in present study was lower than the Ca content of injera (123–187.25 mg/100 g) made from sorghum, teff, and faba bean composite flour as reported by Mihrete and Bultosa (Citation2017). The Ca content (67.66–92.70 mg/100 g) in the present study observed in agreement with the reports of Asrat Yasin (Citation2019).
The addition of PMF and BWF significantly decreased the Ca content of injera. This could be attributed to the presence of more calcium in TF. However, FT significantly increases the calcium content of injera. This might be due to the reduction of anti-nutritional factors by fermenting microorganisms (Ahmed et al., Citation2020). The increase in Ca during fermentation may also be due to the loss of dry matter attributes as fermenting microorganisms degrade carbohydrates, crude fat, and crude fiber (Pranoto et al., Citation2013).
3.5.3. Zinc content
High significant (p < .01) influence was observed in zinc content of injera due to the interaction effect of BR and FT (). The maximum zinc content (3.32 mg/100 g) was obtained in injera prepared by BR1 fermented for 108 h. However, the highest Zn content in the injera prepared from BR1 and BR2 fermented for FT 3 are statistically not different; however, these two runs are different from others (BR3, BR4, and Control). The minimum zinc content (1.14 mg/100 g) was obtained from the control injera fermented at 36 h. The lowest values of the Zn in the injera prepared from BR3, BR4, and control are significantly not different. The zinc value of injera in this study is comparable with findings (1.62–2.10 mg/100 g) reported by Cherie, Ziegler, Fekadu Gemede, et al. (Citation2018) for teff, maize, and rice-based injera.
The results also revealed that as the proportion of PMF increased the Zn content of injera significantly increased. This might be attributed to the presence of more zinc content in PMF than TF and BWF. In addition to the BR, the FT also has a significant effect on the zinc content of injera. As the FT increased from FT1 to FT3, the zinc content of injera was significantly increased. This might be due to the reduction of dry matter by fermenting microorganisms (Ahmed et al., Citation2020).
3.6. Total phenolic content
The effects of BR and FT on the total phenolic content of injera are summarized in . The interaction of BR and FT showed significant (p ≤ .05) effect on the total phenolic content of injera and the values varied from 132.42 to 175.38 mg GAE/100 g. The highest total phenolic content value (175 mg GAE/100 g) was observed in the injera prepared from BR4 fermented for 72 h. However, the value of total phenolic content of the injera from BR3 fermented for 72 hours is not statistically different from the value of BR4. The lowest total phenolic content value (132.42 mg GAE/100 g) was obtained from control injera fermented for 36 h. There is no statistically difference between the injera produced from the BR1 and the control fermented for 36 h.
The total phenolic contents of injera samples were significantly increased with rise in the proportion of BWF in the blends and FT increased from 36 h to 108 h. Each studied blending ratio demonstrated an increase in total phenolic content of 31.4 to 64.9% after fermentation. The increase in total phenolic content of injera samples might be due to the action of endogenous and microbial enzymes initiated during the fermentation, which leads to the release of bounded phenolic compounds. The yeast and lactic acid bacteria involved in the fermentation have the capability to synthesize enzymes like esterases, xylanases, and phenoloxidase. These enzymes are capable to breakdown ester linkages to release bounded phenolic compounds in the form of soluble phenolic compounds (Oliveira et al., Citation2015). Similar trend to the present study in total phenolic content reported from 31 to 54% in injera made from teff as fermentation time raised to 120 h (Shumoy, Gabaza, et al., Citation2010).
3.7. Effect of BR and FT on anti-nutritional factors of injera
3.7.1. Phytic acid
Phytic acid is the primary storage compound of phosphorus in cereals, legumes, pseudo cereals, and oilseeds (Fischer et al., Citation2014). The intake of phytate has a direct connection with the poor iron, zinc, and calcium status of foods in low-income countries. The interaction effects of BR and FT time on the phytate content of injera are depicted in .
Figure 3. Effect of blending ratio and fermentation time on anti-nutritional factors of injera (a). Phytate; (b) Tannin. The values expressed were mean±sd with triplicate experiments. Bars with different superscript (a, b, and c) letters are significantly different (p < .05). Where BR1 (Perl Millet Flour 40: Teff Flour 55: Buckwheat flour 5), BR2 (Perl Millet Flour 30: Teff Flour 60: Buckwheat flour 10), BR3 (Perl Millet Flour 20: Teff Flour 65: Buckwheat flour 15), BR4 (Perl Millet Flour 10: Teff Flour 70: Buckwheat flour 20), and Control (100% Teff Flour).
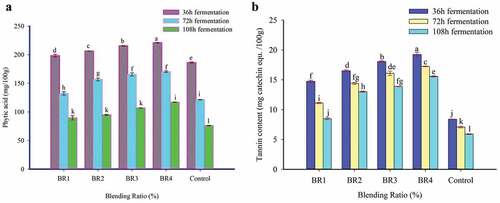
The interaction of BR and FT had shown a significant (p < .05) effect on the phytate content of injera, and the value was ranged from 89.56 to 221.07 mg/100 g. The highest phytate (221.07 mg/100 g) was observed in injera prepared from BR4 fermented at 36 h while, the lowest value (89.56 mg/100 g) was obtained for BR1 fermented at 108 h (FT 3). The reduction of phytate in the current study varied from 22.89% to 59.18% as a result of interaction effects of BR and FT. This is in-line with the findings of Mihretie (Citation2019), reported the reduction of phytate from 4.47 to 55.08% as the fermentation time of teff, sorghum, and faba bean composite increased from 24 h to 48 h, and 72 h.
The significant reduction in phytate content during fermentation might be attributed to the enzymatic hydrolysis of phytic acid by the microbes involved in the fermentation process (Rahman & Osman, Citation2011). It is also attributed to the formation of optimum pH conditions during fermentation for enzymatic degradation of phytate (Feyera et al., Citation2020).
3.7.2. Condensed tannin
The condensed tannin content of prepared injera is showed in . The interaction of BR and FT showed significant (p < .05) effect on the condensed tannin content of injera samples. The highest condensed tannin (19.23 mg Catechin Eq/100 g) content was observed in injera from BR4 fermented at 36 h while, the lowest value (5.90 mg Catechin Eq/100 g) was observed in control injera fermented for 108 h. The condensed tannin content in the control injera had lower than the corresponding composite injera. This might be due to the presence of higher tannin content in the BWF and PMF than TF.
The present study results showed that FT had a significant (p < .05) effect on the condensed tannin content of injera samples. When the FT increased from 36 h to 108 h, the condensed tannin content of prepared injera was reduced. The reduction in the condensed tannin content during the fermentation could be due to the activity of polyphenol oxidase and/or tannase of fermenting microflora on the tannins (Feyera et al., Citation2021). Moreover, microorganisms involved in the fermentation are responsible for the cleavage of tannin-protein, tannic acid-starch, and tannin-iron complexes thus, releasing the free nutrients which invariably improve the availability of nutrients (Onweluzo & Nwabugwu, Citation2009).
3.8. Effect of BR and FT on microbial quality of injera
3.8.1. Total aerobic plate count
The effect of BR and FT on total aerobic plate count of injera at the time of baking (fresh), and storage (3rd and 6th days) was presented in . On the day of baking, there is no total aerobic plate and yeast and mold colony counts were observed in all the injera samples. This could be due to the baking condition of injera (baked for 3 min at around 220°C) can destruct the microorganism (Jula, Citation2020).
Figure 4. Effect of blending ratio and fermentation time on Microbial quality of Injera. (a). Total aerobic plate count; (b). Total yeast and mold count of injera.
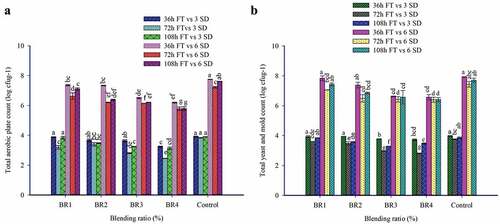
In all the prepared injera samples, total aerobic plate counts were observed in increasing trend as the storage duration increased. The interaction of BR and FT had shown a significant (p < .05) effect on the total aerobic plate counts of injera samples and the values ranged from 2.45–3.92 log cfu/g and 5.78–7.75 log cfu/g for injera 3rd and 6th days of storage, respectively. The highest numbers of total aerobic plate counts were recorded in control injera fermented at 36 h (FT 1), while the lowest numbers of aerobic plate counts were observed in BR4 fermented at 72 h (FT 2) for 3rd day storage. As the injera is a high moisture staple diet and packed in a traditional practice exposed to the room temperatures are the responsible for the spurt growth of the microbes in the injera samples as the storage durations increased. Researchers reported that injera in traditional conditions can be stored from 2 to 4 days. However, the shelf life of the injera depends on the many factors like the injera composition, fermentation practice, baking practice, and storage conditions and the level of hygiene maintained (Neela & Fanta, Citation2020).
By incorporation of BWF from 5% to 20%, the total plate count of injera significantly decreased from 3.64–2.94 log cfu/g, and 7.03–5.93 log cfu/g for 3rd and 6th day of storage, respectively. This might be due to the relatively higher phenolic compounds reported in BWF than TF and PMF. The phenolic compounds are possessing the ability to inhibit the growth of microbes (Nešović et al., Citation2021). The raise in total aerobic plate counts were observed at 36 h FT of injera sample and significantly decreased as the FT was extended from 36 h to 108 h. The significant reduction of total aerobic plate count during 72 h fermentation might be due to the low pH of injera and the production of secondary metabolites (Bacteriocins) from the fermenting microbes like lactic acid bacterial. This observation was similar to the findings reported by Asrat Yasin (Citation2019).
3.8.2. Total yeast and mold count
The interaction of BR and FT had showed significant (p < .05) effect on the total yeast and mold counts of injera samples stored at the 3rd and 6th day of storage as shown in . The yeast and mold counts of injera samples varied from 2.82–3.98 log cfu/g and 6.40–7.94 log cfu/g for 3rd and 6th days of stored injera, respectively. The highest number of total yeast and mold counts was obtained in control injera fermented at 36 h, whereas the lowest number of total yeast and mold counts were recorded in BR4 fermented at 72 h for both 3rd and 6th days of storage.
The total yeast and mold count levels were significantly lower in the blended injera after the 3rd and 6th day of storage as compared with control injera samples. This could be attributed due to active antifungal activities presented in BWF (Wang et al., Citation2019). These results are in line with the finding of Lin et al. (Citation2013), who reported that the BWF exhibited the highest antimicrobial activities. As the FT duration increased from 36 h to 72 h a gradual decrease in the yeast and mold counts were observed in contrast, the FT extended from 72 h to 108 h, the number of yeast and mold counts slightly increased. The reduction in the number of total yeast and mold counts in 72 h fermentation might be attributed to the low pH conditions, which are not favorable for most of the yeast and mold growth.
The maximum microbial permissible limits in ready-to-eat baked products for total aerobic bacterial colony counts and yeast and mold counts determined as 2.0 × 10⁵ cfu/g and ˂1 × 10⁴ cfu/g, respectively (Saddozai & Samina, Citation2009). The developed injera has a lower microbial profile as compared to standard maximum permissible limits in ready-to-eat baked products up to 3rd day of storage. This study results showed the use of BWF and PMF flour in injera preparation is beneficial to prevent yeast, mold, and total aerobic bacteria spoilage.
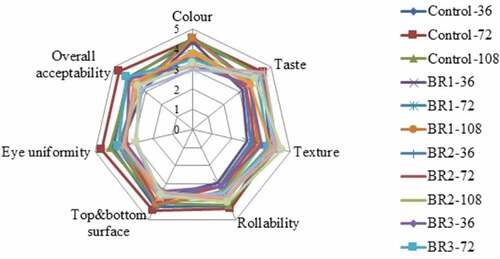
3.9. Effect of BR and FT on sensory acceptability of injera
The sensory evaluation of color, taste, texture, rollability, top and bottom surface appearance, eye uniformity, and overall acceptability of injera are presented in and Appendix . The sensory score of the products from all the treatments had a mean value greater than 2.5, it indicates that all the samples were liked by the panelist. The primary sensory quality and acceptability of traditional baked products is judged by their color. The interaction of BR and FT had no significant (p ˃ .05) effect on the color of injera and acceptability score ranged from 3.16 to 4.51. The color value of BR1 (4.51) was the most preferred by the panelist, while the BR4 (3.16) was the least preferred for color. There was a significant (p < .05) differences showed between the control and injera prepared from BR2, BR3, and BR4 in color acceptability. However, there was no significant (p ˃ .05) difference between injera prepared from BR1 and control.
Figure 5. Effect of blending ratio and fermentation time on sensory acceptability of injera. Where, BR1 (Perl Millet Flour 40: Teff Flour 55: Buckwheat flour 5), BR2 (Perl Millet Flour 30: Teff Flour 60: Buckwheat flour 10), BR3 (Perl Millet Flour 20: Teff Flour 65: Buckwheat flour 15), BR4 (Perl Millet Flour 10: Teff Flour 70: Buckwheat flour 20), and Control (100% Teff Flour). 36, 72 and 108 in the graph represents the hours of fermentation taken place.
The color acceptability score was significantly reduced with an increasing level of BWF in injera preparation because they had higher values of yellowness and lower lightness (Mudgil et al., Citation2017). It is also attributed to more tannin content in BWF, which could change the color of injera to brown. The results were in close agreement with Iffat Batool and Alam Zeb (Citation2016), reported that the addition of more BWF in the blend leads to browning of the bread. Statistically significant (p < .05) color acceptability differences were obtained as the FT increased from 36 to 72 and 108 h, and the score was varied from 3.72 to 3.91 and 4.03, respectively (Appendix ). The increase in FT has significantly increased the acceptance of injera color. This could be due to the pigment degradation during the fermentation process (Altan et al., Citation2008).
Taste is the most important attribute which determines the quality of baked cereals products (Hansen & Schieberle, Citation2005). Good quality injera could be slightly sour to have the desired taste combination with stew (in Amharic term is “wot”) (Abit, Citation2018). Injera made from the insufficiently fermented batter (aflegna) gives injera with the sweetish taste and overfermented batter imparts too sour flavor so, optimum fermentation is very important. The interaction of BR and FT showed a significant (p < .05) difference in taste acceptability of injera. The highest (4.59) taste acceptability score of injera was obtained from BR4 fermented for 72 h, followed by the control fermented for FT 2. The lowest (3.20) taste score was received for the injera made from BR1 fermented for 36 h. Incorporation of >15% BWF and <20% PMF into TF was found to improve the taste of the blended injera. This could be due to flavor compounds, which are available in BWF. Additionally, FT had significantly influenced the taste acceptability scores of injera. In general, increase in the FT up to 72 h resulted in an increased taste scores. The increase in taste up to 72 h might be due to the effect of lactic acid bacteria, which synthesized organic acids and different flavor compounds (McFeeters, Citation2004).
The texture is an important sensory attribute often used to measure the quality of cereal-based baked products. It is determined by touch and refers to the degree of softness or hardness of injera. The interaction of BR and FT had not showed significant (p ˃ .05) effect on the texture of injera. However, the BR alone had a significant (p < .05) effect on the texture of the injera and the acceptability scores were varied from 3.07 to 4.38. The highest texture (softness) preference of injera was recorded for injera made from BR4, while injera made from BR1 was the least preferred. The texture (softness) scores of injera increased with an increase in the incorporation of BWF and TF. The texture acceptability values obtained in the present study were found consistent with the finding of Cherie, Ziegler, Gemede, et al. (Citation2018). There was a statistically significant (p < .05) difference shown in the texture acceptability of injera as the FT increased from 36 h to 72 h and 108 h, with a corresponding texture acceptability score of 3.49 to 3.74 and 3.96, respectively.
The interaction of BR and FT had shown a significant (p < .05) effect on the rollability of prepared injera and the acceptability scores varied from 2.95 to 4.39. The rollability of injera is connected with the lower staling properties of baked products. The staling in the product increases firmness and lowers the acceptability of the baked products during storage. Incorporation of PMF in the blending increased the firmness of prepared injera, while the addition of more BWF in the blending decreased the firmness of blended injera. The firmness of blended injera was also reduced as the FT increased from 36 to 108 h. The results of the present study are similar to the results found in blended injera by Mihrete and Bultosa (Citation2017). The sensory panelists mostly preferred the rollability of control injera over other injera from blended formulations. The rollability of injera made from BR4 followed by BR3 fermented at FT 3 was more appreciated by the panelist than 36 h and 72 h fermentation. It is obvious that the addition of millets and other composite flours effected the rollability. However, the rollability is not drastically changed and not turned to unacceptable.
The appearance of injera is one of the most vital parameters, which refers to the quality of the eye and underneath the appearance of injera. The eyes on the injera surface are the small honeycomb-like structure of the top surface formed due to the production and escape of CO2 during fermentation and baking (Woldemariam et al., Citation2019). The top and bottom surfaces of injera had not significantly (p ˃ .05) varied due to the interaction effect of BR and FT. However, the BR had showed a significant (p < .05) influence on the acceptability of top and bottom surface of prepared injera and varied from 3.58 to 4.29. The highest acceptability score of top and bottom surface of the injera was recorded in control injera followed by BR1, while the lowest top and bottom surface acceptability score was recorded for injera made from BR4. The addition of more BWF was decreased the scores of the injera top and bottom surface acceptability scores. It might be due to the less CO2 produced during fermentation. The effect of FT had also showed significant (p < .05) influence on the top and bottom surface of injera (Appendix ). As the FT extended from 36 h to 72 h and 108 h the acceptability scores of top and bottom surface of injera increased from 3.80 to 3.98 and 3.86, respectively.
The eye uniformity (eye size and eye distribution) of injera was significantly (p < .05) influenced by the interaction effect of BR and FT. The sensory score of the eye uniformity ranged from 2.88 to 4.63. The control injera fermented for 72 h received higher eye uniformity scores, followed by BR1 fermented for 72 h; while injera prepared from BR4 fermented at 108 h obtained the lowest sensory eye uniformity acceptability. As the FT increased (108 h), the injera was resulting in a few scattered eyes. All the prepared injera samples in the present study were rated sensory score greater than 3 which indicates that the eye uniformity score of injera was liked moderately by the panelist.
The interaction of BR and FT had a significant (p < .05) effect on the overall acceptability of injera and the sensory score varied from 3.15 to 4.68. The highest overall acceptability was recorded for control sample produced with 72 h FT followed by injera made from BR3 composite flour with 72 h FT. Whereas injera made of BR1 composite flour with 36 h FT was the least preferred. Injera fermented for 72 h showed better acceptance as compared to injera fermented for 36 h and 108 h. The response of panelists for the overall acceptability of injera was rated greater than 3, which indicates that the blended injera showed good acceptability.
Based on the current finding, the addition of PMF and BWF and FT significantly increased the sensory score of color, taste, and texture, while decreasing the score of top and bottom surface, rollability, and eye uniformity as compared to the control injera. All blended injera scored a mean rating well above average, which is indicated that all the blends are in sensorial acceptable range (). The most preferred blended injera was prepared from teff flour combined with 20% PMF and 15% BWF fermented for 72 h. A similar observation was made by Mihrete and Bultosa (Citation2017), reported that injera fermented for 72 h improves the sensory characteristics such as rollability, sour flavor, and underneath the appearance of blended injera.
4. Conclusion
The BR significantly increased the crude protein, crude fat, crude fiber, gross energy, Zn, total phenolic content of injera. However, total ash, carbohydrate, Fe, and Ca of the blended injera were reduced significantly. The FT also considerably increased the protein content, total phenolic composition, Zn, Fe, Ca, and sensory quality attributes of injera while, significantly reducing the crude fat, crude fiber, carbohydrate, energy, condensed tannins, and phytic acid content of the injera.
The interaction of BR and FT showed a significant effect on proximate composition, mineral content, anti-nutritional content, microbiological qualities, texture, and sensory quality attributes of injera. As the blending proportion of TF and BWF increased, better sensory preference was observed especially for texture, rollability, and taste. Moreover, the preference of color, texture, and rollability of injera improved as the FT increased. The acceptability of injera from 100% TF was superior in the preference of eye uniformity, top, and bottom surface appearance, and overall acceptability over other injera samples. Lower staling and firmness were obtained by increasing in the BWF proportions and FT.
Generally, from this study concluded that up to 30% PMF, and 20% BWF blending fermentation time of 72 h could be recommended in the preparation of nutritionally improved injera and it could be used as a substitution of teff injera. The higher sensory acceptance is typically achieved for injera with 5–15% BWF and 10–30% PMF blending with TF.
Acknowledgements
The authors are grateful to Bahir Dar Institute of technology (BiT) and Ethiopian Food, Beverage and Pharmaceutical Industry Development Institute (FBPIDI) for financing the project as part of the First Authors Masters study program sponsorship.
Disclosure statement
No potential conflict of interest was reported by the author(s).
Data availability statement
Data available within the article or its supplementary materials.
References
- Abebe, Y., Bogale, A., Hambidge, K. M., Stoecker, B. J., Bailey, K., & Gibson, R. S. (2007). Phytate, zinc, iron and calcium content of selected raw and prepared foods consumed in rural Sidama, Southern Ethiopia, and implications for bioavailability. Journal of Food Composition and Analysis, 20(29), 161–168. https://doi.org/10.1016/j.jfca.2006.09.003
- Abebe, W., Collar, C., & Ronda, F. (2015). Impact of variety type and particle size distribution on starch enzymatic hydrolysis and functional properties of teff flours. Carbohydrate Polymers, 115(2), 260–268. https://doi.org/10.1016/j.carbpol.2014.08.080
- Abit, D. (2018). Optimization of Absit process factors to improve the physicochemical and sensory quality of Teff [Eragrostis tef (Zucc.) Trotter] Injera [ Master’s Thesis]. Addis Ababa University. http://etd.aau.edu.et/handle/123456789/18799
- Adebo, O. A., Kayitesi, E., Tugizimana, F., & Njobeh, P. B. (2019). Differential metabolic signatures in naturally and lactic acid bacteria (LAB) fermented ting (a Southern African food) with different tannin content, as revealed by gas chromatography mass spectrometry (GC–MS)-based metabolomics. Food Research International, 121, 326–335. https://doi.org/10.1016/j.foodres.2019.03.050
- Adegbehingbe, K. T. (2013). Fermented sprouted and unsprouted maize for ogi production. International Journal of Advanced Research, 1(10), 428–434.
- Afify, A. E.-M. M. R., El-Beltagi, H. S., Abd El-Salam, S. M., & Omran, A. A. (2012). Protein solubility, digestibility and fractionation after germination of sorghum varieties. Plos One, 7(2), e31154. https://doi.org/10.1371/journal.pone.0031154
- Ahmed, M. I., Xu, X., Sulieman, A. A., Na, Y., & Mahdi, A. A. (2020). The effect of fermentation time on in vitro bioavailability of iron, zinc, and calcium of kisra bread produced from koreeb (Dactyloctenium aegyptium) seeds flour. Microchemical Journal, 154, 104644. https://doi.org/10.1016/j.microc.2020.104644
- Almaiman, S. A., Rahman, I. A., Gassem, M., Alhuthayli, H. F., Mohammed, M. A., Hassan, A. B., & Fickak, A. (2021). Biochemical changes during traditional fermentation of saudi sorghum (Sorghum bicolor L .) cultivars flour into Khamir (local gluten free bread). Journal of Oleo Science, 415(3), 409–415. https://doi.org/10.5650/jos.ess20311
- Altan, A., McCarthy, K. L., & Maskan, M. (2008). Twin-screw extrusion of barley-grape pomace blends: Extrudate characteristics and determination of optimum processing conditions. Journal of Food Engineering, 89(1), 24–32. https://doi.org/10.1016/j.jfoodeng.2008.03.025
- Annor, G. A., Marcone, M., Corredig, M., Bertoft, E., & Seetharaman, K. (2015). Effects of the amount and type of fatty acids present in millets on their in vitro starch digestibility and expected glycemic index (eGI). Journal of Cereal Science, 64, 76–81. https://doi.org/10.1016/j.jcs.2015.05.004
- AOAC. (1995). Official methods of analysis of AOAC International. AOAC Intl. Pv (Loose-Leaf).
- AOAC. (2000). Official Methods of Analysis (17th ed.). The Association of Official Analytical Chemists.
- AOAC. (2005). Official Method of Analysis 18th (ed.). Association of Officiating Analytical Chemists.
- Ashenafi, M., Ashenafi, M., & Mogessie, A. (2006). A review on the microbiology of indigenous fermented foods and beverages of Ethiopia. Ethiopian Journal of Biological Sciences, 5(2), 189–245. https://doi.org/10.4314/ejbs.v5i2.39036
- Asrat Yasin, U. (2019). Effect of blending ratio and natural fermentation time on the qualities of injera prepared from quality protein maize and teff flours. Haramaya University.
- Assohoun, M. C. N., Djeni, T. N., Koussémon-Camara, M., & Brou, K. (2013). Effect of fermentation process on nutritional composition and aflatoxins concentration of doklu, a fermented maize based food. Food and Nutrition Sciences, 4(11), 1120. https://doi.org/10.4236/fns.2013.411146
- Batu, M. M., Admasu, E., & Tolosa, F. (2016). Determinants of households’ willingness to pay for improved solid waste management in Ethiopia : The case study of Jimma Town. Journal of Environment and Earth Science, 6(7), 64–77.
- Bautista-Expósito, S., Martínez-Villaluenga, C., Dueñas, M., Silván, J. M., Frias, J., & Peñas, E. (2018). Combination of pH-controlled fermentation in mild acidic conditions and enzymatic hydrolysis by Savinase to improve metabolic health-promoting properties of lentil. Journal of Functional Foods, 48, 9–18. https://doi.org/10.1016/j.jff.2018.06.019
- Bello, A. A., Gernah, D. I., Ariahu, C. C., & Ikya, J. K. (2020). Physico-chemical and sensory properties of complementary foods from blends of malted and non-malted sorghum, soybean and Moringa Oleifera seed flours. American Journal of Food Technology, 8(1), 1–13.
- Berhane, G., Paulos, Z., Tafere, K., & Tamru, S. (2011). Foodgrain consumption and calorie intake patterns in Ethiopia. IFPRI Ethiopia Strategy Support Program II (ESSP II) Working Paper, 23, 1–17. https://www.ifpri.org/cdmref/p15738coll2/id/124853/filename/124854.pd
- Cappelli, A., Bettaccini, L., & Cini, E. (2020). The kneading process: A systematic review of the effects on dough rheology and resulting bread characteristics, including improvement strategies. Trends in Food Science & Technology, 104, 91–101. https://doi.org/10.1016/j.tifs.2020.08.008
- Castro‐Alba, V., Lazarte, C. E., Perez‐Rea, D., Carlsson, N., Almgren, A., Bergenståhl, B., & Granfeldt, Y. (2019). Fermentation of pseudocereals quinoa, canihua, and amaranth to improve mineral accessibility through degradation of phytate. Journal of the Science of Food and Agriculture, 99(11), 5239–5248. https://doi.org/10.1002/jsfa.9793
- Chavan, R. S., & Chavan, S. R. (2011). Sourdough technology—A traditional way for wholesome foods: A review. Comprehensive Reviews in Food Science and Food Safety, 10(3), 169–182. https://doi.org/10.1111/j.1541-4337.2011.00148.x
- Cherie, Z., Ziegler, G. R., Fekadu Gemede, H., & Zewdu Woldegiorgis, A. (2018). Optimization and modeling of teff-maize-rice based formulation by simplex lattice mixture design for the preparation of brighter and acceptable injera. Cogent Food & Agriculture, 4(1), 1–19. https://doi.org/10.1080/23311932.2018.1443381
- Cherie, Z., Ziegler, G. R., Gemede, H. F., & Zewdu Woldegiorgis, A. (2018). Design for the preparation of brighter and acceptable injera Optimization and modeling of teff-maize-rice based formulation by simplex lattice mixture design for the preparation of brighter and acceptable injera. Cogent Food & Agriculture, 3(1), 1443381. https://doi.org/10.1080/23311932.2018.1443381/
- Chis, M. S., Păucean, A., Man, S. M., Muresan, V., Socaci, S. A., Pop, A., Stan, L., Rusu, B., & Muste, S. (2020). Textural and sensory features changes of gluten free muffins based on rice sourdough fermented with Lactobacillus spicheri DSM 15429. Foods, 9(3), 363. https://doi.org/10.3390/foods9030363
- Dasa, F., & Binh, L. N. (2019). A comparative study on rheological, functional and color properties of improved millet varieties and injera. Journal of Agricultural Science and Food Research, 10(3), 1–8. https://doi.org/10.35248/2593-9173.19.10.267
- Desiye, A., Abegaz, K., Negera, E., & Gobena, E. (2017). The microbiology of teff (Eragrostis teff) enjera. The Microbiology of Teff (Eragrostis Tef) Enjera, 2(2), 115–120.
- Ethiopian Standard Agency. (2018). Teff seed Specification; ES 416: 2000. ESA.
- Feyera, M., Abera, S., & Temesgen, M. (2020). Effect of fermentation time and blending ratio on nutrients and s ome anti nutrient composition of complementary flour. European Journal of Food Science and Technology, 8(3), 1–12.
- Feyera, M., Abera, S., & Temesgen, M. (2021). Effect of fermentation time and blending ratio on nutrients and some anti nutrient composition of complementary flour. International Journal of Food and Nutrition Sciences, 5(1), 118–130.
- Fikadu, A. A., Wedu, T. D., & Derseh, E. A. (2019). Review on economics of teff in Ethiopia. Open Access Biostatistics & Bioinformatics, 2(3), 1–8. https://doi.org/10.31031/OABB.2019.02.000542
- Fikiru, D., Ly, N. B., Dasa, F., Binh, L. N., Fikiru, D., Ly, N. B., Dasa, F., & Binh, N. (2020). Variety and baking effects on injera making quality, polyphenols content and antioxidant activity of millet flours and injera. African Journal of Food Science, 14(5), 134–142. https://doi.org/10.5897/ajfs2020.1928
- Fischer, M. M., Egli, I. M., Aeberli, I., Hurrell, R. F., & Meile, L. (2014). Phytic acid degrading lactic acid bacteria in teff-injera fermentation. International Journal of Food Microbiology, 190, 54–60. https://doi.org/10.1016/j.ijfoodmicro.2014.08.018
- Gebremariam, M. M., Zarnkow, M., & Becker, T. (2014). Teff (Eragrostis tef) as a raw material for malting, brewing and manufacturing of gluten-free foods and beverages: A review. Journal of Food Science and Technology, 51(11), 2881–2895. https://doi.org/10.1007/s13197-012-0745-5
- Georgé, S., Brat, P., Alter, P., & Amiot, M. J. (2005). Rapid determination of polyphenols and vitamin C in plant-derived products. Journal of Agricultural and Food Chemistry, 53(5), 1370–1373. https://doi.org/10.1021/jf048396b
- Girma, T., Bultosa, G., & Bussa, N. (2013). Effect of grain teff (Eragrostis teff (Zucc.) Trotter) flour substitutions with flaxseed on mineral content, antioxidant activity, phytic acid content and microbial quality of injera. Science, Technology and Arts Research Journal, 2(3), 51–58. https://doi.org/10.4314/star.v2i3.98733
- Hansen, A., & Schieberle, P. (2005). Generation of aroma compounds during sourdough fermentation: Applied and fundamental aspects. Trends in Food Science & Technology, 16(1–3), 85–94. https://doi.org/10.1016/j.tifs.2004.03.007
- Hassan, R. A., Sand, M. I., & El-Kadi, S. M. (2012). Effect of some organic acids on fungal growth and their toxins production. Journal of Agricultural Chemistry and Biotechnology, 3(9), 391–397. https://doi.org/10.21608/jacb.2012.55011
- Iffat Batool, S., & Alam Zeb, M. Z. (2016). Sensory evaluation of breadstick of wheat flour supplemented with buckwheat flour. International Journal of Food Science and Nutrition, 1(5), 51–53.
- Jula, M. N. (2020). Quality and microbiological study of bambara groundnut fortified injera, a fermented flat bread. Thesis masters in applied sciences (M App Sc.) in food Science and Technology Department of Biotechnology and Food Technology Durban University of Technology. https://openscholar.dut.ac.za/handle/10321/3606
- Kebede, L., Worku, S., Bultosa, G., & Yetneberk, S. (2010). Effect of extrusion operating conditions on the physical and sensory properties of teff (Eragrostis teff [Zucc.] Trotter) flour extrudates. Ethiopian Journal of Applied Science and Technology, 1(1), 27–38.
- Kumar, A., Tomer, V., Kaur, A., Kumar, V., & Gupta, K. (2018). Millets: A solution to agrarian and nutritional challenges. Agriculture & Food Security, 7(1), 1–15. https://doi.org/10.1186/s40066-018-0183-3
- Kunyanga, C. N., Mbugua, S. K., Kangethe, E. K., & Imungi, J. K. (2009). Microbiological and acidity changes during the traditional production of kirario: An indigenous Kenyan fermented porridge produced from green maize and millet. African Journal of Food Agriculture Nutrition and Development, 9(6). https://doi.org/10.4314/ajfand.v9i6.46261
- Lee, C., Wang, H., & Lin, S. (2008). Effect of isomaltooligosaccharide syrup on quality characteristics of sponge cake. Cereal Chemistry, 85(4), 515–521. https://doi.org/10.1094/CCHEM-85-4-0515
- Lim, J. (2011). Hedonic scaling: A review of methods and theory. Food Quality and Preference, 22(8), 733–747. https://doi.org/10.1016/j.foodqual.2011.05.008
- Lin, L. Y., Wang, H. E., Lin, S. D., Liu, H. M., & Mau, J. L. (2013). Changes in buckwheat bread during storage. Journal of Food Processing and Preservation, 37(4), 285–290. https://doi.org/10.1111/j.1745-4549.2011.00647.x
- Mahata, D. (2018). Importance of buckwheat (Fagopyrum esculentum Moench). International Journal of Chemical Studies, 6(5), 2121–2125.
- Mbata, T. I., Ikenebomeh, M. J., & Ahonkhai, I. (2007). Nutritional status of maize fermented meal by fortification with bambara-nut. African Journal of Food Agriculture Nutrition and Development, 7(2), 1–14. https://doi.org/10.18697/ajfand.13.2115
- McFeeters, R. F. (2004). Fermentation microorganisms and flavor changes in fermented foods. Journal of Food Science, 69(1), 35–37. https://doi.org/10.1111/j.1365-2621.2004.tb17876.x
- Mihrete, Y., & Bultosa, G. (2017). The effect of blending ratio of teff [Eragrostis teff (Zucc) Trotter], Sorghum (Sorghum bicolor (L.) Moench) and Faba Bean (Vicia faba) and fermentation time on chemical composition of injera. Journal of Nutrition & Food Sciences, 7(2), 1–7. https://doi.org/10.4172/2155-9600.1000583
- Mihretie, Y. (2019). The mineral content and sensory properties of injera made from the faba bean, sorghum and teff flour blend. International Journal of Nutrition, 4(2), 1–13. https://doi.org/10.14302/issn.2379-7835.ijn-19-2629
- Mudgil, D., Barak, S., & Khatkar, B. S. (2017). Cookie texture, spread ratio and sensory acceptability of cookies as a function of soluble dietary fiber, baking time and different water levels. LWT- Food Science and Technology, 80, 537–542. https://doi.org/10.1016/j.lwt.2017.03.009
- Mwizerwa, H., Abong, G. O., Mbugua, S. K., Okoth, M. W., Gacheru, P., Muiru, M., Obura, B., & Viljoen, B. (2018). Current research in nutrition and food science profiling of microbial content and growth in fermented maize based products from Western Kenya. Current Research in Nutrition and Food Science, 6(2), 509–519. https://doi.org/10.12944/CRNFSJ.6.2.25
- Nascimento de Oliveira Do, K., Do Nascimento, D. P., Reis, S., de Oliveira, I., Pereira Reis, I., & Maria Augusta, I. (2018). Teff: Suitability for different food applications and as a raw material of gluten-free, a literature review. Journal of Food and Nutrition Research, 6(2), 74–81. https://doi.org/10.12691/jfnr-6-2-2
- Neela, S., & Fanta, S. W. (2020). Injera (an ethnic, traditional staple food of Ethiopia): A review on traditional practice to scientific developments. Journal of Ethnic Foods, 7(32), 1–15. https://doi.org/10.1186/s42779-020-00069-x
- Neela, S., Solomon, W. F., & Yildiz, F. (2018). Review on structural, nutritional and anti-nutritional composition of Teff (Eragrostis teff) in comparison with Quinoa (Chenopodium quinoa Willd.). Cogent Food & Agriculture, 4(1), 1–27. Article ID 1546942. https://doi.org/10.1080/23311932.2018.1546942
- Nehra, M., Siroha, A. K., Punia, S., & Kumar, S. (2021). Process standardization for bread preparation using composite blend of wheat and pearl millet: Nutritional, antioxidant and sensory approach. Current Research in Nutrition and Food Science Journal, 9(2), 511–520. https://doi.org/10.12944/CRNFSJ.9.2.14
- Nešović, M., Gašić, U., Tosti, T., Horvacki, N., Nedić, N., Sredojević, M., Blagojević, S., Ignjatović, L., & Tešić, Ž. (2021). Distribution of polyphenolic and sugar compounds in different buckwheat plant parts. RSC Advances, 11(42), 25816–25829. https://doi.org/10.1039/D1RA04250E
- Obadina, A. O., Akinola, O. J., Shittu, T. A., & Bakare, H. A. (2013). Effect of natural fermentation on the chemical and nutritional composition of fermented soymilk nono. Nigerian Food Journal, 31(2), 91–97. https://doi.org/10.1016/S0189-7241(15)30081-3
- Ojokoh, A. O., Daramola, M. K., & Oluoti, O. J. (2013). Effect of fermentation on nutrient and anti-nutrient composition of breadfruit (Treculia africana) and cowpea (Vigna unguiculata) blend flours. African Journal of Agricultural Research, 8(27), 3566–3570. https://doi.org/10.5897/AJAR12.1944
- Ojokoh, A. O., Fayemi, O. E., Ocloo, F. C. K., & Nwokolo, F. I. (2015). Effect of fermentation on proximate composition, physicochemical and microbial characteristics of pearl millet (Pennisetum glaucum (L.) R. Br.) and Acha (Digitaria exilis (Kippist) Stapf) flour blends. Journal of Agricultural Biotechnology and Sustainable Development, 7(1), 1–8. https://doi.org/10.5897/JABSD2014.0236
- Oliveira, M. D. S., Cipolatti, E. P., Furlong, E. B., & Soares, L. D. S. (2012). Phenolic compounds and antioxidant activity in fermented rice (Oryza sativa) bran. Food Science and Technology, 32(3), 531–537. https://doi.org/10.1590/S0101-20612012005000071
- Onweluzo, J. C., & Nwabugwu, C. C. (2009). Fermentation of millet (Pennisetum americanum) and pigeon pea (Cajanus cajan) seeds for flour production: Effects on composition and selected functional properties. Pakistan Journal of Nutrition, 8(6), 737–744. https://doi.org/10.3923/pjn.2009.737.744
- Onyeike, E. N., Tamunosiki, O., & Augustine, A. U. (1995). Effect of heat-treatment and defatting on the proximate composition of some Nigerian local soup thickeners. Food Chemistry, 53(2), 173–175. https://doi.org/10.1016/0308-8146(95)90784-5
- Pranoto, Y., Anggrahini, S., & Efendi, Z. (2013). Effect of natural and Lactobacillus plantarum fermentation on in-vitro protein and starch digestibilities of sorghum flour. Food Bioscience, 2, 46–52. https://doi.org/10.1016/j.fbio.2013.04.001
- Price, M. L., Van Scoyoc, S., & Butler, L. G. (1978). A critical evaluation of the vanillin reaction as an assay for tannin in sorghum grain. Journal of Agricultural and Food Chemistry, 26(5), 1214–1218. https://doi.org/10.1021/jf60219a031
- Qin, P., Wang, Q., Shan, F., Hou, Z., & Ren, G. (2010). Nutritional composition and flavonoids content of flour from different buckwheat cultivars. International Journal of Food Science & Technology, 45(5), 951–958. https://doi.org/10.1111/j.1365-2621.2010.02231.x
- Rahman, I. E. A., & Osman, M. A. W. (2011). Effect of sorghum type (Sorghum bicolor) and traditional fermentation on tannins and phytic acid contents and trypsin inhibitor activity. Journal of Food, Agriculture & Environment, 9(3), 163–166.
- Rasane, P., Jha, A., Sabikhi, L., Kumar, A., & Unnikrishnan, V. S. (2013). Nutritional advantages of oats and opportunities for its processing as value added foods-a review. Journal of Food Science and Technology, 52(2), 662–675. https://doi.org/10.1007/s13197-013-1072-1
- Reichwald, K., & Hatzack, F. (2008). Application of a modified Haug and Lantzsch method for the rapid and accurate photometrical phytate determination in soybean, wheat, and maize meals. Journal of Agricultural and Food Chemistry, 56(9), 2888–2891. https://doi.org/10.1021/jf0730690
- Saddozai, A. A., & Samina, K. (2009). Microbiological status of bakery products available in Islamabad. Pakistan Journal of Agricultural Research, 22(1/2), 93–96.
- Sadler, G. D., & Murphy, P. A. (2010). pH and titratable acidity. Chemical Properties and Characteristics of Foods, 219–238. https://doi.org/10.1007/978-1-4419-1478-1
- Shumoy, H., Gabaza, M., Vandevelde, J., & Raes, K. (2017). Soluble and bound phenolic contents and antioxidant capacity of teff injera as affected by traditional fermentation. Journal of Food Composition and Analysis, 58, 52–59. https://doi.org/10.1016/j.jfca.2017.01.004
- Shumoy, H., Lauwens, S., Gabaza, M., Vandevelde, J., Vanhaecke, F., & Raes, K. (2017). Traditional fermentation of teff injera: Impact on in vitro iron and zinc dialysability. Food Research International, 102, 93–100. https://doi.org/10.1016/j.foodres.2017.09.092
- Smith, C. E., & Tucker, K. L. (2011). Health benefits of cereal fibre: A review of clinical trials. Nutrition Research Reviews, 24(1), 118–131. https://doi.org/10.1017/S0954422411000023
- Stephen, M., Wilfried, O., John, V. C., & Delphin, N. (2000). Amino acid profiles after sprouting, autoclaving, and lactic acid fermentation of finger millet (Eleusine Coracan) and kidney beans (Phaseolus Vulgaris L.). Journal of Agriculture and Food Chemistry, 48(8), 3081–3085. https://doi.org/10.1021/jf0002140
- Wang, C., Yuan, S., Zhang, W., Ng, T., & Ye, X. (2019). Buckwheat antifungal protein with biocontrol potential to inhibit fungal (Botrytis cinerea) infection of cherry tomato. Journal of Agricultural and Food Chemistry, 67(24), 6748–6756. https://doi.org/10.1021/acs.jafc.9b01144
- Wedad, H. A., El Tinay, A. H., Mustafa, A. I., & Babiker, E. E. (2008). Effect of fermentation, malt-pretreatment and cooking on antinutritional factors and protein digestibility of sorghum cultivars. Pakistan Journal of Nutrition, 7(2), 335–341. https://doi.org/10.3923/pjn.2008.335.341
- Woldemariam, F., Mohammed, A., Fikre Teferra, T., & Gebremedhin, H. (2019). Optimization of amaranths–teff–barley flour blending ratios for better nutritional and sensory acceptability of injera. Cogent Food & Agriculture, 5(1), 1–16. https://doi.org/10.1080/23311932.2019.1565079
- Woldemeskel, A. H., Retta, N., & Abuye, C. (2014). Sensory and nutrient composition evaluations of ethiopian staple meal (injera) prepared from quality protein maize, teff and cassava composite flours. Journal of Nutritional Ecology and Food Research, 2(4), 311–315. https://doi.org/10.1166/jnef.2014.1093
- Wronkowska, M., & Haros, M. (2014). Wet-milling of buckwheat with hull and dehulled - the properties of the obtained starch fraction. Journal of Cereal Science, 60(3), 477–483. https://doi.org/10.1016/j.jcs.2014.09.004
- Yasin, U. A. (2021). Textural and eye qualities of injera prepared from quality protein maize and teff blended flours. International Journal of Nutrition and Food Sciences, 10(4), 78. https://doi.org/10.11648/j.ijnfs.20211004.11
- Yegrem, L., Abera, S., & Temesgen, M. (2021). Nutritional composition and sensory quality of injera prepared from teff (Eragrostis teff (Zucc.) Trotter) complemented with lupine (Lupinus spp.). Cogent Food & Agriculture, 7(1), 1862469. https://doi.org/10.1080/23311932.2020.1862469
- Yigzaw, Y., Gorton, L., Solomon, T., & Akalu, G. (2004). Fermentation of seeds of teff (Eragrostis teff), grass-pea (Lathyrus sativus), and their mixtures: Aspects of nutrition and food safety. Journal of Agricultural and Food Chemistry, 52(5), 1163–1169. https://doi.org/10.1021/jf034742y
- Zaidel, D. N. A., Chin, N. L., Rahman, R. A., & Karim, R. (2008). Rheological characterisation of gluten from extensibility measurement. Journal of Food Engineering, 86(4), 549–556. https://doi.org/10.1016/j.jfoodeng.2007.11.005
- Zhou, X., Wen, L., Li, Z., Zhou, Y., Chen, Y., & Lu, Y. (2015). Advance on the benefits of bioactive peptides from buckwheat. Phytochemistry Reviews, 14(3), 381–388. https://doi.org/10.1007/s11101-014-9390-0
- Zieliński, H., & Kozłowska, H. (2000). Antioxidant activity and total phenolics in selected cereal grains and their different morphological fractions. Journal of Agricultural and Food Chemistry, 48(6), 2008–2016. https://doi.org/10.1021/jf990619o
Appendix
Figure A1. Injera samples prepared from the different Blending ratios and Fermented durations. Where, BR1 (Perl Millet Flour 40: Teff Flour 55: Buckwheat flour 5), BR2 (Perl Millet Flour 30: Teff Flour 60: Buckwheat flour 10), BR3 (Perl Millet Flour 20: Teff Flour 65: Buckwheat flour 15), BR4 (Perl Millet Flour 10: Teff Flour 70: Buckwheat flour 20) and Control (100% Teff Flour).
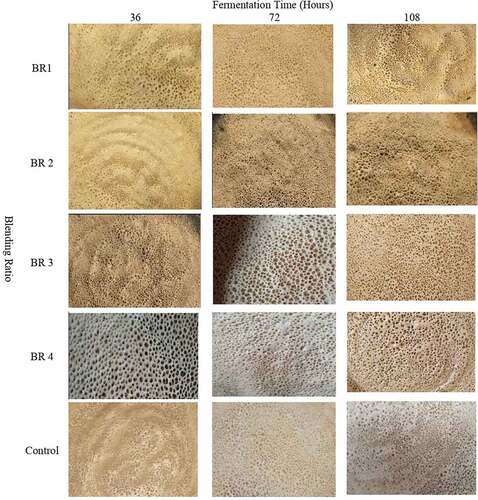
Table A1. Effect of blending ratio and fermentation time on sensory quality of injer on five-point hedonic scale.