
 ?Mathematical formulae have been encoded as MathML and are displayed in this HTML version using MathJax in order to improve their display. Uncheck the box to turn MathJax off. This feature requires Javascript. Click on a formula to zoom.
ABSTRACT
Cookies are bakery products with relatively long shelf life and high acceptability. The objectives of the study were to evaluate the physicochemical and functional properties of rice and Bambara groundnut composite flour, explore its use for making cookies, and evaluate its acceptability. Functional properties were influenced by the amount of Bambara groundnut in the composite flour. Moisture, ash, protein, fat, and carbohydrate content of the flours were significantly different (p > .05). Results of the sensory evaluation showed cookies from rice flour only (score of 7.23 ± 1.35) and composite (75% rice and 25% Bambara groundnut) with a score of 7.71 ± 1.44 were most liked by the panelists. Thus, the composite of Bambara groundnut and rice can be used for baked food products as well as an ingredient for other food formulations. Ultimately, this will expand the consumption of underutilized legumes such as Bambara groundnut and enhance food security.
1. Introduction
Most cookies are low in protein and are generally of poor nutritional quality. They are primarily made from plant-based foods, particularly grains (Akpapunam & Darbe, Citation1994). Abdel et al. (Citation2011) reported that global protein consumption was increasing, requiring the enhancement of cookies, which are widely consumed by children and adults. It may aid as a route to address protein deficiency, especially for low-income groups who cannot afford expensive protein foods but have locally accessible plant protein sources. Rice and Bambara groundnuts are staples in Ghana, providing a significant amount of protein and energy. Bambara groundnut is a secondary food crop grown mostly by Sub-Saharan African subsistence farmers. It is a drought-tolerant legume that is often grown as a stand-alone crop or as an intercrop with drought-tolerant crops like millet (Mishra et al., Citation2012). It can be boiled, roasted, or ground into flour, which makes it easier to digest (Mishra et al., Citation2012). Bambara groundnut is mostly composed of protein (19–28 g/100 g) and carbohydrate (57–68 g/100 g) (Oyeyinka et al., Citation2015). Bambara groundnut proteins could be used as a functional ingredient in the food industry because of their balanced amino acid composition (Bamshaiye et al., Citation2011).
Rice is an important grain crop that feeds nearly a third of the world’s population (Khush, Citation1997). Rice is Ghana’s second most important grain staple, ranking first among imported cereals accounting for 58% of the country’s cereal imports (Sampson, Citation2013). Rice consumption has increased per capita in recent years, exceeding the country’s supply (Sampson, Citation2013). Ghana’s low rice output has been blamed on a variety of factors including the total land area for rice cultivation, illiteracy rates, low yield, poor storage facilities, pest and disease issues, and poor market prices for farmers (Al-Hassan, Citation2008).
Composite flour is a blend of carbohydrate-rich flour and protein-rich flour from crops such as legumes, cereals, root tubers, and legumes with or without wheat flour (Noorfarahzilah et al., Citation2014). When cereals are combined with legumes as composite flour, they can be used as a means of increasing the nutritional value of baked goods such as cookies (Nwosu, Citation2013). The quality attributes of baked products created from composite flours must be comparable to those of products made from wheat flour (Noorfarahzilah, Citation2014). Cookies are baked products with long shelf life, and high acceptance, especially among children. These products are made are nutritionally formulated in terms of fiber and protein content (Manley, Citation1983). Most cookies found on the market are majorly composed of carbohydrates which notwithstanding, provide the body with some amount of nutrients. Protein balance and quality may be achieved by combining cereals and legumes.
Gluten-free (GF) goods are becoming popular due to their demand by certain consumers and this has resulted in a growing market for such products. These gluten-free products are meant for persons with a reported incidence of gluten intolerance from consuming products containing gluten (most especially wheat) (Pellegrini & Agostoni, Citation2015; Shahzad et al., Citation2020). However, it is important to consider the nutritional value of gluten-free products during product development Legumes have become one of the ingredients often incorporated into the development of gluten-free products. This is because it often complements the nutrient content especially the protein quality in addition to supplying minerals, vitamins, and fiber (Foschia et al., Citation2017; Sibian & Riar, Citation2020). Legumes such as cowpea, fava beans, kidney beans, and chickpeas have been composited with various kinds of non-gluten cereals to produce a variety of gluten-free products (Miñarro et al., Citation2012; Mohammadi et al., Citation2022; Shahzad et al., Citation2020; Sibian & Riar, Citation2020). The processing and availability of gluten-free products provide an option for persons with celiac disease. Hence, the development of gluten-free cookies will provide a suitable alternative for celiac patients or persons who show sensitivity to gluten (or are gluten-intolerant).
The objective of this study was to produce and assess the quality of gluten-free cookies made from Bambara groundnut and rice composite flour. This study seeks to improve upon the nutritional value of rice cookies by incorporating Bambara groundnut, a legume that contains protein of high nutritional quality. Additionally, the gluten-free nature of the cookies would help reach a wide consumer populace, especially regarding individuals who are gluten intolerant or have been diagnosed with celiac disease. Ultimately, this will result in the diversification and application of underutilized crops such as Bambara groundnut in food systems, to recover and improve their consumption.
2. Materials and methods
2.1. Raw materials
The materials which included Bambara groundnut, butter, icing sugar, eggs, vanilla essence, and skimmed milk were purchased from Madina market, Accra for the study. Local rice was purchased from the University of Ghana Shop, Legon, Accra.
2.1.1. Processing of Bambara groundnut and rice flour
The Bambara groundnut was sorted and soaked in deionized water for 18- 24 h at 25°C followed by dehulling and then drying in an oven for 48–72 hours at 50°C. The dried seeds were milled into flour using a rotor mill. The fine flour collected was stored in an airtight container until further analysis.
For the rice flour, the rice was rinsed and drained under cold running water. It was then steeped in cold water for 3 to 6 hours. At the end of the steeping, the steep water was drained for 10–15 minutes in a fine-mesh strainer and was spread out on a triple layer of paper towels to dry for a few minutes. Using a blender, the rice was milled (at high speed) into flour to obtain a fine powder. The slightly damp flour was dried for 48–72 hours in an air oven at 50°C. A pinch between the fingers was used to test for doneness (dryness). Dried flour did not clump together. The dried fine flour was collected and stored in an airtight container until further analysis.
2.1.2. Composite flour formulations
The rice and Bambara groundnut flour were mixed using a high-force blender for 3 minutes. At intervals of 1 minute, the blender was stopped to rest to prevent overheating. The composite flours formulated were as follows:
90% rice flour and 10% Bambara groundnut flour (RB90:10)
85% rice flour and 15% Bambara groundnut flour (RB85:15),
80% rice flour and 20% Bambara groundnut flour (RB80:20)
75% rice flour and 25% Bambara groundnut flour (RB75:25)
2.2. Evaluation of functional properties of flour
Functional properties are studied to predict how food materials (made up of proteins, lipids, fibers, and carbohydrates) will behave in specific systems (Mattil, Citation1971). Swelling capacity, water, and oil absorption capacity, emulsion activity and stability, and bulk density were the functional characteristics of the flours that were evaluated. The procedure for each functional property was repeated three times for each sample and the average was calculated for each sample.
2.2.1. Swelling capacity
The swelling capacity was calculated using Okaka and Potter’s (Citation1977) method. The sample was loaded to the 10 ml mark in a 100 ml graduated cylinder. Distilled water was added to make up a total of 50 ml. The mixture was blended for 2 minutes and left to stand for another 8 minutes. After the eighth minute, the sample volume was measured. This procedure was repeated three times for each sample and the average was calculated war each sample.
2.2.2. Water absorption capacity (WAC)
The Sosulski et al. (Citation1976) method was used to determine the water absorption capacity of the flours. One gram of flour sample was combined with ten milliliters of distilled water and left to settle for 30 minutes at room temperature (30 2°C) before centrifuging at 3,000 rpm or 2000 × g for 30 minutes. The fraction of water bound per gram of flour was used to determine water absorption. This procedure was repeated three times for each sample and the average was calculated for each sample.
2.2.3. Oil Absorption Capacity (OAC)
The method of Sosulski et al. (Citation1976) was used to determine the oil absorption capacity of the flour One gram of flour sample was mixed with ten milliliters of soybean oil and left to sit for 30 minutes at room temperature (25°C) before centrifuging at 300 rpm or 2000 g for 30 minutes. The percent water bound per gram of flour was used to calculate oil absorption. This procedure was repeated three times for each sample and the average was calculated for each sample.
2.2.4. Emulsion Activity (EA) and Stability (ES)
Emulsion activity and stability were determined using the method by Yasumatsu et al. (Citation1972). One (1) g of flour sample, 10 ml distilled water, and 10 ml soybean oil were mixed in a calibrated centrifuge tube. The emulsion was centrifuged at 2000 × g for 5 minutes. The ratio of the height of the emulsion layer to the total height of the mixture was used to calculate emulsion activity. The emulsion stability was tested by heating the emulsion in a calibrated centrifuged tube at 80°C for 30 minutes in a water bath, cooling fit for 15 minutes under running tap water, and then centrifuging at 2000 × g for 15 minutes. This procedure was repeated three times for each sample and the average was calculated for each sample.
2.2.5. Bulk density
The bulk density was determined using the method of Jones et al. (Citation2000). A 100 g of flour sample was measured into a measuring cylinder (250 ml) and continuously tapped on a wooden board until no observable drop in volume was detected, and the apparent (bulk) density was computed using the weight and volume. This procedure was repeated three times for each sample and the average was calculated for each sample.
2.2.6. Foaming capacity and stability
Two (2) grams of flour sample were mixed with 50 ml distilled water. The suspension was vigorously stirred and whipped to foam. After 30 seconds, the entire volume was measured. The percentage increase in volume after 30 seconds was used to calculate the foaming capacity. This procedure was repeated three times for each sample and the average was calculated for each sample.
2.2.7. Least gelation concentration
Two (2) to 14% (w/v) suspensions of flour were prepared and heated at 90°C for 1 hour in a water bath. The suspensions were cooled under running water and kept inverted at refrigerated temperature. The concentration with the least gelation was determined by noting those that did not show slipping in the inverted tubes.
2.2.8. pH
Ten (10) grams of flour were mixed with 10 mL of distilled water and thoroughly mixed. The pH of the solution was measured using a pH meter and values were recorded. This procedure was repeated three times for each sample and the average was calculated for each sample.
2.3. Proximate composition of flour
A proximate analysis of the flours was carried out. The protein, ash, moisture, and fat contents of the flour samples were analyzed. Carbohydrate was estimated by the difference method. Each analysis was repeated three times for each sample and the average was calculated for each sample.
2.3.1. Protein
The Kjedahl method was used to determine the protein content of the flour samples (AACC, Citation2000). The amount of protein in the sample was calculated using a conversion factor based on the food commodity’s nitrogen content (usually 6.25, which is equivalent to 0.16 g nitrogen per gram of protein). This procedure was repeated three times for each sample and the average was calculated for each sample.
2.3.2. Moisture
The American Association of Cereal Chemists (AACC, Citation2000) technique was used to determine the moisture of the samples. The flour samples (3 g) were placed in pans and dried for 24 hours in an air oven. The samples were dried to a consistent weight at 105°C and then weighed after cooling. The moisture contents were estimated using the loss in weight expressed as a percentage of the sample. This procedure was repeated three times for each sample and the average was calculated for each sample.
2.3.3. Ash
The American Association of Cereal Chemists (AACC, Citation2000) method was used to determine the ash content. Three to five grams (3–5 g) of flour samples were weighed into crucibles. The samples were then heated in a muffle furnace at 550°C. They were burnt until they produced light gray ash or a consistent weight. The samples were weighed after cooling, and the ash content was estimated as a percentage of the sample. This procedure was repeated three times for each sample and the average was calculated for each sample.
2.3.4. Fat
The Soxhlet method was used for extracting lipids from the samples. At the end of the extraction process, the solvent was evaporated and the mass of lipid that remained was measured. The fat content was estimated as a percentage of the sample. The method used was according to AACC (Citation2000). The percentage of fat was calculated as . This procedure was repeated three times for each sample and the average was calculated for each sample.
2.3.5. Carbohydrate
The carbohydrate percentage of the flour samples was calculated by subtracting all other components from 100%, including protein, fat, ash, and moisture. As a result, the percent carbohydrate was calculated as [100-(protein + fat + ash + moisture)]%
2.4. Preparation of cookies
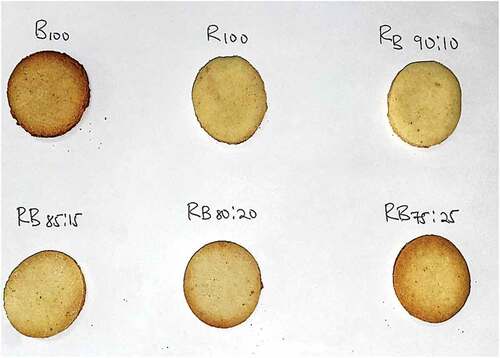
The cookies were made using the following ingredients with modification of the conventional method according to AACC (Citation2000): 400 g flour, 20 ml skimmed milk, 50 g shortening, 10 ml vanilla essence, 2 eggs, and icing sugar (100 g). Shortening and sugar were creamed together. Eggs, vanilla extract, skimmed milk, and flour were added and completely combined to make dough. The dough was kneaded, rolled out, and cut into circles. The baking time was 15 minutes at 170°C (). After cooling, the cookie samples were sealed in airtight zip-lock bags. The diameter, thickness, and weight of the cookies were measured for each cookie type. The procedure was repeated three times for each sample and the average was calculated for each sample.
Figure 1. Cookies produced from the composite flours.
2.4.1. Characteristics of the cookies
2.4.2. Weight
The weight of the cookies was determined according to the method of Ayo et al. (Citation2007). Immediately after cooling, the weight of the cookie sample was determined using a weighing balance. This procedure was repeated three times for each cookie type and the average weight was calculated for each cookie type.
2.4.3. Diameter
The diameter of the cookies was measured according to the method of AACC (Citation2000). A ruler was used to measure the diameter in millimeters of four cookies that were positioned edge to edge. For replicate reading, the cookies were turned at 90°C angles. This procedure was repeated three times for each cookie type and the average diameter was calculated for each cookie type.
2.4.4. Thickness
The thickness of the cookies was determined using the method of Ayo et al. (Citation2007). A Vernier caliper with 0.01 mm precision was used to measure the thickness of the cookies. This procedure was repeated three times for each cookie type and the average thickness was calculated for each cookie type.
2.4.5. Colour measurement
The Colour was measured using a Colorimeter (Konica Minolta Chroma meter CR-410). The Colorimeter was first calibrated according to the manufacturer’s instructions. The Colorimeter was used to measure the Colour of samples and the values for L* (lightness), a* (redness), and b* (yellowness) were recorded. Colour values (L, a*, and b*) were measured three times for each sample and the average was calculated for each sample.
2.5. Sensory evaluation of cookies
A consumer sensory test was carried out to assess the acceptability of cookies made from the flour blends. Seventy-six (76) panelists were recruited from various departments at the University of Ghana. Most of the participants were students and others were university staff. A nine-point hedonic scale was used where 9 = like extremely, 8 = like very much, 7 = like moderately, 6 = like slightly, 5 = neither like nor dislike, 4 = dislike slightly, 3 = dislike moderately, 2 = dislike very much and 1 = dislike extremely. The sensory characteristics that were evaluated included appearance, Colour, aroma, texture, taste, mouthfeel, and overall liking. The cookie samples were presented to the panelists one after the other. Each panelist tasted 6 different cookie samples. Scores for the various attributes evaluated by the panelists were compiled and tabulated. ANOVA was conducted to determine the differences in the mean score using Tukey’s test at a significance level of α = 0.05 for the characteristics of the cookies as evaluated by the panelists. The sensory test was conducted at the Sensory Laboratory of the Department of Nutrition and Food Science, University of Ghana. Approval for the sensory study (ECBAS 048/15–16) was obtained from the Ethics committee of the College of Basic and Applied Sciences, University of Ghana.
2.6. Data analysis
Values were reported as means and standard deviations. Data were presented as tables and graphs. Using Minitab 2019, ANOVA test to compare the means whether or not they differ significantly using Tukey’s HSD test at a significance level of α = 0.05 and confidence interval of 95%.
3. Results and discussion
3.1. Proximate composition of flours
3.1.1. Moisture
Composite flour sample R80:20 had a moisture content of 5.49 ± 0.08%, which was different from RB75:25 (5.69 ± 0.02%) () but similar to the other composite flours and R100% (). Bambara groundnut flour (B100%) had the highest moisture content of 6.63 ± 0.06%. The moisture level of flour is essential for a variety of reasons. A moisture content of 14% or less is the standard for flour. As a result, keeping the moisture content of milled flours as near to 14% as possible is critical. The moisture content recorded for all the flour samples was below 14% () which is the acceptable limit for the moisture content of flour. From the results of this study, it is expected that the flour samples will remain stable because of their low moisture content. Naturally occurring microorganisms present in flour start to grow at high moisture levels which leads to the production of off-Flavours and odors and compromises the safety and shelf stability of the flour.
Table 1. Proximate Composition of Flours.
3.1.2. Protein
The flours had protein content ranging from 8.29 ± 0.07% to 21.89 ± 0.01 (). The highest protein content value of 21.89 ± 0.01% was recorded for Bambara groundnut flour (B100%), whereas the lowest protein content value of 8.29 ± 0.07% was found in rice flour (R100%). The protein content of the composites RB90:10, RB85:15, RB80:20, and RB75:25 was observed to have increased as the Bambara groundnut proportion increased. Adequate dietary protein is required during growth. Because of Bambara groundnut’s high protein content, it could be used to make protein-rich meals or supplement diets with low protein content.
3.1.3. Ash
Ash provides an approximation of a sample’s mineral content. The ash value for B100% was 3.725 ± 0.61% (), which agrees with a study by Alhassan et al. (Citation2015). Puri et al. (Citation2014) and Heinemann et al. (Citation2005) reported that rice flour had an ash level of 0.47%. Rice flour (R100%) had an ash value of 0.03 ± 0.04%, which is much lower than the results reported by Puri et al. (Citation2014) and Heinemann et al. (Citation2005). The low ash value may be a result of prolonged soaking in water. Prolong soaking can cause rice components to leak into the water (Liang et al., Citation2008). Thus, it can be that the soaking of the rice influenced the mineral content, which in turn reflected in the low ash concentration reported. However, other factors such as rice variety, cultivation conditions, and, farming practices can also influence the mineral content. The composite flours had ash content that was lower than that of B100% (). However, the ash content of the rice flour (R100%) was similar to that of the composite flours ().
3.1.4. Fat
The fat content of the flours ranged from 2.52 ± 0.27% to 9.78 ± 0.33% (). Sample B100% obtained the highest crude fat content of 9.78 ± 0.33% whilst RB85:15 contained the least crude fat content of 2.52 ± 0.27% (). The crude fat content of 7.64 ± 0.3% for RB75:25 was the highest among the composite flours which could be related to the increased proportion of Bambara groundnut.
3.1.5. Carbohydrate
Carbohydrate rate content of B100% was 58.59 ± 0.00% () and it was lower than the carbohydrate content of 63.37 ± 2.57% as reported by Alhassan et al. (Citation2015). Tchiotsa et al. (Citation2004) also reported similar carbohydrate content as Alhassan et al. (Citation2015). The result obtained from the study indicated that Bambara groundnut is an excellent source of carbohydrates as it makes up more than half (50%) of its macronutrient composition. Rice flour (R100%) had a carbohydrate content of 82.13 ± 0.22% () which is relatively higher compared to Bambara groundnut flour (B100%). Rice has inferior nutritional value compared to other popular cereals like maize (Blasé, Citation2020) and this inferiority is partly because it is majorly composed of starch (Balindong et al., Citation2018). The findings by Balindong et al. (Citation2018) who reported values ranging from 82% to 13% agree with the results from this study. The low carbohydrate content of Bambara groundnut flour (B100%) could have been due to reasons that the flour was high in other nutrients like protein (21.89%) and this may have influenced its carbohydrate content. The composites flours RB90:10, RB85:15, RB80:20 and RB75:25 had carbohydrate values of 81.36 ± 0.00%, 81.18 ± 0.20%, 76.36 ± 0.94% and 73.54 ± 0.46%, respectively (). The composite flours were high in carbohydrate content because the proportion of rice was higher compared to the Bambara groundnut flour (B100%).
3.2. Functional properties of flours
The functional properties of food materials govern how suitable they are for a particular food product. shows the results of the functional characteristics of rice and Bambara groundnut composite flour.
Table 2. Functional Properties of Flours.
3.2.1. Bulk Density (BD)
The bulk density (g/ml) of flour is the density measured without the influence of any compression. From , the bulk densities of the flours ranged from 2.05 ± 0.39 to 2.58 ± 0.49. However, the bulk densities of R100, B100, and the composite flours were similar (). According to Karuna et al. (Citation1996), bulk density is critical in determining material handling, packing requirements, and transportation.
3.2.2. Water Absorption Capacity (WAC)
Water absorption capacity (WAC), as a functional property of flour, refers to a product’s interaction with water (Singh, Citation2001). The water absorption capacity was observed highest in RB85:15 (2.51 ± 0.09) followed by RB75:25 (2.43 ± 0.13) (). RB90:10 recorded the least water absorption capacity of 2.32 ± 0.2. Over-absorption can affect the finished product in terms of poor symmetry, large volume, and susceptibility to mold growth (Serna-Saldivar, Citation2010). On the other hand, under-absorption could also affect the flour in terms of stiffness, dryness, and inadequacy of water to hydrate and disperse dry ingredients resulting in a finished product with low volume, the dense and firm internal structure (crumb) (Serna-Saldivar, Citation2010). Therefore, both under and over-absorption lead to quality issues in the dough and finished product. According to research conducted by Tan et al. (Citation2020), the most abundant macronutrient in Bambara groundnut is carbohydrates, which account for up to 65% of the total dry weight of the seed, compared to 53% in rice. The high amount of carbohydrates and protein in Bambara groundnut flour (B100%) may explain its high-water absorption capacity. Protein’s ability to absorb water is also important in a variety of food products such as soups, dough, and baked goods (Adeyeye & Aye, Citation1998).
3.2.3. Oil Absorption Capacity (OAC)
Any food’s ability to absorb oil is critical since it relies mostly on its ability to entrap oil through a sophisticated capillary attraction process. Oil acts as a Flavour enhancer, a consistency attribute, and an important enhancer of mouthfeel, hence the capacity of a food component to entrap oil is a favorable characteristic (Khattab & Arntfield, Citation2009). The oil absorption capacity of RB85:15 was the highest (2.83 ± 0.05) and the least was RB90:10 (2.07 ± 0.25) (). Bambara groundnut showed less oil absorption. The oil absorption capacity of the flour blends significantly increased when Bambara groundnut flour was added (from RB90:10 to RB75:25). According to Chowdhury et al. (Citation2006), the high oil absorption of flour and its blends suggest that it could find use in bakery products such as cake and cookies.
3.2.4. Foaming Capacity (FC) and Stability (FS)
The amount of interfacial area that can be created by protein is referred to as the foam capacity of proteins (Fennama, Citation1996). Foam is a colloidal system of many gas bubbles trapped in a liquid or solid. The foam capacity of the flours ranged from 3% to 16%. The highest foam capacity was observed for 100% Bambara groundnut flour (16 ± 2.83) % and rice flour obtained the least value of 3 ± 1.41% (). Foam stability, according to Fennama (Citation1996), is a protein’s capacity to withstand gravitational and mechanical forces. The blending ratio of different flours has been found to boost the foaming capacity and stability of composite flours. Large air bubbles created by high foaming capacity flours may be surrounded by a thinner, less flexible protein layer, making the bubbles easier to collapse and lowering foam stability (Jitngarmkusol et al., Citation2008). The values for foaming stability ranged from 92.41 ± 3.42 to 96.49 ± 2.35 (). The highest value of 96.49 ± 2.35 was observed for RB85:15, whiles the lowest was observed for RB75:25 with a value of 92:41 ± 3.42 (). Nonetheless, the foam stability of the composite flours was similar ().
3.2.5. Emulsion Activity (EA) and Stability (ES)
Emulsion quality is important in many food systems where the protein binds to fat, such as meat products, batters, doughs, and salad dressings (Adeleke & Odedeji, Citation2010; Sathe & Salunkhe, Citation1981). Rice and Bambara groundnut flour showed similar emulsion activity (). Among the composite flours, sample RB85:15 had the highest emulsion activity of 50 ± 0.00% (). The ability of proteins to contribute strength to an emulsion for resistance to stress and change is usually reflected in its emulsion stability (Sreerama et al., Citation2012). Rice flour (R100%) had a pr emulsion stability compared to the other flour samples. Rice and Bambara groundnut composite emulsions were stable. However, among the composite samples, RB85:15 and RB80:20 had better emulsion stability than RB75:25 ().
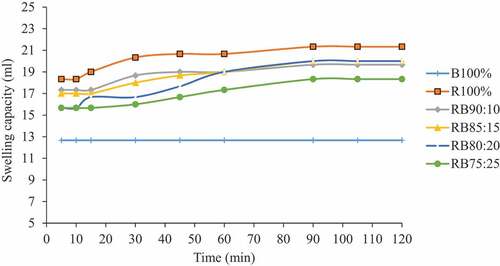
3.2.6. Swelling capacity at 27°C and 70°C
The flour blends’ swelling capacity at 70°C ranged from 12.67 ± 0.58 ml to 21.33 ± 0.58 ml (). Flour sample B100% showed a low swelling capacity () at 27°C and 70°C while R100% showed a higher swelling capacity at both temperatures (27°C and 70°C). . At various time intervals, rice flour influenced the increase in the swelling capacity of flour flours. The swelling capacity of flour granules, according to Moorthy and Ramanujam (Citation1986), is a measure of the number of associative forces within the granule. The degree of exposure of the internal structure of the starch present in the flour to the action of water is indicated by the variation in swelling capacity (Ruales et al., Citation1993).
Figure 2. Swelling Capacity (ml) of flour at 27°C.
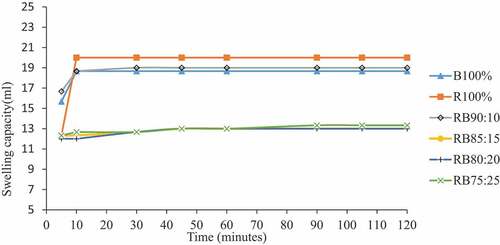
Figure 3. Swelling Capacity (ml) of flour at 70°C.
3.2.7. Least gelation concentration
The least gelation concentration was defined as the lowest protein concentration at which the gel persisted in the inverted tube as an indication of gelation capacity. The sample B100% gelled completely at all concentrations, ranging from 2% to 14% (). Sample R100% showed partial gelation at 2% and full gelation at the remaining concentrations. Therefore, it can be seen that the least concentration at which Bambara groundnut flour can form gel is 2% whilst that of rice flour R100%, is at 4% (). The composite flours of rice and Bambara groundnut exhibited partial gelation at 2% and full gelation at the remaining concentrations. The partial gelation of the composite flours (RB90:10, RB85:15, RB80:20, and RB75:25) was consistent with the findings of Kaushal et al. (Citation2012) who reported that pulse/legume contain a high amount of starch and protein, and that flour gelation capacity is influenced by physical competition for water between protein and starch during gelatinization.
Table 3. Least Gelation Concentration of flours.
3.2.8. pH of flour
The pH of the flours ranged between 5.73 ± 0.01 to 6.94 ± 0.00 (). The lowest pH of 5.73 ± 0.01 was recorded for R100%, whereas the highest of 6.94 ± 0.00 was for B100% (). It can be seen that the pH of the composite flours increased with increasing concentration of Bambara groundnut flour since it is less acidic than rice flour. pH is an important parameter in determining the quality of flour and a low pH value imparts a sour taste to the flour which makes it less preferred for consumption (Apea-Bah et al., Citation2011).
Table 4. pH of flours.
3.2.9. Colour of flour
In general, bright white flour is preferable and acceptable for a wide range of products. The highest L* value of 94.07 ± 0.23 was for R100% whilst the lowest value of 90.92 ± 0.05 was recorded for B100% (). This implies that R100% was whiter than the other flours. The remaining composite flours (RB 85:15, RB 80:20, and RB 75:25) were seen to be slightly less white due to the increasing proportion of Bambara groundnut flour. All the flour samples had extremely low a* values which imply the absence of chlorophyll (green pigment). The b* value for B100% was the highest with a value of 12.27 ± 0.19. This implies that B100% contained some quantity of carotenoids (yellowness). R100% had the lowest value of 6.91 for b* due to its low content of carotenoids (yellowness). The Colour of flour became a prime commercial factor after the introduction of roller milling. Gradual milling with metal rolls enabled the production of flour that was whiter and baked better than its predecessors. To consumer demand, Colour became associated with flour quality (Ferrari & Bailey, Citation1929).
Table 5. Colour of flours.
As stated by Jago (Citation1895), “Colour is probably the most difficult and the most important test to be carried out on flour”. Colour test on flour may not be the important test to be done on flour currently but it remains one of the most difficult things to do. Some studies (Ferrari & Bailey, Citation1929; Kent-Jones & Herd, Citation1927; Yasunaga & Uemura, Citation1962) have recognized that flour Colour needs to be evaluated by measuring both brightness and yellowness. Brightness, or grade, is affected by bran content and/or extraneous material whereas yellowness is related to the number of natural pigments present. Because the Colour of flour has a significant impact on the finished product, it is one of the numerous flour criteria demanded by end-users.
3.3. Physical characteristics of the cookies
3.3.1. Weight of cookies
As the concentration of Bambara groundnut increased, the weight of the cookies decreased. The cookie weights ranged from 4.50 ± 0.32 g to 6.40 ± 0.08 g (). The highest weight, 6.400 ± 0.08 g was recorded for B100%, whilst the least value of 4.50 ± 0.32 g was recorded for composite flour sample RB75:25. The cookies made from the composite flours had more weight than B100% cookies.
Table 6. Physical characteristics of cookies.
3.3.2. Diameter of cookies
The cookie diameter ranged from 3.55 ± 0.06 cm to 3.68 ± 0.08 cm (). According to Leon et al. (Citation1996), the diameter value has an inverse relationship with the protein level, which determines the viscosity of cookie dough. The creation of a continuous gluten web increases the viscosity of the dough and prevents it from flowing (Miller et al., Citation1997). As a result of the low viscosity of the dough, it has a rapid flow rate (spread rate) and contributes to the wide diameter of the cookies. Rice and Bambara groundnut do not contain gluten protein (Doudu & Apea-Bah, Citation2017) which implies a high dough viscosity that resulted in a low flow rate (spread rate) of the dough and that contributed to the low diameter of cookies.
3.3.3. Thickness of cookies
As the amount of Bambara groundnut flour in the cookie formulation reduce, the thickness of the cookies increased. This was especially noticeable in the cookies made entirely from Bambara groundnut flour which were observed to be thicker (). Comparing cookies made with rice flour only to the composite (rice and Bambara groundnut), the thickness of the cookies from the composite was slightly lower (). Atuonwu and Akobundu (Citation2010), observed similar results for cookies with added defatted pumpkin (Cucurbita pepo) seed flour. The increasing number of hydrophilic sites available in composite flours due to higher protein content compete for the limited free water in dough (Zucco et al., Citation2011).
3.4. Sensory evaluation of cookies
Sensory evaluation of the cookies was conducted by a total of 76 panelists. shows the mean scores for quality characteristics such as appearance, Colour, aroma, texture, mouthfeel, and overall likeness. The physical characteristics of composite baked goods influence the sensory quality and acceptability of consumers (Duodu & Minnaar, Citation2011). The analysis of the results revealed that the mean sensory score for the appearance of cookies containing only 100% Bambara groundnut flour (B100%) was the same or similar (p > .05) to the mean score of cookies made from 100% rice flour (R100%), RB90:10 and RB85:15 (). Also, the cookie made from composite flour sample RB80:20 was the same (p > .05) as cookies made from B100% (). Cookies made from composite RB75:25 was the same (p > .05) as R100%, RB90:10, and RB85:15 (). The highest mean value of 7.32 ± 1.34 for appearance was obtained for cookies made from composite flour RB75:25.
Table 7. Sensory characteristics of cookies.
The highest score for Colour was 7.29 ± 1.18 which was for cookies made from RB75:25. The least score for Colour was recorded for cookies containing composite flour RB80:20 (). Generally, it was realized that the increase in Bambara groundnut content of flour contributed to an increase in ratings for the desired surface Colour of the cookies. However, because of the increased quantities of lysine in legumes, the composite baked product tends to turn dark as a result of the Maillard reaction (Duodu & Minnaar, Citation2011). The Maillard reaction tends to affect the Colour and the rating of cookie Colour. The cookies did not show differences in their Colour and were similarly liked by the panelists. Colour is a very vital sensory attribute and affects the acceptability of the food product (Ubbor & Akobundu, Citation2009).
The fragrance composition of foods has also been the focus of recent research, as it is well known that the presence of volatile chemicals and their composition defines the distinctive aroma of foods and the Flavour of the resulting products (Calín-Sánchez & Carbonell-Barrachina, Citation2021). Cookie made from composite flours RB90:10, RB85:15, RB80:20, and RB75:25, as well as R100%, were not statistically different (p > .05) (). This means that the aroma for R100% and the composite flours were liked the most by the panelists since they scored higher for aroma () whilst that of Bambara groundnut, B100% received a lower score because its aroma was not appreciated by the panelists.
The cookie that was scored low for texture contained B100% (). R100% on the other hand scored highest for texture (). Statistically, cookies made from composite flour RB90:10 and RB80:20 were similar (p > .05) to those made from composite flours RB85:15, RB75:2,5, R100,% and B100% (). The analysis showed that panelists liked the texture of cookies made from only rice flour (). Textural attributes and crispiness are desirable in cookies (Ubbor & Akobundu, Citation2009). Concerning respect to taste, % was scored highest (7.33 ± 1.66), whilst B100 scored the lowest (4.69 ± 2.45) (). The taste score for cookies made from R100% and the composite flours (RB90:10, RB85:15, RB80:20, and RB75:25) were not statistically different (p > .05) (). This means the panelists liked the taste of the cookies made except for B100%. In terms of mouthfeel, cookies made from rice flour (R100%) only were more acceptable to the panelists than those made from B100% (). Statistically, the mean score for the mouthfeel of cookies made from R100% was not different (p > .05) from the other cookie samples except for RB80:20. Finally, for the overall likeness of the cookies, R100% was ranked highest at 7.23 ± 1.35 whilst B100% was ranked the lowest 5.24 ± 2.31 (). A comparison of cookies produced from the composite flours showed it was comparable to that of R100% (Sudha et al., Citation2007). There was no flour substitution or fortification for sample R100% and the panelists liked (7.23 ± 1.35) it better than the remaining samples (). However, among the cookies made from the composite flours, the overall likeness for R75:25 (7.17 ± 1.44) was similar to R100% (7.23 ± 1.35).
4. Conclusion
The substitution or fortification influenced the water absorption capacity of the flour. With an increasing proportion of Bambara groundnut flour in the composite, and decreasing rice flour proportions, water absorption capacity was affected. Bulk density increased with an increasing proportion of Bambara groundnut flour with regards to the composite except for the composite containing 75% rice flour and 25% Bambara flour. Sensory evaluation results showed cookies made from rice flour only (R100%) and 75% rice flour and 25% Bambara groundnut flour (RB75:25) were most preferred by the panelists as compared to the cookies made from the other flours. Baking enterprises can add gluten-free flour, such as Bambara groundnut flour, into their baked goods. This will not only increase the protein content of the product but will also benefit people with celiac disease and encourage them to acquire an interest in eating baked goods. Also, the composite flour exhibited great potential as an ingredient for other food product formulations based on the results of the study of their composition and functional properties.
Disclosure statement
No potential conflict of interest was reported by the author(s).
Data availability statement
The authors declare that the data supporting the findings of the study entitled “Quality Assessment of Gluten-Free Cookies from Rice and Bambara Groundnut flour” are available within this article.
References
- Abdel, R. S. E., Ali, O. A., Azza, A. A. A., & Ferial, M. A. S. (2011). Chemical composition and functional properties of flour and protein isolate extracted from Bambara groundnut (Vigna subterranean). African Journal of Food Science, 5(2), 82–90.
- Adeleke, R. O., & Odedeji, J. O. (2010). Functional properties of wheat and sweet potato flour blends. Pakistan Journal of Nutrition, 9(6), 535–538. https://doi.org/10.3923/pjn.2010.535.538
- Adeyeye, E. I., & Aye, P. A. (1998). The effects of sample preparation on the proximate composition and the functional properties of the African yam bean (Sphenostylis stenocarpa Hochst ex A. Rich) flours. Note 1. Rivista Italiana delle Sostanze Grasse, 75(5), 253–261.
- Akpapunam, M. A., & Darbe, J. W. (1994). Chemical composition and functional properties of blends of maize and Bambara groundnut flour for cookie production. Plant Foods for Human Nutrition, 46(2), 147–155. https://doi.org/10.1007/BF01088767
- Al-Hassan, S. (2008). Technical efficiency of rice farmers in northern Ghana. AERC Research Paper 178. African Economic Research Consortium.
- Alhassan, A. J., Dangambo, M. A., & Abdulmumin, T. M. (2015). Evaluation of the proximate contents of Bambara Groundnut Vigna subterranean (L.) Verdc grown in MadobiLGA, Kano State, Nigeria. British Journal of Applied Science & Technology, 8(4), 361–365. https://doi.org/10.9734/BJAST/2015/16577
- American Association of Cereal Chemists. Approved Methods Committee. (2000). Approved methods of the American association of cereal chemists (Vol. 1). Amer Assn of Cereal Chemists.
- Apea-Bah, F. B., Oduro, I., Ellis, W. O., & Safo-Kantanka, O. (2011). Factor analysis and age harvest effect on the quality of the flour from four cassava varieties. World Journal of Dairy and Food Sciences, 6(1), 43–54.
- Atuonwu, A. C., & Akobundu, E. N. T. (2010). Nutritional and sensory quality of cookies supplemented with defatted pumpkin (Cucurbita pepo) seed flour. Pakistan Journal of Nutrition, 9(7), 672–677. https://doi.org/10.3923/pjn.2010.672.677
- Ayo, J. A., Ayo, V. A., Nkama, I., & Adeworie, R. (2007). Physiochemical, in-Vitro digestibility and organoleptic evaluation of “Acha” Wheat biscuit supplemented with. Nigerian Food Journal, 25(1), 15–17. https://doi.org/10.4314/nifoj.v25i1.33656
- Balindong, J. L., Ward, R. M., Liu, L., Rose, T. J., Pallas, L. A., Ovenden, B. W., Snell, P. J., & Waters, D. L. (2018). Rice grain protein composition influences instrumental measures of rice cooking and the eating quality. Journal of Cereal Science, 79, 35–42. https://doi.org/10.1016/j.jcs.2017.09.008
- Bamshaiye, O. M., Adegbola, J. A., & Bamishaiye, E. I. (2011). Bambara groundnut: An under-utilized nut in Africa. Advances in agricultural biotechnology, 1(1), 60–72.
- Blasé, M. E. M. (2020). Optimisation of rice flour traits for the production of indigenous rice recipes. Current Research in Nutrition and Food Science Journal, 8(1), 349–359.
- Calín-Sánchez, Á., & Carbonell-Barrachina, Á. A. (2021). Flavour and aroma analysis as a tool for quality control of foods. Foods, 10(2), 224. https://doi.org/10.3390/foods10020224
- Chowdhury, M. M. I., Huda, M. D., Hossain, M. A., & Hassan, M. S. (2006). Moisture sorption isotherms for mungbean (Vigna radiata L). Journal of Food Engineering, 74(4), 462–467. https://doi.org/10.1016/j.jfoodeng.2005.03.036
- Doudu, K. G., & Apea-Bah, F. B. (2017). African legumes. Nutritional and health-promoting attributes (J. Taylor and J. Awika, Eds.). Woodhead Publishing.
- Duodu, K. G., & Minnaar, A., (2011). Legume composite flours and baked goods: nutritional, functional, sensory, and phytochemical qualities. In V. R. Preedy, R. R. Watson, & V. B. Patel (Eds.), Flour and breads and their fortification in health and disease prevention (pp. 93–203). Academic Press.
- Fennama, R. O. (1996). Food Chemistry (3rd ed.). Marcel Dekker Inc. New York.
- Ferrari, C. G., & Bailey, C. H. (1929). The determination of carotin in flour. Cereal Chemistry, 6(1), 347–371.
- Foschia, M., Horstmann, S. W., Arendt, E. K., & Zannini, E. (2017). Legumes as functional ingredients in gluten-free bakery and pasta products. Annual Review of Food Science and Technology, 8(1), 75–96. https://doi.org/10.1146/annurev-food-030216-030045
- Heinemann, R. J. B., Fagundes, P. D. L., Pinto, E. A., Penteado, M. D. V. C., & Lanfer-Marquez, U. M. (2005). Comparative study of the nutrient composition of commercial brown, parboiled and milled rice from Brazil. Journal of Food Composition and Analysis, 18(4), 287–296. https://doi.org/10.1016/j.jfca.2004.07.005
- Jago, W. (1895). A text-book of the science and art of bread-making: Including the chemistry and analytic and practical testing of wheat, flour, and other materials emloyed in baking. Simpkin, Marshall, Hamilton, Kent & Company Limited.
- Jitngarmkusol, S., Hongsuwankul, J., & Tananuwong, K. (2008). Chemical compositions, functional properties, and microstructure of defatted macadamia flours. Food Chemistry, 110(1), 23–30. https://doi.org/10.1016/j.foodchem.2008.01.050
- Jones, D., Chinnaswamy, R., Tan, Y., & Hanna, M. (2000). Physiochemical properties of ready-to-eat breakfast cereals. Cereal Foods World, 45(4), 164–168.
- Karuna, D., Noel, G., & Dilip, K. (1996). Food and nutrition bulletin, 17: 2. United Nation University.
- Kaushal, P., Kumar, V., & Sharma, H. K. (2012). Comparative study of physicochemical, functional, antinutritional, and pasting properties of taro (Colocasia esculenta), rice (Oryza sativa) flour, pigeon pea (Cajanus cajan) flour, and their blends. LWT-Food Science and Technology, 48(1), 59–68. https://doi.org/10.1016/j.lwt.2012.02.028
- Kent-Jones, D. W., & Herd, C. W. (1927). A numerical expression for the colour of flour. The Analyst, 52(617), 443–452. https://doi.org/10.1039/an9275200443
- Khattab, R. Y., & Arntfield, S. D. (2009). Nutritional quality of legume seeds as affected by some physical treatments 2. Antinutritional factors. LWT-Food Science and Technology, 42(6), 1113–1118. https://doi.org/10.1016/j.lwt.2009.02.004
- Khush, G. S. (1997). Origin, dispersal, cultivation and variation of rice. Journal of Plant Molecular Biology, 35(1–2), 25–34. https://doi.org/10.1023/A:1005810616885
- Leon, A. E., Rubiolo, A., & Anon, M. C. (1996). Use of triticale flours in cookies: Quality factors. Cereal Chemistry, 73(6), 779–784.
- Liang, J., Han, B. Z., Nout, M. R., & Hamer, R. J. (2008). Effects of soaking, germination, and fermentation on phytic acid, total and in vitro soluble zinc in brown rice. Food Chemistry, 110(4), 821–828. https://doi.org/10.1016/j.foodchem.2008.02.064
- Manley, D. J. (1983). The technology of biscuits, crackers, and cookies. Woodhead Publishing Ltd.
- Mattil, K. F. (1971). The functional requirements of proteins for foods. Journal of the American Oil Chemists’ Society, 48(9), 477–480. https://doi.org/10.1007/BF02544664
- Miller, R. A., Hoseney, R. C., & Morris, C. F. (1997). Effect of formula water content on the spread of sugar‐snap cookies. Cereal Chemistry, 74(5), 669–671. https://doi.org/10.1094/CCHEM.1997.74.5.669
- Miñarro, B., Albanell, E., Aguilar, N., Guamis, B., & Capellas, M. (2012). Effect of legume flours on baking characteristics of gluten-free bread. Journal of Cereal Science, 56(2), 476–481. https://doi.org/10.1016/j.jcs.2012.04.012
- Mishra, V., Puranik, V., Akhtar, N., & Rai, G. K. (2012). Development and compositional analysis of protein-rich soybean-maize flour blended cookies. Journal of Food Process and Technology, 3(9), 182. https://doi.org/10.4172/2157-7110.1000182
- Mohammadi, M., Khorshidian, N., Yousefi, M., Khaneghah, A. M., & He, S. (2022). Physicochemical, rheological, and sensory properties of gluten-free cookies produced by flour of chestnut, date seed, and modified starch. Journal of Food Quality, 2022, 1–10. https://doi.org/10.1155/2022/5159084
- Moorthy, S. N., & Ramanujam, T. (1986). Variation in properties of starch in cassava varieties in relation to the age of the crop. Starch‐Stärke, 38(2), 58–61. https://doi.org/10.1002/star.19860380206
- Noorfarahzilah, M., Lee, J. S., Sharifudin, M. S., Mohd Fadzelly, A. B., & Hasmadi, M. (2014). Applications of composite flour in the development of food products. International Food Research Journal, 21(6), 2061–2074.
- Nwosu, J. N. (2013). Evaluation of proximate composition and nutritional properties of African yam bean (Sphenostylis stenocarpa) using malting treatment. International Journal of Basic & Applied Sciences, 2(4), 157–169.
- Okaka, J. C., & Potter, N. N. (1977). Functional and storage properties of cowpea powder‐wheat flour blends in breadmaking. Journal of Food Science, 42(3), 828–833. https://doi.org/10.1111/J.1365-2621.1977.Tb12614.X
- Oyeyinka, S. A., Singh, S., Adebola, P. O., Gerrano, A. S., & Amonsou, E. O. (2015). Physicochemical properties of starches with variable amylose contents extracted from bambara groundnut genotypes. Carbohydrate Polymers, 133, 171–178. https://doi.org/10.1016/j.carbpol.2015.06.100
- Pellegrini, N., & Agostoni, C. (2015). Nutritional aspects of gluten-free products. Journal of the Science of Food and Agriculture, 95(12), 2380–2385. https://doi.org/10.1002/jsfa.7101
- Puri, S., Dhillon, B., & Sodhi, N. S. (2014). Effect of degree of milling (Dom) on the overall quality of rice—a review. International Journal of Advanced Biotechnology and Research, 5(3), 474–489.
- Ruales, J., Valencia, S., & Nair, B. (1993). Effect of processing on the physicochemical characteristics of quinoa flour (Chenopodium quinoa, willd). Starch‐Stärke, 45(1), 13–19. https://doi.org/10.1002/star.19930450105
- Sampson, K. (2013). Consumer preferences and willingness to pay for locally produced rice in Kumasi metropolis of Ghana. Kwame Nkrumah University of Science and Technology.
- Sathe, S. K., & Salunkhe, D. K. (1981). Functional properties of the great northern bean (Phaseolus vulgaris L.) proteins: Emulsion, foaming, viscosity, and gelation properties. Journal of Food Science, 46(1), 71–81. https://doi.org/10.1111/j.1365-2621.1981.tb14533.x
- Serna-Saldivar, S. O. (2010). Quality control of cereal grains and their products. In Barbosa-Cánovas, G. V. (Ed.), Cereal grains: Properties, processing, and nutritional attributes (pp. 491–493). CRC Press, Taylor & Francis Group.
- Shahzad, S. A., Hussain, S., Mohamed, A. A., Alamri, M. S., Qasem, A. A. A., Ibraheem, M. A., & El Din, M. F. S. (2020). Gluten-free cookies from sorghum and Turkish beans; effect of some non-conventional and commercial hydrocolloids on their technological and sensory attributes. Food Science and Technology, 41(1), 15–24. https://doi.org/10.1590/fst.25419
- Sibian, M. S., & Riar, C. S. (2020). Formulation and characterization of cookies prepared from the composite flour of germinated kidney bean, chickpea, and wheat. Legume Science, 2(3), e42. https://doi.org/10.1002/leg3.42
- Singh, U. (2001). Functional properties of grain legume flours. Journal of Food Science and Technology (Mysore), 38(3), 191–199.
- Sosulski, F. W., Garatt, M. O., & Slinkard, A. E. (1976). Functional properties of ten legume flours. Canadian Institute of Food Science and Technology Journal, 9(2), 66–69. https://doi.org/10.1016/S0315-5463(76)73614-9
- Sreerama, Y. N., Sashikala, V. B., Pratape, V. M., & Singh, V. (2012). Nutrients and antinutrients in cowpea and horse gram flour in comparison to chickpea flour: Evaluation of their flour functionality. Food Chemistry, 131(2), 462–468. https://doi.org/10.1016/j.foodchem.2011.09.008
- Sudha, M. L., Vetrimani, R., & Leelavathi, K. (2007). Influence of fiber from different cereals on the rheological characteristics of wheat flour dough and on biscuit quality. Food Chemistry, 100(4), 1365–1370. https://doi.org/10.1016/j.foodchem.2005.12.013
- Tan, X. L., Azam-Ali, S., Goh, E. V., Mustafa, M., Chai, H. H., Ho, W. K., Mayes, S., Mabhaudhi, T., Azam-Ali, S., & Massawe, F. (2020). Bambara groundnut: An underutilized leguminous crop for global food security and nutrition. Frontiers in Nutrition, 7, 601496. https://doi.org/10.3389/fnut.2020.601496
- Tchiotsa, D. T., Fokou, E., Kansci, G., & Mbiapo, F. (2004). Chemical composition and functional properties of flours of four cultivars of Bambara groundnut (Vigna subterranean L. Verdc). Journal of the Cameroon Academy of Sciences, 4(1), 345–352.
- Ubbor, S. C., & Akobundu, E. N. T. (2009). Quality characteristics of cookies from composite flours of watermelon seed, cassava, and wheat. Pakistan Journal of Nutrition, 8(7), 1097–1102. https://doi.org/10.3923/pjn.2009.1097.1102
- Yasumatsu, K., Sawada, K., Maritaka, S., Wada, J., Toda, T., & Ishi, K. (1972). Whipping and emulsifying properties of soybean products. Agricultural and Biological Chemistry, 36(5), 719–727. https://doi.org/10.1271/bbb1961.36.719
- Yasunaga, T., & Uemura, M. (1962). Evaluation of colour characteristics of flours from various types and varieties of Wheat. Cereal Chemistry, 39(3), 171–183.
- Zucco, F., Borsuk, Y., & Arntfield, S. D. (2011). Physical and nutritional evaluation of wheat cookies supplemented with pulse flours of different particle sizes. LWT-Food Science and Technology, 44(10), 2070–2076. https://doi.org/10.1016/j.lwt.2011.06.007