
 ?Mathematical formulae have been encoded as MathML and are displayed in this HTML version using MathJax in order to improve their display. Uncheck the box to turn MathJax off. This feature requires Javascript. Click on a formula to zoom.
ABSTRACT
This study investigated the use of local root and tuber crops to partially replace corn as the sole carbohydrate source in the production of a ready-to-eat (RTE) breakfast food. Extreme vertices mixture design was used to formulate composites from Cassava, Orange-fleshed Sweetpotato (OFSP) and Bambara groundnut flours to replace 55% of maize. The nine formulations obtained were processed into RTE by drum drying. Protein, fat and ash content increased with the increase in Bambara groundnut content, while carbohydrate and fiber content increased with increasing cassava and Orange-fleshed Sweetpotato flour content. Beta-carotene content increased with increasing OFSP substitution. Protein and starch digestibility was affected by drum drying. Low values (40.49 to 47.39) for the glycemic index were observed for various formulations. Sensory evaluation of the products showed significant differences (p < .05) in terms of color, sweetness and overall acceptability of the breakfast product. The products were highly acceptable to consumers.
1. Introduction
In the recent years there has been an increasing interest in promoting the use of roots and tuber crops in the production of ready-to-eat (instant) and ready-to-cook foods, such as breakfast cereals, bread, snacks, pastas, etc. The commonest raw materials employed in the manufacture of these foods are cereals (Ding et al., Citation2006). Typically, ready to eat (RTE) breakfast foods are carbohydrate dense low-fat foods that are usually fortified with vitamins and minerals and may be consumed with milk, which is a significant source of protein, minerals and vitamins (Kanu et al., Citation2009). Roots and tuber crop due to their high moisture content are either processed into flour or complemented with cereals. They are important sources of carbohydrates (starches and fiber) and generally have relatively low and poor protein quality. The formulation of root and tuber composite flours significantly improves the content of crude proteins, fat, fibre and ash (Shahzadi et al., Citation2005). On the other hand, legumes, are rich in proteins, minerals and vitamins. Legume proteins have been established to be suitable for complementing the protein in cereal grains (since cereals lack both lysine and threonine which are abundant in legumes). By supplementing cereals with legumes, a complete protein (balanced and adequate amount of essential amino acids) would be obtained (Dhingra & Jood, Citation2002). Amagloh et al. (Citation2012) observed a significant nutritional benefit in sweet potato-based composite flour than the maize-based composite flour to be used for complementary feeding. Sweet potato contains β-carotene which is converted to vitamin A in the body and plays a crucial role in the prevention of chronic diseases during adult life due to their antioxidant abilities (Usha et al., Citation2010).
Nonetheless, in the selection of raw materials, factors such as availability and cost of crop, compatibility as well as the nutritional aspect of the crop must be taken into consideration. Formulation of ready-to-eat (RTE) breakfast food products using local food resources will not only reduce the market cost, but also promote their cultivation and diversify their utilization. Thus, this study explored the use of orange-fleshed Sweetpotato (OFSP), cassava and Bambara groundnut flour in an RTE breakfast food formulation to partially replace maize and improve the protein as the general nutrient profile. The characteristics of the formulated product including nutritional composition, microbial quality and sensory acceptability, were also studied.
2. Materials and methods
2.1. Source of raw materials
Cassava, Bambara groundnut and Maize were procured from a local market in Accra. The orange-fleshed sweet potatoes were procured from E. Darkey and Associates Limited, Accra, Ghana.
2.2. Preparation of flour from raw materials
Orange-fleshed sweet potatoes (Ipomoea batatas) and fresh cassava roots were sorted, pre-washed, peeled and washed again with clean water. The cleaned sweet potatoes were cut into slices of about 5 mm thickness. They were then immersed in 0.075% sodium metabisulfite solution for 5 min (to prevent enzymatic browning of the sweet potatoes) and dried at 60°C in an air oven for 8 h. The dehydrated samples were milled and passed through a 250 μm sieve to obtain the flour (Kure et al., Citation2021). For cassava flour, re-washed cassava was grated into a smooth pulp, pressed to dewater using a manual screw press. The pressed pulp was sifted to obtain fine grains and then dried in an air oven at 65°C for 10 h to obtain free-flowing dry cassava flour (Lagnika et al., Citation2019). Maize grits were milled using a hammer mill and passed through a 250 μm sieve in the same way as the roots and tubers (sweetpotatoes and cassava) to obtain maize flour. Bambara groundnuts were sorted, soaked in water for 12 h, dehulled, dried for 6 hours at 60°C. °C in an air oven and then roasted for 30 minutes at 120°C. The roasted seeds were then milled into flour (Ogunmuyiwa et al., Citation2017). All the flour samples were collected in airtight containers and stored for later use and analysis.
2.3. Composite flour preparation
Flour blends were prepared from orange sweet potato (OFSP), cassava (CF), Bambara groundnut (BF) and maize (MF). A three-component constrained extreme vertices design was used to develop different composites for the ready-to-eat (RTE) breakfast formulations. Each formulation contained 45% maize flour and the remainder consisted of varying proportions of cassava flour (between 10 and 30%), orange fleshed sweet potato (OFSP) (between 10 and 40%) and Bambara groundnut flour (between 5 and 15%).
2.4. Processing of the ready-to-eat (RTE) breakfast food
The individual formulations (S1-S9) () were reconstituted with distilled water in a ratio of 1:2 [formulation (g): water (ml)] to prepare a slurry. Drum drying of the slurry was done (using a laboratory atmospheric double GOUDA drum dryer Andritz Douda Coenecoop 88 2741 PD Waddinxveen-Holland). The drum dryer was set to a temperature of 175°C and at a speed of 35 rpm. The slurry prepared was fed into the drum dryer and the thin pre-cooked flakes obtained were collected and milled into powder. The product was packaged in a clean polyethylene bag and stored in a refrigerator (4°C) for further analyses.
Table 1. Design matrix for ingredient combination.
2.5. Compositional analysis
2.5.1. Proximate composition
Triplicate samples of each formulation were taken to measure moisture (AOAC, Citation2000), fat (AOAC, Citation2005), protein content (AOAC, Citation2000), ash content (AACC, Citation2000), and crude fiber (AACC, Citation2000). Protein content was calculated using conversion factors 6.25. Carbohydrate was calculated by difference method.
2.5.2. Determination of β-carotene content
Beta-carotene content was determined using the procedure described by Rodriguez-Amaya and Kimura (Citation2004). The dried sample residue was reconstituted with mobile phase (1 mL hexane) and vortexed. A standard solution of β-carotene was prepared by dissolving 10 mg in 100 ml of n-hexane. The HPLC system (Agilent System, Santa Clara, CA, U.S.A.) was calibrated using the blank (mobile phase) and was thoroughly washed with a 1:9 mixture of hexane and methanol at a flow rate of 1 mL/min. The total run time was 35 min and the filtrate injection volume was 10 μl. The UV detector used was set to a wavelength of 450 nm. Duplicate measurements were taken and the average was calculated for each sample.
2.5.3. In Vitro protein digestibility
Pepsin (1.5 mg) was dissolved with 0.1N HCl. The stock solution was added to 0.2 g of sample in a 50 ml tube. After mixing, the samples were incubated at 37°C for 3 h. About 3.3 mL of 0.5 M NaOH was added to the suspension to neutralize it, then 4 mg of pancreatin was added. The mixture was mixed gently and incubated for 24 h at 37°C. To access nitrogen in the sample supernatant, the sample was centrifuged at 2000 × g for 20 min after treatment of the supernatant with 10 ml of 10% trichloroacetic acid (Saunders et al., Citation1973). Protein digestibility was determined using the formula as follows:
2.5.4. In Vitro starch digestibility
Ten milliliters (10 mL) of distilled water was added to 0.7 g of sample and boiled. The boiled sample was mixed with 10 ml of enzyme solution. The enzyme solution was prepared according to the protocol of Englyst et al. (Citation1992). The mixture was incubated at 37°C, followed by pipetting 0.1 mL of the hydrolyzed sample and adding it to 0.9 mL of 80% ethanol at 20 min intervals for 2 h to stop the hydrolysis. Starch digestibility of the product was classified based on the following: rapidly digestible starch (RDS) (glucose detected after 20 minutes × 0.9), slowly digestible starch (SDS) (glucose detected after 120 minutes – glucose detected after 20 minutes) × 0.9). A glucose standard curve was prepared and the extent of hydrolysis was calculated as the proportion of starch converted to glucose.
2.6. Microbial enumeration
A microbial count test (total platelet count, coliform bacteria, yeast and mold) was performed prior to sensory testing. Plate culture agar, violet bile agar and malt extract agar were used to determine the total bacterial count, coliform bacteria, yeast and mould. Media were prepared using methods specified by the manufacturer and peptone water was used as diluent. The pouring plate method as described by Morello et al. (Citation2003) was used for the microbial analysis. Samples were incubated at temperatures of 37°C for 24 h, 37°C for 24 h, 25°C for 48 to 96 h for total bacterial count, coliform, and yeast and mould, respectively.
2.7. Sensory evaluation
2.7.1. Quantitative descriptive analysis (QDA)
Nine (9) trained panelists were used for sensory descriptive evaluation. The test was conducted at the Sensory Laboratory of the Department of Nutrition and Food Science, University of Ghana. Approval for the sensory study (ECBAS 048/15–16) was obtained from the Ethics Committee of the College of Basic and Applied Sciences, University of Ghana. Panelists were asked to rate the appearance, aroma, mouthfeel and taste of the samples. The panelists were asked to generate lexicons that best describe each product. After several sessions, the descriptive panelists, led by the panel leader, developed and produced the final list of lexicons. The samples were then scored by panelists based on the lexicons using a 10 cm line scale. The ready-to-eat breakfast meal was prepared by adding 10 g of sample to 75 ml of warm water and presented in containers (cups) of the same size to the panelists for evaluation. The products were evaluated in three sessions. Panelists were to evaluate 5 samples per session to avoid sensory fatigue. Water was used as a palate cleanser.
2.7.2. Consumer acceptance test
A consumer acceptance test was conducted using 75 untrained panelists. Approval for the sensory study (ECBAS 048/15–16) was obtained from the Ethics Committee of the College of Basic and Applied Sciences, University of Ghana. Using a 9-point hedonic scale (1 - extremely dislike, 5 - neither like nor 9 - extremely like), panelists were asked to rate the products according to how much they liked the following attributes: color, sweetness, aroma, feel in mouthfeel, aftertaste and overall acceptability).The ready-to-eat breakfast meal was prepared by adding 10 g of sample to 75 ml of warm water. Each panelist was presented with the reconstituted ready-to-eat breakfast food for evaluation. Water was used as a palate cleanser. Bias was reduced by using same sized containers (cups) and the same volume of reconstituted ready-to-eat breakfast food.
2.8. Statistical analysis
The results for the proximate composition and in vitro digestibility (protein and starch) were reported as mean±standard deviation of triplicate determinations. Microbial analysis results were reported as mean log CFU/g ±standard deviation. Sensory evaluation data was presented as mean±standard deviation of scores for the product attributes assessed by the panelists. One way analyses of variance (ANOVA) was used compare the means and the least significance difference (LSD) test (LSD) was used to determine differences between the formulations at p ≤ .05.
3. Results and discussion
3.1. Proximate composition of ready-to-eat (RTE) breakfast food
The nutritional composition (moisture, protein, fat, ash, crude fiber, carbohydrates and energy) of ready-to-eat (RTE) products were determined. From , it was observed that there was significant difference (p < .05) between the samples. This shows that mixing cereals (such as maize) and legumes (such as groundnuts) with the orange flesh of sweet potatoes and cassava had a significant effect on the chemical composition of the resulting products.
Table 2. Proximate composition of RTE breakfast food.
The moisture content of the formulated products ranged from 3.48 to 4.54% (). This relatively low value was comparable to the moisture content of dry food systems, which is generally between 6% and 10%. It follows that the formulated products will have good storage stability provided they are well packaged to prevent moisture absorption from the environment during storage (Afoakwa et al., Citation2007). The protein and fat content of the formulated products ranged from 7.29 to 9.40% and 1.50 to 2.87%, respectively (). Both protein and fat content of the samples increased significantly with the increase in Bambara groundnut flour (BF) substitution. This was expected as legumes contain significant amounts of protein and fat. This phenomenon was evident from the values recorded for the formulated product S6, which contained the highest amount of Bambara groundnut flour (). The observed values () were slightly lower than the protein standard of FAO (Citation1990) and the standard of Codex Alimentarius Commission (CAC, Citation2011). However, since the product would be consumed with additional milk, the protein and other micronutrient content may be improved. On the other hand, the recorded values were also lower than the 10 to 20% recommendation for fat in supplementary food formulations. However, the observed results indicate that the formulated products were unlikely to undergo substantial oxidative rancidity when stored at room temperature. Carbohydrate content in the samples ranged from 79.80 to 85.62% (). The higher values recorded due to the fact that the samples were mainly composed of carbohydrate-rich materials. The crude fiber content of the formulated products showed significant difference (p < .05) and ranged from 1.00 to 2.34% (). However, these values were within the permissible levels established by the Codex Alimentarius Commission (Citation2011), which states that the fiber content should be less than 5%. The ash content of a food sample gives an idea of the level of inorganic elements (minerals) present in the food (Kavitha & Parimalavalli, Citation2014). The ash content of the formulated products ranged from 1 to 2.34%. FAO (Citation1990) states that the ash content of supplementary food should be less than 5%.
3.2. β-carotene content of the RTE breakfast food
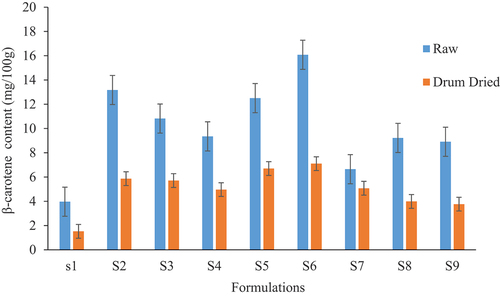
The results for the β-carotene content of the raw and drum-dried formulations are shown in . The β-carotene content of the raw mixtures ranged from 3.99 to 16.08 mg/100 g and of the drum-dried samples from 1.53 up to 7.10 mg/100 g (). It was observed that there was a significant decrease in β-carotene content after drum drying. For example, sample S6, which initially contained 16.08 mg/100 g of β-carotene, decreased to 7.10 mg/100 g (). Burgos et al. (Citation2001) reported that the β-carotene content of orange sweet potato flour (OFSP) ranged from 4.29 mg/100 g to 18.55 mg/100 g. The range from 3.99 to 16.08 mg/100 g obtained from this study was similar to the range reported by Burgos et al. (Citation2001). As expected, the β-carotene content of the formulations were significantly affected by the proportion of orange-fleshed sweet potatoes (OFSP) in the formulation. As substitution of orange-fleshed sweet potato increased and Bambara groundnut flour decreased, β-carotene content increased. Sample S1, which had the lowest substitution of orange-fleshed sweet potato (10%) and the highest substitution of Bambara groundnut flour (15%), recorded the lowest β-carotene content. β-carotene plays a vital role in the growth and development of infants and young children and contributes other health benefits such as reducing cardiovascular disorders (Njoku et al., Citation2011).
Figure 1. β-carotene content of the formulations.
3.3. In vitro protein digestibility of the RTE breakfast food
Protein quality in raw mixtures and their products was determined from the protein digestibility factor (Chinma et al., Citation2011). In vitro protein digestibility provides information on how certain specific proteins are digested and their corresponding quality (Day & Swanson, Citation2013). In vitro protein digestibility (IVPD) is related to actual digestibility and is commonly used as a quick and convenient alternative (Adam et al., Citation2013). IVPD ranged from 48–65% for the raw mixtures and 68.34–88.6% for drum dried samples (). Studies have shown that heat treatment such as drum drying improves digestibility (Abdel-Aal & Hucl, Citation2002; Giami et al., Citation2001). The alteration of the protein structure in the presence of heat increases structural changes of proteins such as globulin, and this gives access to proteases and consequently increases protein digestibility (Occena et al., Citation1997; Swaisgood & Catignani, Citation1991). In addition, the application of heat to food can also reduce the levels of heat-labile antinutrients such as enzyme inhibitors, oligosaccharides, and improve protein digestibility of legumes such as peanuts. Increasing the amount of OFSP substitution was observed to increase protein digestibility. The digestible protein content was higher for samples with higher substitution of BG and OFSP compared to the formulations containing higher Bambara groundnut and cassava flour. Therefore, the inclusion of OFSP in instant breakfast food may increase its in vitro protein digestibility.
Table 3. In vitro protein digestibility of the RTE breakfast food.
3.4. In Vitro starch digestibility of the RTE breakfast food
Based on the rate of digestion, starches are categorised as rapidly digestible starch (RDS), slowly digestible starch (SDS) and resistant starch (RDS) (Englyst et al., Citation1992). The rate of digestion of starch with its resulting glycemic effect is greatly influenced by the composition of the food, processing conditions and source of starch (Niba, Citation2003). From , significant differences in total starch content was observed for all the formulations. The values ranged from 66.96 to 77.00 (). Starch granules break down during heating, allowing pancreatic α-amylase to facilitate starch hydrolysis. The RDS content of the samples ranged from 19.06 to 23.90, while the SDS content ranged from 29.16 to 40.51 (). In general, values for rapidly digestible starch (RDS) and slowly digestible starch (SDS) were statistically similar (p ≤ .05). However, for formulation S7, the RDS was significantly lower than that of formulations S8 and S6. SDS was lower for S1, S2 and S9 (). It was observed that increasing Bambara groundnut content increased starch digestibility. A study by Mahmood (Citation2006) and Rooney and Pflugfelder (Citation1986) reported that proteins form a film around starch granules and thus prevent starch-hydrolyzing enzymes from accessing the starch granules, thereby prolonging digestion. The SDS values recorded were higher than RDS. Foods containing high amounts of slowly digestible starch (SDS) are considered suitable for people with metabolic disorders such as diabetes or glycogen storage disease because the release of glucose is gradual and prolonged (Zhang & Hamaker, Citation2009). Also, foods with higher SDS prolong the feeling of satiety (Miao et al., Citation2015).
Table 4. Starch digestibility of the RTE breakfast food.
In terms of glycemic index (GI), foods can be divided into three classes: low GI; < 55, medium GI = 55–69 and high GI; ≥ 70 (Odenigbo et al., Citation2012), equivalent to good, better and best in terms of nutrition. The calculated values for the formulations ranged from 40.49 to 47.39. Since the GI values obtained were below ≤ 55, all the formulated products can be considered as low-glycemic food. Consuming foods containing slow-digesting carbohydrates and a low glycemic index can improve glucose tolerance in both healthy and diabetic patients.
3.5. Microbiological quality of the RTE breakfast food
Microbiological assessment of the formulations were performed prior to sensory evaluation. This was, to find out whether the products were safe for human consumption. The microbial load of the formulated products are presented in . The results obtained were in accordance with the standards set by the Ghana Standards Authority (GS 955: Citation2013). This shows that the cooking process (drum drying) inactivated all enzymes and also killed heat sensitive and pathogenic microorganisms. The products were also prepared under hygienic conditions and environment. The results showed that there was no significant difference (p ≤ .05) in the microbial counts of the different products. The products were found to be free from yeast and mould and coliform bacteria. With the low moisture content of the samples ranging from 3.48 to 4.54% (), the samples are expected to have longer shelf life, as the population of aerobic mesophiles was found to be between 0 and 2.15 log CFU/g (). Also, provided that the products are well packaged to prevent the absorption of moisture from the environment during storage, they will keep longer.
Table 5. Microbial load of the RTE breakfast food.
3.6. Sensory evaluation of RTE breakfast food
3.6.1. Qualitative descriptive analysis (QDA) of RTE breakfast food
Nine (9) trained panelists were used for the descriptive analysis. Panelists generated attributes which best described each of the reformulated ready-to-eat product. The formulation products were described as having cream color ranging from yellowish to cream to a granular or particulate nature when compared to Cerelac (an infant cereal manufactured by Nestlé Ghana). The products were also been described as being sticky, viscous, and having the smell and taste of boiled corn. Again, it was described as sweet, with a gritty and viscous mouthfeel and an astringent aftertaste. Panelists were generally unable to detect differences in aroma, stickiness, taste, astringency and gritty mouthfeel. However, there were significant differences (p < .05) in terms of color, viscosity as well as sweetness of the formulations as shown in . Attributes with (*) indicate that there was no significant difference between the formulations.
Figure 2. Qualitative descriptive analysis of formulations for appearance (Ap) and aroma (Ar)attributes with (*) means that there was no significant difference between formulations. S1(30:10:15), S2(14:34:7), S3 (9:34:12), S4 (24:24:7), S5(10:40:5), S6(0:40:15), S7(17:28:10), S8(30:20:5), S9(24:19:12). CF: SP:BF (Cassava flour: Sweet potato flour: Bambara groundnut flour.
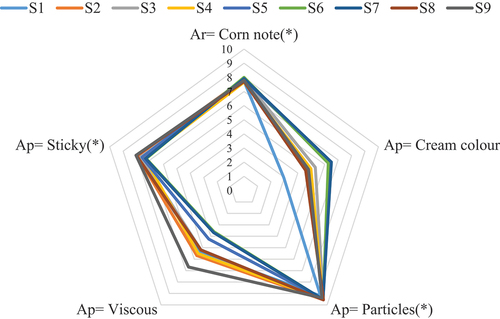
Figure 3. Qualitative descriptive analysis of formulations for mouth feel (mf), flavour (fl) and aftertaste (af). Attributes with (*) means that there was no significant difference between formulations. S1(30:10:15), S2(14:34:7), S3 (9:34:12), S4 (24:24:7), S5 (10:40:5), S6 (0:40:15), S7 (17:28:10), S8 (30:20:5), S9(24:19:12). CF: SP:BF (Cassava flour: Sweet potato flour: Bambara groundnut flour.
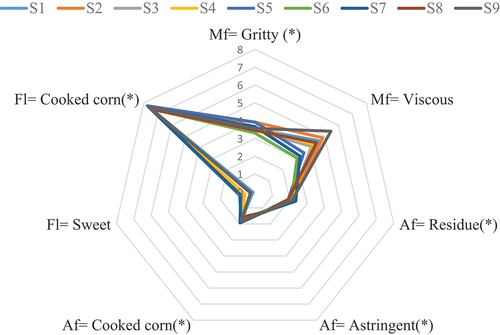
Using a 10 cm line scale where 10 cm represents the highest intensity, formulations S6, S5, S2 and S3 recorded higher color intensity scores, which was due to the increase in OFSP substitution as it contributed to the increased color intensity. A similar trend was observed for sweetness and the opposite trend was observed for viscosity. Sweetness ratings were generally low. Values ranged from 0.12 to 0.89. It should be noted that the samples were served without added sugar or sweetener. However, this confirms that the use of OFSP in RTE breakfast foods would require less added sugar or sweetener. Increasing OFSP substitution caused a decrease in the viscosity of the various formulations, which was also confirmed by the findings of Amagloh et al. (Citation2012).
3.6.2. Consumer acceptance test of RTE breakfast food
Sensory response to the color, taste, smell and texture of food helps to determine food preferences and eating habits (Fellows, Citation2000). Differences in ingredients have a substantial effect on acceptability, which may be due to the effect of ingredient mixtures on sensorial properties. shows the mean taste scores for the sensory attributes for the ready-to-eat breakfast formulations. A total of 75 untrained panelists were used in this study. Average consumer acceptability scores for aroma, sweetness, viscosity, color, and overall acceptability ranged from 6 (like slightly) to 8 (like very much) on a 9-point hedonic scale.
Table 6. Consumer acceptance of the RTE breakfast food.
Product appearance is often a critical attribute by which consumers base their decision to purchase or consume a product. One such attribute is color. The color usually expresses the freshness of the product. Statistically significant differences (p < .05) were observed with respect to color (). With the increasing proportion of OFSP, the color intensity of the products decreased from yellowish to cream. The most preferred sample in terms of color was formulation S6 (with a score of 8.4), while the least preferred was formulation S1 (with a score of 6.7).
Taste is also another important parameter in the sensory evaluation of food products. The appearance of the product may attract the consumer to its first purchase, but to ensure the continuation of the purchase, the taste, sweetness and aroma must be considered. No significant differences were found for the smell. This can be attributed to the taste of the cooked corn as perceived by the trained panelists. The same amount of corn flour (45%) used in all products masked the aroma of the other ingredients present. It was observed that the sweetness increased with increasing proportion of OFSP in the different formulations.
Significant differences (p < .05) were observed for mouthfeel in terms of how viscous or how thick the product felt in the mouth. High scores were observed for samples with high proportion of OFSP (). It was found that samples with high OFSP had lower viscosity, indicating that consumers preferred samples with lower viscosity. After swallowing the sample, no significant differences were found in terms of the aftertaste for the different formulations. Consumers generally liked the mouthfeel after swallowing the product.
Overall acceptability has to do with the approval of the product when all attributes have been considered. The overall acceptability of the formulations ranged from 6.98 to 8.50. This suggests that all the formulations were generally liked by the consumers. However, formulation S6 was the most acceptable to consumers with a mean preference value of 8.50, which was significantly (p < .05) different from the others, and formulation S1 was the least preferred (). The results revealed that the addition of OFSP to the RTE breakfast formulations significantly improved their overall acceptability.
For a new product to succeed on the market, consumer acceptability is very important. Thus, based on the responses from the panelists, about 78% of them said that they are more likely to buy the product if it is available on the market. Correspondingly, the average scores obtained for the overall acceptability of the product was a good indicator that the product would be patronized. A high overall acceptability score is often an guide that the product stands a good chance of success because consumers are likely to purchase the product if available on the market.
4. Conclusion
This study recommends that use of cassava and orange-fleshed sweet potato flour together with Bambara groundnut and maize for the formulation of RTE breakfast products with improved nutritional properties. Bambara groundnut influenced the protein and ash content of the products. However, the increase in cassava and orange-fleshed sweet potato (OFSP) flour content resulted in increased fiber content. The protein and starch digestibility of all formulations was improved by the drum drying process. β-carotene content was observed to increase with higher OFSP flour substitution. The inclusion of orange-fleshed sweet potatoes served as a source of β-carotene and this will be beneficial managing vitamin A deficiency. The most favorable formulation among the products with based on the sensory evaluation were samples containing 28 to 40% orange-fleshed sweet potato flour (S5, S6 and S7). Also, the substitution or addition of cassava flour up to about 20% in the formulation was also highly acceptable. Based on the consumer acceptance test, the inclusion of cassava and orange-fleshed sweet potato (OFSP) in RTE breakfast foods would be successful as indicated by the high overall consumer acceptability scores.
Acknowledgment
This manuscript derives from the thesis titled: “Extending the Application of Root and Tuber Crops into Ready-to-Eat Breakfast Foods”, University of Ghana (2019) by Pamela Osei Owusu.
Disclosure statement
No potential conflict of interest was reported by the author(s).
Data availability statement
The authors declare that the data supporting the findings of the study entitled “Nutritional Composition and Sensory Acceptability of Ready-To-Eat (RTE) Breakfast Food Developed from Root and Tuber Crops” are available within this article.
References
- AACC. (2000). Approved methods of the AACC (10th ed.). American Association of Cereal Chemists.
- Abdel-Aal, E. S., & Hucl, P. (2002). Amino acid composition and in vitro protein digestibility of selected ancient wheats and their end products. Journal of Food Composition and Analysis, 15(6), 737–8. https://doi.org/10.1006/jfca.2002.1094
- Adam, G. O. A., Hua, Y., Chamba, M. V. M., & Gasmalla, M. A. (2013). Functional properties and in vitro protein digestibility of fermented sorghum and broad bean (Visia faba L. Major blended flour. Pakistan Journal of Food Science, 23(1), 10–16.
- Afoakwa, E. O., Paterson, A., & Fowler, M. (2007). Factors influencing rheological and textural qualities in chocolate–a review. Trends in Food Science & Technology, 18(6), 290–298. https://doi.org/10.1016/j.tifs.2007.02.002
- Amagloh, F. K., Hardacre, A., Mutukumira, A. N., Weber, J. L., Brough, L., & Coad, J. (2012). Sweet potato-based complementary food for infants in low-income countries. Food and Nutrition Bulletin, 33(1), 3–10. https://doi.org/10.1177/156482651203300101
- AOAC. (2000). Official method of analysis (17th ed.). Association of Official Analytical Chemist.
- AOAC. (2005). Official methods of analysis (18th ed.). Association of Official Analytical Chemists.
- Burgos, G., Rossemary, C., Cynthia, S., Sosa, P., Porras, E., Jorge, E., & Wolfagang, G. (2001). A color chart to screen for high beta-carotene in orange fleshed sweet potato breeding. International Potato Center.
- Chinma, C. E., James, S., Imam, H., Ocheme, O. B., Anuonye, J. C., & Yakubu, C. M. (2011). Physicochemical and sensory properties, and in-vitro digestibility of biscuits made from blends of tigernut (Cyperus esculentus) and pigeon pea (Cajanus cajan). Nigerian Journal of Nutritional Sciences, 32(1), 55–62. https://doi.org/10.4314/njns.v32i1.67816
- Codex Alimentarius Commission. (2011). Guidelines on formulated supplementary foods for older infants and young children, proposed draft revision, Codex Alimentarius Commission, Joint FAO/WHO food standards programme, Codex Committee on nutrition and foods for special dietary uses, CX/NFSDU 11/33/8.
- Day, L., & Swanson, B. G. (2013). Functionality of protein-fortified extrudates. Comprehensive Reviews in Food Science and Food Safety, 12(5), 546–564. https://doi.org/10.1111/1541-4337.12023
- Dhingra, S., & Jood, S. (2002). Organoleptic and nutritional evaluation of wheat breads supplemented with soybean and barley flour. Food Chemistry, 77(4), 479–488. https://doi.org/10.1016/S0308-8146(01)00387-9
- Ding, Q. B., Ainsworth, P., Plunkett, A., Tucker, G., & Marson, H. (2006). The effect of extrusion conditions on the functional and physical properties of wheat-based expanded snacks. Journal of Food Engineering, 73(2), 142–148. https://doi.org/10.1016/j.jfoodeng.2005.01.013
- Englyst, H. N., Kingman, S. M., & Cummings, J. H. (1992). Classification and measurement of nutritionally important starch fractions. European Journal of Clinical Nutrition, 46(2), S33–50.
- FAO/WHO. (1990). Protein quality evaluation. In Report of a joint FAO/WHO expert consultation (p. 23). Food and Agriculture Organization of the United Nations.
- Fellows, P. J. (2000). Food processing technology: Principles and practice (2nd ed.). Woodhead Publishing.
- Ghana Standards GS 955. (2013). Microbiological analysis of food – sampling plans and microbiological criteria. Ghana Standards Authority.
- Giami, S. Y., Adindu, M. N., Hart, A. D., & Denenu, E. O. (2001). Effect of heat processing on in vitro protein digestibility and some chemical properties of African breadfruit (Treculia africana Decne) seeds. Plant Foods for Human Nutrition, 56(2), 117–126. https://doi.org/10.1023/A:1011181412808
- Kanu, P. J., Sandy, E. H., Kandeh, B. J., Bahsoon, J. Z., & Huiming, Z. (2009). Production and evaluation of breakfast cereal-based porridge mixed with sesame and pigeon peas for adults. Pakistan Journal of Nutrition, 8(9), 1335–1343. https://doi.org/10.3923/pjn.2009.1335.1343
- Kavitha, S., & Parimalavalli, R. (2014). Effect of processing methods on proximate composition of cereal and legume flours. Journal of Human Nutrition and Food Science, 2(4), 1051.
- Kure, A. O., Ariahu, C. C., & Eke, M. O. (2021). Effect of incorporating orange flesh sweet potato flour, starch and non-starch residue flour to wheat on the quality characteristics of cookies. Asrjets Journal Org, 77(1), 200–219. https://doi.org/10.9734/afsj/2021/v20i330274
- Lagnika, C., Houssou, P. A. F., Dansou, V., Hotegni, A. B., Amoussa, A. M. O., Kpotouhedo, F. Y., Doko, S. A., & Lagnika, L. (2019). Physico‐functional and sensory properties of flour and bread made from composite wheat‐cassava. Pakistan Journal of Nutrition, 18(6), 538–547. https://doi.org/10.3923/pjn.2019.538.547
- Mahmood, I. (2006). Resistant starch in raw and processed roots and tubers. Journal of Food Science and Technology, 43(3), 282–285.
- Miao, M., Jiang, B., Cui, S. W., Zhang, T., & Jin, Z. (2015). Slowly digestible starch —A review. Critical Reviews in Food Science and Nutrition, 55(12), 1642–1657. https://doi.org/10.1080/10408398.2012.704434
- Morello, J. A., Mizer, H. E., & Granato, P. A. (2003). Cultivation of microorganisms. In J. A. Morello, H. E. Mizer, and P. A. Granato (Eds.), Laboratory manual and workbook in microbiology, applications to patient care (7th ed., pp. 65–67). The McGraw−Hill Companies.
- Niba, L. L. (2003). Processing effects on susceptibility of starch to digestion in some dietary starch sources. International Journal of Food Sciences and Nutrition, 54(1), 97–109. https://doi.org/10.1080/0963748031000042038
- Njoku, D. N., Vernon, G., Egesi, C. N., Asante, I., Offei, S. K., Okogbenin, E., Kulakow, P., Eke-Okoro, O. N., & Ceballos, H. (2011). Breeding for enhanced β-carotene content in cassava: Constraints and accomplishments. Journal of Crop Improvement, 25(5), 560–571. https://doi.org/10.1080/15427528.2011.594978
- Occena, L. G., Bennink, M. R., Uebersax, M. A., & Chung, Y. S. (1997). Evaluation of drum‐dried meals prepared from split beans (Phaseolus vulgaris l.): Protein quality and selected antinutritional factors. Journal of Food Processing and Preservation, 21(4), 335–344. https://doi.org/10.1111/j.1745-4549.1997.tb00787.x
- Odenigbo, A., Rahimi, J., Ngadi, M., Amer, S., & Mustafa, A. (2012). Starch digestibility and predicted glycemic index of fried sweet potato cultivars. Functional Foods in Health and Disease, 2(7), 280–289. https://doi.org/10.31989/ffhd.v2i7.83
- Ogunmuyiwa, O. H., Adebowale, A. A., Sobukola, O. P., Onabanjo, O. O., Obadina, A. O., Adegunwa, M. O., Kajihausa, O. E., Sanni, L. O., & Keith, T. (2017). Production and quality evaluation of extruded snack from blends of bambara groundnut flour, cassava starch, and corn bran flour. Journal of Food Processing and Preservation, 41(5), e13183. https://doi.org/10.1111/jfpp.13183
- Rodriguez-Amaya, D. B., & Kimura, M. (2004). HarvestPlus handbook for carotenoid analysis (Vol. 2). International Food Policy Research Institute (IFPRI).
- Rooney, L. W., & Pflugfelder, R. L. (1986). Factors affecting starch digestibility with special emphasis on sorghum and corn. Journal of Animal Science, 63(5), 1607–1623. https://doi.org/10.2527/jas1986.6351607x
- Saunders, R. M., Connor, M. A., Booth, A. N., Bickoff, E. M., & Kohler, G. O. (1973). Measurement of digestibility of alfalfa protein concentrates by in vivo and in vitro methods. The Journal of Nutrition, 103(4), 530–535. https://doi.org/10.1093/jn/103.4.530
- Shahzadi, N., Butt, M. S., Rehman, S. U., & Sharif, K. (2005). Rheological and baking performance of composite flours. International Journal of Agriculture and Biology, 7(1), 100–104.
- Swaisgood, H. E., & Catignani, G. L. (1991). Protein digestibility: In vitro methods of assessment. In Advances in food and nutrition research, 35(1), 185–236. Academic Press.
- Usha, R., Lakshmi, M., & Ranjani, M. (2010). Nutritional, sensory and physical analysis of pumpkin flour incorporated into weaning mix. Malaysian Journal of Nutrition, 16(3), 379–387.
- Zhang, G., & Hamaker, B. R. (2009). Slowly digestible starch: Concept, mechanism, and proposed extended glycemic index. Critical Reviews in Food Science and Nutrition, 49(10), 852–867. https://doi.org/10.1080/10408390903372466