
ABSTRACT
Most studies on autism spectrum disorder (ASD) risk factors have been conducted in developed countries where ethnicity and environment are different than in developing countries. We compared nutritional status, immune response and microbiota composition in mestizo children with ASD with matched controls in Ecuador. Twenty-five cases and 35 controls were matched by age, sex and school location. The prevalence of under- and overweight was higher in children with ASD. Nutritional differences were accompanied by abnormal food habits and more frequent gastrointestinal symptoms in children with ASD. Also, greater serum concentrations of TGF-β1 were observed in children with ASD. Finally, there was greater alpha diversity and abundance of Bacteroides (2 OTUs), Akkermansia, Coprococcus and different species of Ruminococcus in ASD children.
Introduction
The etiology of autism spectrum disorder (ASD), a condition characterized by limitation in communication skills and repetitive behaviors, is poorly understood (reviewed inCitation1). Autism spectrum disorder is a rapidly increasing public health problem. In the United States, the prevalence of ASD was 1 in 150 in 2000, but by 2014 it had increased to 1 in 59.Citation2 A single pilot study in school children in the city of Quito – Ecuador reports a low prevalence of 0.11%.Citation3 The causes of ASD have been associated with both genetic and environmental components.Citation2 The prevalence of autism is also more common among males than femalesCitation4 and is influenced by ethnicity.Citation5 Among 8-year-old children, the prevalence of ASD was greater for non-Hispanic whites than non-Hispanic blacks, and these two groups had a greater prevalence of ASD than Hispanic children.Citation5 These differences could reflect different susceptibilities for the condition and therefore it is important to study ASD risk factors in different geographic areas in different ethnic groups.
In addition to potential genetic susceptibility, environmental risk factors associated with ASD include prenatal diet, perinatal stress, cesarean delivery, prematurity, limited breastfeeding, infections and use of antibiotics.Citation1,Citation6 Current evidence indicates that alterations in the microbiota-gut-brain axis could be associated with neurodevelopmental disorders, including ASD.Citation7–Citation9 The establishment of gut microbiota occurs during the first 2 years of life, a critical time for brain maturation and development.Citation10 In addition, the identified ASD risk factors can affect microbiota composition and, potentially, brain development.Citation6 Most studies on ASD and risk factors have been conducted in developed countries where ethnicity and environmental factors could be different than in developing countries.
A characteristic feature of children with ASD is the presence of malnutrition. Individuals with ASD usually have higher body mass index (BMI) and decreased specific nutrient intakeCitation11 compared to unaffected individuals. Common micronutrient deficiencies in children with ASD include iron, calcium, iodine, magnesium, selenium, vitamins D, E, B12, folate and biotin.Citation12 These nutrient deficiencies could be related to picky eating behaviors and gastrointestinal symptomatology, including food refusal, food allergies, constipation-diarrhea, food intolerance, abdominal pain that are more common in children with ASD than in the general population.Citation13,Citation14 The association of malnutrition, problematic eating behaviors and gastrointestinal symptomatology could also be related with the microbial dysbiosis observed in ASD individuals. It is important to study the nutritional component in ASD to prevent and care for this condition.
Current evidence of intestinal dysbiosis and nutritional alterations in ASD can elicit distinct responses by endocrine, nervous and immune systems. Several studies show that individuals with ASD present a pro-inflammatory status characterized by increased concentrations of TNF-α, IL-6, IL-1-β, IFN−γ, TGF-® in serum, spinal fluid and brain tissue.Citation15 Other alterations of innate, cellular and humoral immunity have also been described.Citation16 However, the observed immune phenotypes vary probably reflecting different stages of ASD condition and/or due to other variables of studied populations including ethnicity, different environments, genetic characteristics, etc.Citation17,Citation18 It is possible that the observed dysbiosis in ASD could cause an immune dysregulation exacerbating the inflammatory status and affecting behavior in affected individuals.
There is limited information on ASD and its risk factors in developing countries including Ecuador. Changes in microbiota composition observed in individuals with ASD from developed countries could differ or be similar from children with the condition in other geographic locations. It is important to study ASD within the context of different environments and ethnic groups. Therefore, the objective of the present study was to compare microbiota composition, nutritional status and immune status in mestizo children with ASD with controls matched by age, gender and environmental factors in Quito, Ecuador.
Methods and subjects
Study population
This case-control study compared socioeconomic, nutritional status, immune response and microbiome composition, between mestizo children with ASD and control children matched by age, gender and environmental factors in Quito. Children between 5 to 12 years of age, who attended school in the Metropolitan District of Quito (DMQ) were invited to participate. Children in the control group shared the same living geographic area, schools or other educational centers within DMQ. Twenty-five cases and 35 controls were matched by age, gender and school location. Children with preliminary diagnostic of ASD were contacted through the Association of Parents of Children with Autism in Quito by email to their parents. Parents and children who expressed their willingness to join our study were subsequently contacted in person. Diagnosis of autism was confirmed by certified professionals through Autism Diagnostics Interview – Revised (ADI-R) questionnaire;Citation19 while children in the control group were included when their scores were below the threshold of 15 in the Social Communication Questionnaire (SCQ).Citation20 Children were excluded if they experienced serious diseases such as cancer, HIV infection, or mental disabilities that precluded them to participate. Children were also excluded if they had acute infections and were currently taking or had taken antibiotics or systemic steroids during the 2 weeks prior to sample collection.
Anthropometric measurements
Trained personnel measured child weight and height using standardized techniques and calibrated equipment (TANITA BC-534 Glass InnerScan; SECA 201 stadiometerCitation21). During anthropometric measurements, children wore light clothing and no shoes. Growth charts for weight-, height- and BMI-for-age and sex from Anthro Plus WHO were used for anthropometric analysis.Citation22
Blood sample collection
Before blood sampling, parents and children were instructed with a video and simulation of sampling process in order to decrease children’s anxiety. Venous blood samples were drawn after overnight fasting by a qualified technician. Serum samples were obtained within 2 h after sampling and processed immediately for blood biochemistry analysis and 3 mL were stored at −80 for further determinations; total blood for cell count and complete hemogram analysis was done in anticoagulated (EDTA) blood samples.
Glucose, lipid profile, and hemogram determinations
Serum metabolites (glucose, total cholesterol, LDL-cholesterol, HDL-cholesterol and triglycerides) were measured using a Roche Modular Evo P800 using standard reagents (Roche Diagnostics GmbH. Mannheim, Germany). A complete blood cell count was measured in a hematology analyzer (Sysmex XN-3000 13705, 13706 series, Kobe, Japan) following manufacturer’s instructions.
Blood biochemistry and hemogram tests were done at NetLab laboratory that has national and international control systems.Citation23
Food intake
Parents completed a 24 h-recall form of food consumed by their children on 2 weekdays and 1 weekend day. Data were analyzed using the FoodProcessor software enriched with local recipes dishes. The software converts food into nutrients using mainly the US Department of Agriculture (USDA) food-composition database.Citation24
Immune status evaluation
To determine children’s immune status, several cytokines, growth factors and specific immunoglobulins were determined in serum. Transforming growth factor beta 1 was tested from serum samples using DuoSet Human TGF-β1 ELISA kit (R&D systems, cat.#DY240-05, Minneapolis, MN 55413, USA); limit of detection, 15.7 pg/mL. Interleukine-1β, IL-4, IL-6, IFN-γ were determined with DuoSet ELISA (R&D Systems, Minneapolis, MN) according to manufactured instructions. The limits of detection in pg/mL for measured cytokines were 1β (3.9), IL-4 (15.7), IL-6 (4.7), IFN-© (9.4). Anti-transglutaminase IgG and IgA antibodies were measured using the AESKULISA tTg-A New Generation (Cataloge code 3503-AES, Wendelsheim, Germany) following the manufacturer´s instructions.
Fecal samples collection and DNA extraction
Parents were instructed to collect stool samples at home in sterile plastic containers and store them at 4°C until delivery to the laboratory; samples were stored for less than 8 h before reaching the laboratory. Upon arrival, samples were stored at −80°C until DNA extraction. DNA was extracted from 500 mg fecal material using the FastDNA™ SPIN Kit for Soil (MP Biomedicals, USA), following the manufacturer’s protocol. Precellys 24 apparatus was used for homogenization (Bertin Technologies, FRANCE). At the end of extraction protocol, 50 μl of DNA was stored at −20°C until further PCR amplifications. The DNA quality and quantity were evaluated by measuring absorbance at 260 and 280 nm with a BioTek Synergy HT Multi-Mode reader spectrophotometer (BioTek® Insttruments, Inc., USA).
PCR amplification, library preparation and sequencing
Bacterial 16S rRNA variable region V4 was amplified using double-indexed primers to identify communities within each fecal sample. The barcodes were constructed based on the Earth Microbiome Project (http://www.earthmicrobiome.org). Amplicon purification was manually done using particle collector magnet DynaMag™-2 (Life Technologies AS, Norway) using the Beckman Colter Genomics Ampure® XP kit (Beckman Colter International, Inc., Indianapolis). Amplicons were pooled and sequenced on a single lane using miSeq Illumina sequencer (USA).
Sequence data analysis
The raw data set reads of the full processing of amplicons (fastaq files) were imported, QIIME version 2.0.Citation25 Paired-end reads were demultiplexed and featured tables were constructed by DADA2 by clustering using uclust methodCitation26 into Operational Taxonomic Units (OTUs) against the Greengenes Ribosomal Data Project (RDP) database for taxonomy assignation.Citation27 The alignment of OTU representative sequences of fecal bacteria present in the samples was done against a template of the Greengenes core reference alignment fileCitation28 using the PyNAST alignment method.Citation28 The alignment was filtered to reduce OTUs in low number, and subsequently a maximum-likelihood phylogenetic tree using FastTree building method.Citation28
Community diversity analysis was performed in QIIME2.Citation25 In alpha diversity calculations it was used Shannon index (quantitative community richness), Observed OTUs (qualitative community richness) and Faith’s Phylogenetic Diversity (qualitative community richness with phylogenetic relationships)Citation29 and Pielou´s evenness (to evaluate equitability). Beta diversity analysis was performed to evaluate dissimilarities in microbial communities between groups using Jaccard distance (qualitative community dissimilarity),Citation30 Bray–Curtis distance (quantitative community dissimilarity), unweighted UniFrac distance (qualitative community with phylogenetic relationships) and weighted UniFrac distance (quantitative community dissimilarity with phylogenetic relationships).Citation31 The raw sequences obtained were demultiplexed and uploaded to the European Nucleotide Archive (ENA) with the accession numbers ERR2672822 to ERR26779.
Statistical analysis
Descriptive statistics were used for categorical variables as frequencies and percentages. Central tendency and their respective dispersion measures were applied for continuous variables. Chi-square was calculated for hypothesis tests between categorical variables. T-test or ANOVA was applied to test hypothesis between categorical and continuous variables. Mann–Whitney U and Kruskal Wallis tests were used when there were non-normal distribution data. Sample composition was compared in the context of categorical metadata using PERMANOVA. Additionally, analysis of composition of microbiomes (ANCOM)Citation32 was used to compare between microbial communities and differential abundance of taxa was performed using Gneiss.Citation31 To adjust for multiple comparison for clinical parameters, the method of Benjamini Hochberg was used.Citation33 Adjusted p values ≤0.05 were considered statistically significant.
Results
In order to establish an unequivocal diagnosis of autism as well as the absence of the condition, certified psychologists assessed participating children with the ADI-R (Autism Diagnostic Interview-Revised) and SCQ (Social communication questioner) questionnaires (). Sixty children fulfilled study criteria (cases n = 25, controls n = 35). Children with autism (cases) and their neurotypical controls were similar in age, gender and shared similar geographic residency and the school of attendance. Family income was greater for families of control children, but there was no difference in the parent’s level of education between cases and controls ().
Table 1. Socioeconomic characteristics and early life history of children with autism and neurotypical controls.
In the context of the present work, it was important to compare critical events for the establishment of intestinal microbiota between children with ASD and controls. The use of antibiotics during pregnancy was greater in mothers of children with autism than in controls, although the differences were not statistically significant (). Also, children with ASD were more likely to be delivered by Cesarean section compared to unaffected controls, and the difference was statistically significant. Cases and controls were no more or less likely to be breastfed, and there was no difference in duration.
Nutritional status and blood biochemical parameters
Mean anthropometric parameters of height (132.9 ± 17.7 vs 129.5 ± 16.0 cm, p = .44) and weight (33.3 ± 13.1 vs 29.8 ± 10.3 Kg, p = .254) were similar between cases and controls. However, using z score for BMI-for-age and sex as an indicator of nutritional status, 24% of ASD cases had some level of malnutrition, 8% were underweight, and 16% were overweight/obese, while in the control group only 5.9% of children were overweight (). The serum lipid profile (total cholesterol, LDL, HDL and TG) and glucose were within the normal range in both groups of children with no statistical differences in the mean concentrations between cases and controls (). Also, blood cell counts were within the normal range in both groups of children (not shown).
Table 2. Comparison of BMI and blood biochemical parameters between children with autism and neurotypical controls.
Food intake characteristics and gastrointestinal symptoms
The mean consumption of selected macro- and micro-nutrients in children with ASD and controls is summarized in (). All children consumed less calories, fiber, vitamins E and D, folate, calcium and iodine than the age-specific U.S. Dietary Reference Intakes (DRI). In contrast, both groups consumed greater amounts of carbohydrate, protein, niacin, cobalamin, vitamin C and sodium than the DRI. Children in the control group consumed significantly more monounsaturated fatty acids (MUFA) and folate than ASD children, while children with ASD consumed more vitamin C than controls (). However, in a logistic regression model that considered family income and nutrient intake including MUFAs, folate and vitamin C, the observed differences in the univariate analysis were no longer significant. Regarding food habits and gastrointestinal symptomatology, children with ASD displayed more food aversions, food intolerances, constipation and food-related altered behavior than controls; the frequency of diarrhea was similar in both groups ().
Table 3. Mean intake of nutrients of children with autism and neurotypical controls.
Table 4. Food habits and gastrointestinal symptomatology of children with autism and neurotypical controls.
Cytokine profiles
The serum concentrations of interleukin (IL)-1β and IL-4 were below the detection limit in more than 65% of samples in both groups and were not included in the analysis; however, serum concentrations of IL-6, interferon (IFN)-γ, transforming growth factor (TGF)-β1, and monocyte chemoattractant protein (MCP)-1 are shown in (). Serum concentrations of TGF-β1 were significantly greater in children with ASD than in the control group; while IL-6 (MCP)-1 and IFN-γ levels were not significantly different between cases and controls. It is important to note that ASD children had much greater serum concentrations of IFN-♥ than controls however the difference did not reach statistical significance, p = .059 (). No significant differences were observed in the concentration of serum anti-transglutaminase (case:4.2 ± 7.8 vs control: 4.0 ± 5.4 IgA U/mL).
Table 5. Comparison of serum cytokine concentrations of children with autism and neurotypical controls.
Microbiome analysis
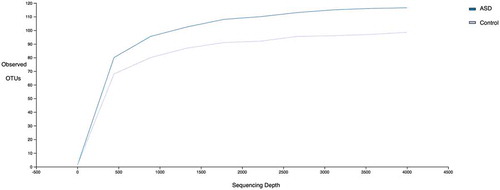
A total of 910132 sequences were included in the analysis after quality (34 quality score on the median) and length trimming (minimum of 150 bp), with an average of 15692 sequences per sample. Alpha diversity was greater in the microbiota of children with ASD children compared with neurotypical controls (Shannon and Faith’s Phylogenetic Diversity indices (t-test P <.001)) (). However, alpha diversity did not differ by age, BMI, food supplement intake, constipation, diarrhea, fat or fiber intake, or micronutrient consumption.
Figure 1. Alpha Diversity comparison of observed OTUs between ASD and control children. Numbers of observed OTUs on the Y axis and multiple rarefied sequences depth on the X axis. Statistical differences using t-test (P<0.001).
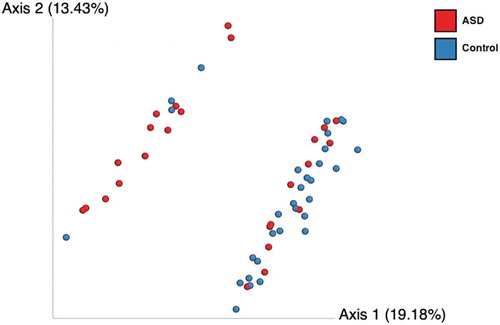
Beta diversity was significantly different between cases and controls (Bray–Curtis (P < .001), unweighted and weighted UniFrac (). Whether a child was diagnosed with ASD described up to 32% of the variance in microbial community structure. The presence/absence of OTUs and phylogenetic relationships were important in identifying differences between the groups based on unweighted UNIFRAC analysis. Beta diversity did not differ for age, BMI, food supplement intake, constipation, diarrhea, fat or fiber intake, or micronutrients consumption.
Figure 2. Beta diversity comparison between ASD (red dots) and control children (blue dots) using unweighted UNIFRAC bi-dimensional plot. Statistical differences using MANOVA (P<0.001).
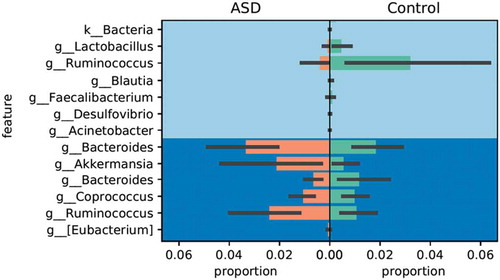
The analysis of composition of microbiomes (ANCOM) after false discover rate correction was used to determine which specific taxa presented significantly different W statistics and F-scores and those were further compared with Gneiss. OTUs assigned to the genera Lactobacillus and Ruminococcus were significantly enriched in controls, while OTUs assigned to Bacteroides (2 OTUs), Akkermansia, Coprococcus and a different Ruminococcus were significantly enriched in the ASD group ().
Figure 3. Relative abundance comparison using Gneiss metrics of statistically significant OTUs. Orange bars represent the higher abundant OTUs (including their taxonomic assignation) on the ASD group whilst green bars show the most abundant on the control group. Standard deviation bars are showed.
Discussion
In this case-control study, we demonstrated nutritional, immunological and microbiome differences between children with ASD and neurotypical controls in a geographically- and ethnically novel cohort. The prevalence of malnutrition, as defined by being under or overweight, was higher in children with ASD. Nutritional differences were accompanied by abnormal food habits and more frequent gastrointestinal symptomatology in ASD children. We also observed significantly greater serum levels of TGF-β1 in children with ASD. Finally, there were differences in intestinal microbiota composition between cases and control children distinguished by greater alpha diversity and enrichment in the abundance of Bacteroides (2 OTUs), Akkermansia, Coprococcus and a different Ruminococcus in ASD children.
A higher prevalence of overweight or obese children with ASD were observed, which has been reported previously.Citation1,Citation11 In a group of 111 children with autism between 2- and 9-years-of-age, approximately 40% had malnutrition, 8.1% were undernourished, and 31.5% were overweight or obese.Citation34 We found that 24% of children with ASD had malnutrition, 8% were undernourished, and 16% were overweight or obese, while neither obesity nor undernourishment was observed in our control population. Therefore, we have validated that a greater frequency of excess body weight among children with ASD is routinely observed.
Both deficient and excessive macro- and micronutrient intake has also been associated with autism regardless of the nutritional status of the studied populations. Nutrient intake in children with ASD (n = 46) and typically developing children (n = 31) in the United States showed that children with ASD consumed reduced carbohydrate, protein, calcium, iron, vitamin D and zinc, but greater amounts of vitamin B6 and E compared to unaffected children.Citation35 In that study, a considerable number of children in both groups did not meet RDIs for fiber, calcium, iron, vitamins E and D.Citation35 Similarly, we show that neither group of children met the DRI for total calories; fiber; vitamins E, D, folate; calcium and iodine, but exceeded the RDI for carbohydrates; protein; niacin; vitamin B12, vitamin C and sodium. We did not observe many differences in nutrient intake between the groups, except that neurotypical children consumed greater amounts of MUFA and folate than ASD children, while children with ASD had higher vitamin C intake. Although in an adjusted logistic regression model these differences were no longer significant. It seems that there are common nutritional patterns of food intake between ASD and neurotypical children irrespective of country and ethnicity, most of them do not consume the DRIs for most nutrients. The differences in nutrient intake between ASD and their controls are mainly related to lower intake of fiber, calcium, iron, sodium, vitamins B1, E and D.Citation1
It is possible that the observed nutritional abnormalities could be due to particular habits present in children with ASD and/or due to the intestinal dysbiosis observed in this condition (see below discussion on dysbiosis). In children with ASD particular dietary patterns have been associated with specific microbiota composition and volatile fatty acids concentrations.Citation36 Similar to other reports (reviewed inCitation37), we found that children with ASD presented more food aversions, intolerance to foods, constipation and depression related with gastrointestinal problems. Altered nutritional habits in ASD can put the children at risk for nutritional deficiencies or excess consumption of defined nutrients. It is necessary to guarantee a varied nutrient intake and to control eating behavior during meals as a regular routine for individuals with ASD, and for all children in general.
Altered immune responses, including increased concentration of pro-inflammatory cytokines, have been identified in children with ASD. Studies show that children with ASD present lower number of lymphocytes with decreased T cell responses to mitogens, autoimmunity and a greater Th1 cytokine response, although studies are not conclusive.Citation18,Citation38 Studies indicate the presence of an inflammatory profile in ASD, characterized by increased concentrations of inflammatory and decreased anti-inflammatory cytokines in serum and other tissues.Citation18 Suzuki et al. have reported increased serum concentrations of IL-1β, IL-1RA, IL-5, IL-8, IL-12 (p 70), and GRO-α in individuals with ASD than in matched controls.Citation39 However, in a longitudinal study, Pardo and colleagues failed to demonstrate differences in serum inflammatory markers (IL-6, TNF-α, IL-1β) in individuals with autism (n = 104) and typically developing controls (n = 54).Citation40 Similar results were found when immunological markers were assessed in cerebrospinal fluid (CSF) and the authors indicate that there were limited correspondence between blood and CSF cytokine profiles. They concluded that peripheral markers may not reflect the immune status of the central nervous system.Citation40 In the present study, concentrations of IL-1β and IL-4 were below the detection limit in the majority of serum samples of both studied groups. No differences in serum IL-6, IFN-γ and MCP-1 concentrations levels between cases and controls were observed in the current study; although there was a tendency to find greater concentrations of IFN-γ in the serum of children with ASD than in control children. In contrast, serum concentrations of TGF-β1 were significantly greater in children with ASD than in the control group. A previous study of ASD children and their neurotypical controls (n = 20 for each group) with a mean age of 10.7 years found no differences in serum concentrations of IL-6, TFN-α, IFN-α and β between cases and controls; however, the author reported greater serum concentrations of IL-12 and IFN-γ in ASD children.Citation41 Increased concentrations of IFN-γ and other inflammatory cytokines like TNF-α, IL-6 and GM-CSF have also been reported in postmortem brain samples of individuals with autism.Citation42
Our results showed greater serum concentrations of TGF-β1 in children with ASD compared to controls. Increased concentrations of TGF-β1 and MCP-1 have been observed in autopsy brain tissues, cerebral cortex, white matter and cerebellum, of individuals with ASD.Citation43 Increased levels of TGF-β1 in serum and brain could be related to the pathogenesis of ASD. However, other studies reported lower serum TGF-β1 concentration in children with ASD (n = 75) than in controls (n = 96) median age 3.4 years from United States (USA).Citation44 Similar results were reported in a group of Japanese adults with autism, median age 23 years.Citation45 It is necessary to further study the immunological status in ASD considering the natural course of this condition in individuals with different ages, ethnicities and geographic locations.
A common denominator that could explain behavior, nutritional and immune status in ASD children is the composition of the intestinal microbiota. In this study, alpha diversity indices were significantly greater in ASD children compared with controls. A study with similar design in Italy with children aged 4 to 10 years also found increased alpha diversity in ASD children compared with controls.Citation46 Similarly, in agreement with our study, beta diversity of ASD children in the Italian study were significantly different compared with controls.Citation46 Contrary to present results, a study conducted in the USA with ASD (n = 20) and control (n = 20) children aged 3 − 16 years, found a less diverse gut microbial composition among autistic children.Citation47 The discrepancies observed between present results and the USA study could be due to different characteristics of study populations; in the USA study, participating children frequently consumed gluten and casein-free diets, nutritional supplements and probiotics whereas in our study these factors were not present, children in the Italian study did not consume probiotics either;Citation46 also, in the present study participating children had a lower age range, and cases and controls were matched by age, gender and school geographic location.
In this study, ASD children were depauperate for bacteria commonly associated with fermentation, e.g., Lactobacillus, Ruminococcus and Desulfovibrio; and a significant enrichment of Bacteroides, Akkermansia and Coprococcus similar to previous studies.Citation46,Citation48 The importance of fermentation prone taxa has been demonstrated in a study of microbiota transfer therapy (MTT) in 18 ASD-diagnosed children who showed improved gastrointestinal symptoms and behavior; which was associated with an increased global bacterial diversity and the abundance of Bifidobacterium, Prevotella and Desulfovibrio after MTT.Citation49 The greater abundance of Bacteroides and Clostridium has been associated with increased intestinal permeability and a systemic inflammatory response.Citation50 Alterations of microbiota in ASD children have been associated with increased frequency of cesarean section delivery, aversion and intolerance for some foods, gastrointestinal symptoms and use of antibiotics during pregnancy.Citation1,Citation6 However, in the present study, individual analysis of these factors showed no significant difference in these variables, suggesting that they did not influence the observed differences in the microbiota of cases and controls.
The results of this study support the contention that there are differences in gut microbiota, immune-response, nutritional status and food eating behavior between children with ASD and neurotypical controls.
Disclosure of Potential Conflicts of Interest
No potential conflicts of interest were disclosed.
Competing interests
The authors declare that they have no competing interests.
The human subjects Protection Committee at Universidad de Las Américas approved the study. Parents and children signed an Informed Consent form after receiving a full explanation of the research protocol to be included in the study. Parents completed socio-demographic and medical history questionnaires for their children.
Availability of data and materials
All data generated or analyzed during this study are included in this published article and its supplementary information files. The raw sequences obtained were demultiplexed and uploaded to the European Nucleotide Archive (ENA) with the accession numbers ERR2672822 to ERR26779. The raw data supporting the conclusions of this manuscript will be made available by the authors, without undue reservation to any qualified researcher.
Additional information
Funding
References
- Berding K, Donovan SM. Microbiome and nutrition in autism spectrum disorder: current knowledge and research needs. Nutr Rev. 2016;74(12):723–736. doi:10.1093/nutrit/nuw048.
- Hertz-Picciotto I, Schmidt RJ, Krakowiak P. Understanding environmental contributions to autism: causal concepts and the state of science. Autism Res. 2018;11(4):554–586. doi:10.1002/aur.1938.
- Dekkers LMS, Groot NA, Díaz Mosquera EN, Andrade Zúñiga IP, Delfos MF. Prevalence of autism spectrum disorders in Ecuador: a pilot study in Quito. J Autism Dev Disord. 2015;45(12):4165–4173. doi:10.1007/s10803-015-2559-6.
- Centers for Disease Control and Prevention. 2018. Data and statistics | autism spectrum disorder (ASD). [accessed 2018 May 4]. https://www.cdc.gov/ncbddd/autism/data.html
- Baio J, Wiggins L, Christensen DL, Maenner MJ, Daniels J, Warren Z, … Dowling NF. Prevalence of autism spectrum disorder among children aged 8 years — autism and developmental disabilities monitoring network, 11 sites, United States, 2014. MMWR Surveillance Summaries. 2018;67(6):1–23. doi:10.15585/mmwr.ss6706a1.
- Angelidou A, Asadi S, Alysandratos K-D, Karagkouni A, Kourembanas S, Theoharides TC. Perinatal stress, brain inflammation and risk of autism-review and proposal. BMC Pediatr. 2012;12:89. doi:10.1186/1471-2431-12-89.
- Finegold SM, Dowd SE, Gontcharova V, Liu C, Henley KE, Wolcott RD, … Green JA. Pyrosequencing study of fecal microflora of autistic and control children. Anaerobe. 2010;16(4):444–453. doi:10.1016/j.anaerobe.2010.06.008.
- Gilbert JA, Blaser MJ, Caporaso JG, Jansson JK, Lynch SV, Knight R. Current understanding of the human microbiome. Nat Med. 2018;24(4):392–400. doi:10.1038/nm.4517.
- Parracho HMRT, Bingham MO, Gibson GR, McCartney AL. Differences between the gut microflora of children with autistic spectrum disorders and that of healthy children. J Med Microbiol. 2005;54(Pt 10):987–991. doi:10.1099/jmm.0.46101-0.
- Goyal MS, Venkatesh S, Milbrandt J, Gordon JI, Raichle ME. Feeding the brain and nurturing the mind: linking nutrition and the gut microbiota to brain development. Proc Natl Acad Sci. 2015;112(46):14105–14112. doi:10.1073/pnas.1511465112.
- Shmaya Y, Eilat-Adar S, Leitner Y, Reif S, Gabis L. Nutritional deficiencies and overweight prevalence among children with autism spectrum disorder. Res Dev Disabil. 2015;38:1–6. doi:10.1016/j.ridd.2014.11.020.
- Ranjan S, Nasser JA. Nutritional status of individuals with autism spectrum disorders: do we know enough? Adv Nutr. 2015;6(4):397–407. doi:10.3945/an.114.007914.
- Kohane IS, McMurry A, Weber G, MacFadden D, Rappaport L, Kunkel L, … Churchill S. The co-morbidity burden of children and young adults with autism spectrum disorders. PLoS One. 2012;7(4):e33224. doi:10.1371/journal.pone.0033224.
- Bresnahan M, Hornig M, Schultz AF, Gunnes N, Hirtz D, Lie KK, … Lipkin WI. Association of maternal report of infant and toddler gastrointestinal symptoms with autism: evidence from a prospective birth cohort. JAMA Psychiatry. 2015;72(5):466–474. doi:10.1001/jamapsychiatry.2014.3034.
- Vuong HE, Hsiao EY. Emerging roles for the gut microbiome in autism spectrum disorder. Biol Psychiatry. 2017;81(5):411–423. doi:10.1016/j.biopsych.2016.08.024.
- Estes ML, McAllister AK. Immune mediators in the brain and peripheral tissues in autism spectrum disorder. Nat Rev Neurosci. 2015;16(8):469–486. doi:10.1038/nrn3978.
- Jyonouchi H, Sun S, Le H. Proinflammatory and regulatory cytokine production associated with innate and adaptive immune responses in children with autism spectrum disorders and developmental regression. J Neuroimmunol. 2001;120(1–2):170–179. http://www.ncbi.nlm.nih.gov/pubmed/11694332.
- Xu N, Li X, Zhong Y. Inflammatory cytokines: potential biomarkers of immunologic dysfunction in autism spectrum disorders. Mediators Inflamm. 2015;2015:1–10. doi:10.1155/2015/531518.
- Parr JR, Le Couteur A, Baird G, Rutter M, Pickles A, Fombonne E, and International Molecular Genetic Study of Autism Consortium (IMGSAC) Members. Early developmental regression in autism spectrum disorder: evidence from an international multiplex sample. J Autism Dev Disord. 2011;41(3):332–340. doi:10.1007/s10803-010-1055-2.
- Rutter M, Bailey A, Lord C. 2003. Manual the social communication questionnaire. [accessed 2018 May 7]. https://www.wpspublish.com/store/Images/Downloads/Product/SCQ_Manual_Chapter_1.pdf
- Guevara DA, Reyes S, López M, Flores N, Aguirre S, Muñoz EB, … Baldeón ME. Impact of milk based micronutrient supplementation in school children in Quito-Ecuador. Nutricion Hospitalaria. 2017;35(1):50–58. http://www.ncbi.nlm.nih.gov/pubmed/29565149
- World Health Organization. 2009. WHO anthroplus for personal computers manual software for assessing growth of the world’s children and adolescents. [accessed 2018 May 4]. http://www.who.int/growthref/tools/who_anthroplus_manual.pdf
- Baldeón ME, Castro J, Villacrés E, Narváez L, Fornasini M. Hypoglycemic effect of cooked lupinus mutabilis and its purified alkaloids in subjects with type-2 diabetes. Nutricion Hospitalaria. 2012;27:4. doi:10.3305/nh.2012.27.4.5761.
- USDA Nutrient Data Laboratory and the Food and Nutrition Information Center and Information Systems Division of the National Agricultural Library. 2018. USDA food composition database. [accessed 2018 May 4]. https://ndb.nal.usda.gov/ndb/
- Caporaso JG, Kuczynski J, Stombaugh J, Bittinger K, Bushman FD, Costello EK, … Knight R. QIIME allows analysis of high-throughput community sequencing data. Nat Methods. 2010;7(5):335–336. doi:10.1038/nmeth.f.303.
- Edgar RC. Search and clustering orders of magnitude faster than BLAST. Bioinformatics. 2010;26(19):2460–2461. doi:10.1093/bioinformatics/btq461.
- McDonald D, Price MN, Goodrich J, Nawrocki EP, DeSantis TZ, Probst A, … Hugenholtz P. An improved Greengenes taxonomy with explicit ranks for ecological and evolutionary analyses of bacteria and archaea. Isme J. 2012;6(3):610–618. doi:10.1038/ismej.2011.139.
- DeSantis TZ, Hugenholtz P, Keller K, Brodie EL, Larsen N, Piceno YM, … Andersen GL. NAST: a multiple sequence alignment server for comparative analysis of 16S rRNA genes. Nucleic Acids Res. 2006;34(WebServer issue):W394–9. doi:10.1093/nar/gkl244.
- Faith DP, Baker AM. Phylogenetic diversity (PD) and biodiversity conservation: some bioinformatics challenges. Evol Bioinform Online. 2007;2:121–128. http://www.ncbi.nlm.nih.gov/pubmed/19455206.
- Jaccard P. Étude comparative de la distribution florale dans une portion des Alpes et des Jura. Bull Del La Sociéte Vaudoise Des Sci Nat. 1901;37:547–579.
- Everard A, Belzer C, Geurts L, Ouwerkerk JP, Druart C, Bindels LB, … Cani PD. Cross-talk between Akkermansia muciniphila and intestinal epithelium controls diet-induced obesity. Proc Natl Acad Sci USA. 2013;110(22):9066–9071. doi:10.1073/pnas.1219451110.
- Mandal S, Van Treuren W, White RA, Eggesbø M, Knight R, Peddada SD. Analysis of composition of microbiomes: a novel method for studying microbial composition. Microb Ecol Health Dis. 2015;26:27663. http://www.ncbi.nlm.nih.gov/pubmed/26028277.
- Benjamini Y, Hochberg Y. Controlling the false discovery rate: a practical and powerful approach to multiple testing. J R Stat Soc. 1995. WileyRoyal Statistical Society. doi:10.2307/2346101.
- Vezzani A, Viviani B. Neuromodulatory properties of inflammatory cytokines and their impact on neuronal excitability. Neuropharmacology. 2015;96(Pt A):70–82. doi:10.1016/j.neuropharm.2014.10.027.
- Herndon AC, DiGuiseppi C, Johnson SL, Leiferman J, Reynolds A. Does nutritional intake differ between children with autism spectrum disorders and children with typical development? J Autism Dev Disord. 2009;39(2):212–222. doi:10.1007/s10803-008-0606-2.
- Berding K, Donovan SM. Diet can impact microbiota composition in children with autism spectrum disorder. Front Neurosci. 2018;12:515. doi:10.3389/fnins.2018.00515.
- Marí-Bauset S, Zazpe I, Mari-Sanchis A, Llopis-González A, Morales-Suárez-Varela M. Food selectivity in autism spectrum disorders. J Child Neurol. 2014;29(11):1554–1561. doi:10.1177/0883073813498821.
- Ashwood P, Wills S, Van de Water J. The immune response in autism: a new frontier for autism research. J Leukoc Biol. 2006;80(1):1–15. doi:10.1189/jlb.1205707.
- Suzuki K, Matsuzaki H, Iwata K, Kameno Y, Shimmura C, Kawai S, … Mori N. Plasma cytokine profiles in subjects with high-functioning autism spectrum disorders. PLoS One. 2011;6(5):e20470. doi:10.1371/journal.pone.0020470.
- Pardo CA, Farmer CA, Thurm A, Shebl FM, Ilieva J, Kalra S, Swedo S. Serum and cerebrospinal fluid immune mediators in children with autistic disorder: a longitudinal study. Mol Autism. 2017;8(1):1. doi:10.1186/s13229-016-0115-7.
- Singh VK. Plasma increase of interleukin-12 and interferon-gamma. Pathological significance in autism. J Neuroimmunol. 1996;66(1–2):143–145. http://www.ncbi.nlm.nih.gov/pubmed/8964908.
- Li X, Chauhan A, Sheikh AM, Patil S, Chauhan V, Li X-M, … Malik M. Elevated immune response in the brain of autistic patients. J Neuroimmunol. 2009;207(1–2):111–116. doi:10.1016/j.jneuroim.2008.12.002.
- Vargas DL, Nascimbene C, Krishnan C, Zimmerman AW, Pardo CA. Neuroglial activation and neuroinflammation in the brain of patients with autism. Ann Neurol. 2005;57(1):67–81. doi:10.1002/ana.20315.
- Ashwood P, Enstrom A, Krakowiak P, Hertz-Picciotto I, Hansen RL, Croen LA, … Van de Water J. Decreased transforming growth factor beta1 in autism: a potential link between immune dysregulation and impairment in clinical behavioral outcomes. J Neuroimmunol. 2008;204(1–2):149–153. doi:10.1016/j.jneuroim.2008.07.006.
- Okada K, Hashimoto K, Iwata Y, Nakamura K, Tsujii M, Tsuchiya KJ, … Mori N. Decreased serum levels of transforming growth factor-beta1 in patients with autism. Prog Neuropsychopharmacol Biol Psychiatry. 2007;31(1):187–190. doi:10.1016/j.pnpbp.2006.08.020.
- De Angelis M, Piccolo M, Vannini L, Siragusa S, De Giacomo A, Serrazzanetti DI, … Francavilla R. Fecal microbiota and metabolome of children with autism and pervasive developmental disorder not otherwise specified. PLoS One. 2013;8(10):e76993. doi:10.1371/journal.pone.0076993.
- Kang D-W, Park JG, Ilhan ZE, Wallstrom G, Labaer J, Adams JB, Krajmalnik-Brown R. Reduced incidence of Prevotella and other fermenters in intestinal microflora of autistic children. PLoS One. 2013;8(7):e68322. doi:10.1371/journal.pone.0068322.
- Argou-Cardozo I, Zeidán-Chuliá F. Clostridium bacteria and autism spectrum conditions: a systematic review and hypothetical contribution of environmental glyphosate levels. Med Sci (Basel, Switzerland). 2018;6(2):29. doi:10.3390/medsci6020029.
- Kang D-W, Adams JB, Gregory AC, Borody T, Chittick L, Fasano A, … Krajmalnik-Brown R. Microbiota transfer therapy alters gut ecosystem and improves gastrointestinal and autism symptoms: an open-label study. Microbiome. 2017;5(1):10. doi:10.1186/s40168-016-0225-7.
- Rose DR, Yang H, Serena G, Sturgeon C, Ma B, Careaga M, … Ashwood P. Differential immune responses and microbiota profiles in children with autism spectrum disorders and co-morbid gastrointestinal symptoms. Brain Behav Immun. 2018;70:354–368. doi:10.1016/j.bbi.2018.03.025.