
ABSTRACT
A Western diet comprising high fat, high carbohydrate, and low fiber content has been suggested to contribute to an increased prevalence of colitis. To clarify the effect of dietary cellulose (an insoluble fiber) on gut homeostasis, for 3 months mice were fed a high-cellulose diet (HCD) or a low-cellulose diet (LCD) based on the AIN-93G formulation. Histologic evaluation showed crypt atrophy and goblet cell depletion in the colons of LCD-fed mice. RNA-sequencing analysis showed a higher expression of genes associated with immune system processes, especially those of chemokines and their receptors, in the colon tissues of LCD-fed mice than in those of HCD-fed mice. The HCD was protective against dextran sodium sulfate-induced colitis in mice, while LCD exacerbated gut inflammation; however, the depletion of gut microbiota by antibiotic treatment diminished both beneficial and non-beneficial effects of the HCD and LCD on colitis, respectively. A comparative analysis of the cecal contents of mice fed the HCD or the LCD showed that the LCD did not influence the diversity of gut microbiota, but it resulted in a higher and lower abundance of Oscillibacter and Akkermansia organisms, respectively. Additionally, linoleic acid, nicotinate, and nicotinamide pathways were most affected by cellulose intake, while the levels of short-chain fatty acids were comparable in HCD- and LCD-fed mice. Finally, oral administration of Akkermansia muciniphila to LCD-fed mice elevated crypt length, increased goblet cells, and ameliorated colitis. These results suggest that dietary cellulose plays a beneficial role in maintaining gut homeostasis through the alteration of gut microbiota and metabolites.
Introduction
Diet may have a role in the modulation of microbiota, metabolome, and gut immunity and consequently colitis.Citation1 Epidemiologic and basic researchers have identified the Western diet, which is characterized by high fat, high carbohydrate, and low fiber content, as a risk factor for colitis.Citation2,Citation3 Based on these studies, dietary education is usually recommended for colitis patients, and the exclusion of Western diet by exclusive enteral nutrition has been used to induce remission in pediatric colitis patients.Citation1,Citation2
Among dietary factors, a low-fiber diet has been widely accepted as a possible risk factor for colitis. Several epidemiologic studies have reported a negative association between dietary fiber intake from fruits and vegetables and risk of Crohn’s disease.Citation4,Citation5 Diet with a high consumption of sugar and soft drinks and low consumption of vegetables was associated with risk of ulcerative colitis.Citation6 Dietary fiber, which includes polysaccharides that are not digested by host enzymes, acts as an important substrate to the microbiota and is known to have an impact on the community of microbiota and host immunity.Citation7 Dietary fiber deprivation in mice leads to the alteration of mucus-eroding microbiota, mucus layer depletion, disruption of the intestinal barrier, and lethal colitis.Citation8
Dietary fibers are classified as fermentable (i.e., soluble) and non-fermentable (i.e., insoluble) according to their fermentability.Citation9 The beneficial roles of fermentable fibers and their mechanisms have been well studied. Particularly, short-chain fatty acids (SCFAs), such as acetate, butyrate, and propionate, which are the main products fermented from soluble fiber by commensal bacteria, are thought to play a pivotal role in the maintenance of intestinal health.Citation10 SCFAs can modulate the homeostasis of regulatory T (Treg) cells, plasma B cell differentiation, and antibody production.Citation11,Citation12 Previous studies found that butyrate plays an important role in mammalian physiology, including serving as an energy source for gut epithelia and Treg generation.Citation13,Citation14 In addition, acetate can protect hosts from enteropathogenic infection.Citation15
Despite numerous studies on the influence of soluble fiber on health-associated issues, the effects of insoluble fiber have been poorly studied. Cellulose is an insoluble fiber that is resistant to mammalian enzymeCitation16 and poorly fermented by the gut bacteria of non-ruminant mammals.Citation17 Cellulose supplementation alters the composition of gut microbiota and protects against dextran sodium sulfate (DSS)-induced colitis.Citation18 Non-fermentable fiber ameliorates central nervous system-specific autoimmune disease via an increase in the abundance of long-chain fatty acids and the activation of mucosal and systemic Th2 immune responses.Citation19 Although little cellulose is fermented by mammalian gut microbiota, its consumption contributes to a change in gut microbiota composition and some physiologic effects. However, the underlying mechanism of how insoluble fiber regulates gut homeostasis remains poorly understood.
We investigated the specific role of dietary insoluble fiber on maintenance of gut homeostasis. Under a steady-state condition, a low-cellulose diet (LCD) resulted in crypt atrophy, goblet cell depletion, and up-regulation of pro-inflammatory genes in the colon. Accordingly, LCD-fed mice were more susceptible to DSS-induced colitis, while a high-cellulose diet (HCD) was protective against colitis. Notably, HCD-fed mice showed expansion of symbiotic Akkermansia and altered lipid metabolite profiles, although no significant changes in SCFA levels were apparent. We further observed that administration of A. muciniphila reversed the crypt shortening, goblet cell depletion, and susceptibility to colitis caused by LCD consumption. These results indicate that dietary cellulose is associated with the maintenance of gut homeostasis via the expansion of symbiont and related beneficial metabolites.
Material and methods
Ethics statement
All animal experiments were approved by the Institutional Animal Care and Use Committee of Asan Institute for Life Sciences (Approval No. 2017-12-107) and studies were conducted in accordance with the approved guidelines and regulations. All experiments were performed under anesthesia with a mixture of ketamine (100 mg/kg) and xylazine (20 mg/kg).
Mice and diet
Six- to eight-week-old C57BL/6 (B6) female mice were purchased from Charles River Laboratories (OrientBio). All mice were maintained under specific pathogen-free (SPF) conditions and each cage contained 3–5 mice. Mice were fed a normal chow diet (NCD) (6.0% crude fiber [Purina 5057], Purina), LCD (0.3% cellulose in AIN-93G, DooYeol Biotech), or HCD (30.0% cellulose in AIN-93G, DooYeol Biotech) (Figure S1).
Preparation of cells from the colon lamina propria and flow cytometry analysis
As described previously,Citation20 cells were isolated from colon lamina propria with 0.5 mg/mL collagenase D and 100 μg/ml DNase1 (both Sigma Aldrich). The harvested cells were stimulated with PMA (50 ng/mL, Sigma Aldrich) and ionomycin (1 μg/ml, Sigma Aldrich) in the presence of Golgiplug (BD Biosciences) for 4 h at 37°C. Cells were incubated with purified anti-mouse CD16/32 antibody (BD Biosciences), followed by staining with surface markers and the Live/Dead Cell Stain kit (Thermo Fisher). Fixation and permeabilization were performed with intracellular cytokine staining kit (BD Biosciences). The following antibodies purchased from BD Biosciences or eBioscience (San Diego, CA) were used for analysis: anti-CD45 (30-F11), anti-CD4 (RM4-5), anti-TNF-α (MP6-XT22), anti-IFN-γ (XMG1.2), and anti-Foxp3 (FJK-16s). Cell acquisition was conducted with a BD Biosciences FACSCanto II flow cytometer and data were analyzed with FlowJo software (Tree Star).
Histologic analysis
Colon was prepared using the Swiss-roll technique.Citation21 In brief, entire colons were opened longitudinally and washed with PBS. Colon tissues were then fixed in 4% paraformaldehyde (PFA) and rolled on a toothpick over the full length of the colon. After fixation in 4% PFA, colons were embedded in paraffin and stained with hematoxylin–eosin (H&E) or Periodic acid-Schiff (PAS). Crypt depth was measured using ImageJ 1.48 open source software (https://imagej.nih.gov/ij/).
Zinc colorimetric assay
PBS was added in freeze-dried cecal contents (cecal contents:PBS = 1:10). The mixture was centrifuged at 14,000 rpm for 10 min and supernatant was collected. Zinc concentration was measured using a zinc colorimetric assay kit (Biovision).
Induction of DSS colitis
Mice were administered drinking water containing 2.5% DSS (w/v) (molecular weight 36,000–50,000; MP Biomedicals) ad libitum for 7 days, followed by drinking water only for 1 day. Weight loss, rectal bleeding, and stool consistency were monitored daily. The disease activity index (DAI) was calculated based on the following parameters: weight loss (0, none; 1, 1 ~ 5%; 2, 5 ~ 10%; 3, 10 ~ 20%; 4, >20%), stool consistency (0, normal; 2, loose; 4, diarrhea), and gross bleeding (0, absent; 2, blood-tinged; 4, present).Citation22 The DAI was the average of the scores across the three parameters. Histopathologic analysis of H&E-stained tissue sections was performed by pathologists blinded to the test conditions as described previously.Citation20 The colonic mucin score was evaluated as previously described.Citation23 The mucin scores (0, no mucin; 0.5, half loss of mucin; and 1, full mucin content) were multiplied by the percentage of tissue involvement.
Real-time PCR
RNA was isolated from colon tissues using an RNeasy Mini kit (Qiagen). cDNA was synthesized with total RNA (1 μg) by SuperScriptⅡ Reverse Transcriptase and oligo (dT) primer (all from Thermo Fisher). The products were used as a template for real-time PCR using SYBR Green qPCR Master Mix (Affymetrix) and primers with the following sequences: Mt1, 5ʹ-TCACCAGATCTCGGAATGG-3ʹ and 5ʹ-AAGAACCGGAATGAATCGC-3ʹ; Mt2, 5ʹ-GCTGCATCTGCAAAGAGGCTT-3ʹ and 5ʹ- TGGAGAACGAGTCAGGGTTGTA-3ʹ; β-actin, 5ʹ- TGGAATCCTGTGGCATCCATGAAAC-3ʹ and 5ʹ- TAAAACGCAGCTCAGTAACAGTCCG-3ʹ. For detection of bacterial 16s rDNA, fecal bacterial DNA from 200 mg of feces and genomic DNA from a known amount of A. muciniphila (BAA-835, ATCC) were extracted by using DNA Stool Mini Kit (Qiagen). Ten-fold serial dilutions of A. muciniphila DNA were used for standard curve generation to quantify bacteria. Real-time PCRs were performed using 1 μl of DNA extract, SYBR Green qPCR Master Mix (Affymetrix), and primers with the following sequences: Universal bacteria 16S rDNA, 5ʹ-ACTCCTACGGGAGGCAGCAG-3ʹ and 5ʹ-ATTACCGCGGCTGCTGG-3ʹ; A. muciniphila 16S rDNA, 5ʹ- CAGCACGTGAAGGTGGGGAC-3ʹ and 5ʹ-CCTTGCGGTTGGCTTCAGAT-3ʹ. The 16S rDNA copy numbers for fecal samples were calculated by interpolating CT values in the standard curve.
Antibiotic treatment
Eight-week-old mice were treated with a mixture of vancomycin (10 mg/L), neomycin (30 mg/L), metronidazole (50 mg/L), and ampicillin (50 mg/L) in normal drinking water for 2 months.
Oral feeding of Akkermansia muciniphila
A. muciniphila (BAA-835, ATCC) were cultured on brain heart infusion medium (BD Biosciences) supplemented with 0.4% mucin (Sigma-Aldrich) and anaerobically incubated using the GasPak 100 system (BD Biosciences) at 37°C. Cultures were concentrated, suspended in anaerobic PBS, and administered to mice (8 × 10⁸ CFU per dose) every day for 4 weeks by oral Zonde needle (Fuchigami).
RNA-seq analysis
RNA was isolated from colon tissues using a mirVana miRNA isolation kit (Thermo Fisher). A library was prepared with 1 μg of total RNA for each sample using the TruSeq mRNA sample prep kit (Illumina). PolyA-selected RNA extraction, RNA fragmentation, random hexamer-primed reverse transcription, and 100-nt paired-end sequencing were performed using the HiSeq4000 platform (Illumina). The libraries were quantified using qPCR in accordance with the qPCR Quantification Protocol Guide (KAPA Library Quantification kits) and qualified using the 2100 Bioanalyzer (Agilent Technologies). RNA-seq experiments and statistical analysis were conducted by Macrogen, Inc. We pre-processed the raw reads from the sequencer to remove low quality and adapter sequence before analysis and aligned the processed reads to the Mus musculus (mm10) using HISAT v2.0.5. In total, there were 24,532 transcripts, and 16,172 genes were left after pre-processing. After alignment, StringTie v1.3.3b was used to assemble aligned reads into transcripts and to estimate their abundance. Filtered data were log2-transformed and subjected to quantile normalization. Statistical significance of the differential expression data was determined using independent t-test and fold change ≥2 in which the null hypothesis was that no difference exists among groups. All data analysis and visualization of differentially expressed genes were conducted using R 3.3.2 software (www.r-project.org). Gene-enrichment, functional annotation analysis, and pathway analysis for significant gene list were performed based on Gene Ontology and KEGG pathway.
Bacterial 16S rDNA sequencing
DNA was extracted from feces using QIAamp DNA stool mini kits (Qiagen). PCR amplification was performed using primers targeting the segment from V3 to V4 regions of the 16S rRNA gene with extracted DNA. For the bacterial amplifications, we used barcoded primers of 341F and 805R. The amplified products were purified by CleanPCR (CleanNA). Equal concentrations of purified products were pooled and short fragments (non-target products) were removed using CleanPCR. The quality and product size were assessed using a Bioanalyzer 2100 (Agilent) with a DNA 7500 chip. Mixed amplicons were sequenced at Chunlab, Inc., with the Illumina MiSeq sequencing system.
Microbiome data analysis pipeline
Processing raw reads started with quality check and filtering of low quality (< Q25) reads by Trimmomatic version 0.32 software. Nonspecific amplicons that do not encode 16S rRNA were detected by nhmmer in HMMER (software package ver. 3.2.1 with hmm profiles). Unique reads were extracted and redundant reads were clustered with the unique reads by derep_full-length command of VSEARCH. The EzBioCloud 16SrRNA database was used for taxonomic assignment using usearch_global command of VSEARCH followed by more precise pairwise alignment. Chimeric reads were filtered on reads with <97% similarity by reference-based chimeric detection using UCHIME algorithm and the non-chimeric 16S rRNA database from EzBioCloud. After chimeric filtering, reads that were not identified to the species level (with <97% similarity) in the EzBioCloud database were compiled and cluster fast command was used to perform de-novo clustering to generate additional operational taxonomic units (OTUs). Finally, OTUs with single reads (singletons) were omitted from further analysis. The secondary analysis that includes diversity calculation and biomarker discovery was conducted by in-house programs of Chunlab, Inc. A taxonomic cladogram was generated using LEfSe with a logarithmic LDA score threshold of 2. All sequences are publicly available at NCBI (BioProject ID PRJNA592599).
Global metabolome profiling
Metabolites were extracted from cecal contents using conventional liquid extraction procedures.Citation24,Citation25 In brief, 3–4 volumes of chloroform/methanol (2/1, v/v) were added to freeze-dried cecal contents and then centrifuged for 15 min. Nonpolar metabolites containing lipids were collected from the lower organic phase, and polar metabolites were collected in the upper aqueous phase. The LC-MS was equipped with Ultimate3000 (Dionex) and OrbitrapXL (Thermo Fisher). A reverse phase column (Pursuit 5; 150 × 2.0 mm) and HILIC (HILIC Plus; 100 × 2.1 mm) were used for nonpolar and polar metabolites, respectively. LC-MS analysis was conducted for each sample solution in positive and negative ion modes. Metabolite features, including m/z and retention time values, were determined using Sieve 2.2. We chose 189 metabolite features showing statistically significant changes (fold change >2 and p-value <0.05 from Mann–Whitney U test). These were identified using the METLIN database with mass accuracy of 10 ppm. Statistical analyses, including principal component analysis (PCA) and heatmap, were conducted using MetaboAnalyst 3.0. All of the metabolomics data are publicly available at Metabolomics Workbench (Project ID: PR000878).
Statistical analysis
We used Prism software (GraphPad) for the statistical analysis. Significant differences between two groups were analyzed by two-tailed unpaired t-test. Multiple groups were analyzed by one- or two-way ANOVA tests followed by Bonferroni’s post hoc test (*, P < .05; **, P < .01).
Results
Long-term LCD intake causes crypt atrophy, goblet cell depletion, and upregulation of pro-inflammatory genes in the colon under a steady-state condition
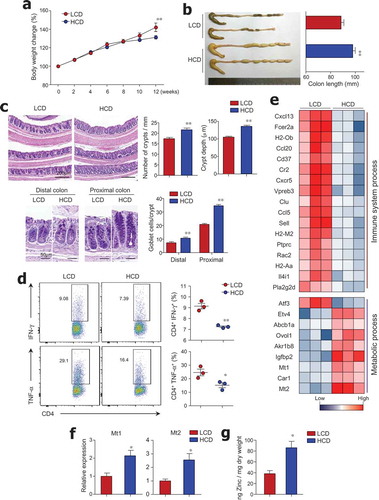
To evaluate the effect of dietary cellulose on gut homeostasis, mice were fed an LCD or HCD based on AIN-93G for 3 months. The HCD contained 300 g/kg of cellulose (an insoluble fiber), which was 100 times higher than the amount of cellulose in the LCD (Figure S1). We observed higher body weight in LCD-fed mice (), which could be attributed to differences in energy content (i.e., LCD and HCD have 4.13 and 2.96 kcal/g of diet, respectively). As reported previously,Citation26 HCD-fed mice exhibited longer colon length than LCD-fed mice (). Histological analysis revealed that the number and height of crypts in the distal colon were lower in LCD-fed mice than in HCD-fed mice (). In contrast to the previous study that demonstrated no effect of cellulose on goblet cell numbers in the jejunum,Citation27 in our study LCD-fed mice showed depletion of goblet cells in the colon (). Additionally, CD4+ T cells from colon tissues of LCD-fed mice secreted higher levels of pro-inflammatory cytokines, such as IFN-γ and TNF-α, than those of HCD-fed mice (), while the number of Foxp3+ regulatory T cells from the colon was identical in mice fed with either an LCD or HCD (data not shown). We further analyzed gene expression patterns in the colon tissues of LCD- and HCD-fed mice by RNA sequencing. Among 47 genes with a > 2-fold change in expression levels, genes related to immunological and metabolic processes were classified by Gene Ontology categories and KEGG pathway analysis (); gene networks were predicted using Ingenuity Pathway Analysis (IPA) software (Figure S2). The gene expression levels of chemokines and their receptors, such as Cxcl13, Ccl20, Cxcr5, and Ccl5, were higher in the colonic tissues of LCD-fed mice than in those of HCD-fed mice (). Several genes associated with histocompatibility class II (i.e., H2-Ob, H2-M2, and H2Aa) and with B cell activation and survival (Cr2, Fcer2a, and Cd37)Citation28–Citation30 were highly expressed in the colons of LCD-fed mice. We found that Pla2g2d (phospholipase A2), which has been implicated in the promotion of inflammation by modulating pro-inflammatory lipid mediators,Citation31 was predominantly expressed in the colons of LCD-fed mice. In contrast, genes associated with metabolic processes such as Mt1/2 (metallothionein), known as the regulator of zinc metabolism,Citation32 and Car1 (carbonic anhydrase), a zinc-dependent enzyme,Citation33 were down-regulated in colon tissues of LCD-fed mice compared with those of HCD-fed mice (,). To directly address the positive correlation of Mt and zinc, we measured zinc concentration in cecal contents. We found higher levels of zinc in HCD-fed mice than in LCD-fed mice (), suggesting that cellulose intake could affect zinc metabolism. These results indicate that LCD consumption causes crypt atrophy, goblet cell loss, increase of pro-inflammatory genes, and altered zinc metabolism in the steady-state condition.
Figure 1. Crypt atrophy and mild colitis were found in mice with low cellulose diet. (a) Six-week-old female mice were fed a low-cellulose diet (LCD) or high-cellulose diet (HCD) and body weights were monitored for 12 weeks (n = 9/group). (b) Colon lengths of both groups measured after 12 weeks of diet intake (n = 8/group). (c) H&E and PAS staining of colon tissues. Number of crypts per 1-mm length of colon, crypt depth in distal and middle colon, and number of PAS-positive goblet cells per crypt in proximal and distal colon (n = 3/group). (d) IFN-γ- and TNF-α-producing T cells in lamina propria of mouse colons analyzed by FACS (n = 3/group). (e) Heat map of differentially expressed genes in mouse colon tissue by RNA sequencing analysis (n = 3/group). Among 47 significantly changed genes (P < .05, fold change >2.0), those associated with the immunologic and metabolic processes are listed. (f) mRNA expression levels of Mt1 and Mt2 in colon (n = 5/group). (g) Zinc concentrations in freeze-dried cecal contents measured by colorimetric assay (n = 5/group). Data are representative of three independent experiments and shown as mean ± SEM. Statistical analyses were conducted using Student’s t-test or two-way ANOVA with Bonferroni’s post-hoc test. *P < .05; **P < .01.
Dietary cellulose protected mice against DSS-induced colitis
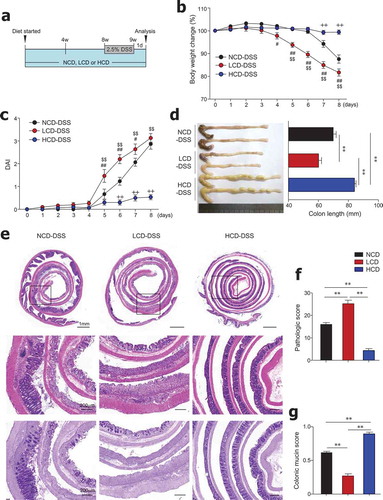
In order to determine the effect of dietary cellulose on DSS-induced colitis, after being fed HCD, LCD, or NCD for 8 weeks, mice were given DSS for 7 days (). LCD-fed mice exhibited severe body weight loss from an early time point after DSS treatment compared with mice fed the NCD or HCD (). As expected, the LCD-fed mice had significantly higher DAI and shorter colon length than the NCD- and HCD-fed mice (,). Histopathologic analysis using H&E and PAS staining revealed that the entire colon epithelium was damaged in the LCD-fed mice, while inflammation was limited to the middle and distal regions of the colon in NCD-fed mice (–). Most importantly, HCD-fed mice showed high resistance to DSS-induced colitis (–), consistent with previous studies.Citation18,Citation34 These results indicate the beneficial role of cellulose, an insoluble fiber, on the control of gut inflammation.
Figure 2. Dietary cellulose protected mice against DSS-induced colitis. (a) Scheme of diet and DSS treatment. Eight-week-old female mice were fed a normal chow diet (NCD) or LCD or HCD for 8 weeks and then DSS (2.5%) for 7 days. (b) Body weight and (c) disease activity index (DAI) scores were measured daily (n = 10/group). (d) Colon length was measured at the end of the experiment (n = 10/group). (e) Representative images of H&E- and PAS-stained sections of whole colon. Bar = 1000 μm and 200 μm. (f) Histologic scores for severity of inflammation, extent of injury, crypt damage, and colonic mucin (n = 5 ~ 8/group). (g) Mucin content in colonic crypts measured in PAS-stained slides (n = 5/group). Data are representative of two independent experiments and shown as mean ± SEM. Statistical analyses were conducted using Student’s t-test and one- or two-way ANOVA with Bonferroni’s post-hoc test. Statistical comparisons between NCD-DSS vs. HCD-DSS are represented as ++P < .01, LCD-DSS vs HCD-DSS as $$P < .01, and NCD-DSS vs. LCD-DSS as #P < .05; ##P < .01; **P < .01.
Antibiotic treatment diminished the beneficial effects of dietary cellulose on colitis
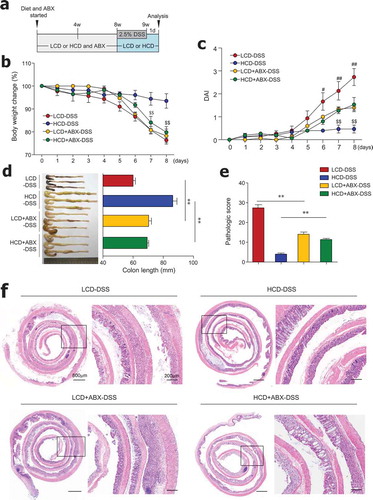
Cellulose consumption reportedly changes the composition of gut microbiota.Citation18,Citation19 For the direct examination of the role of gut microbiota, mice were fed an HCD or LCD, along with ad libitum access to antibiotics in drinking water for 8 weeks, and subsequently treated with DSS (). In the steady state, LCD-fed mice receiving antibiotics had increased crypt length and goblet cell numbers in the distal colon compared to LCD-fed mice without antibiotics (Figure S3a-S3d). In contrast, goblet cell numbers in the proximal colon were markedly reduced in HCD-fed mice receiving antibiotics compared to HCD-fed mice without antibiotics (Figure S3e). These results indicate that dietary cellulose may affect gut barrier function by influencing changes in gut microbiota. In the colitis condition, HCD-fed mice with microbiota depletion had significant body weight loss, increased DAI, and shortened colon length compared to mice fed HCD alone (–). Interestingly, mice fed LCD plus antibiotics showed significantly decreased DAI and restored colon length compared to mice fed LCD alone (,). According to histology and pathologic scores, mice fed HCD plus antibiotics exhibited more extensive areas of mucosal crypt loss and infiltration of inflammatory cells than mice fed HCD alone (,). Taken together, these results suggest that gut microbiota composition is a key factor in the maintenance of gut homeostasis by dietary cellulose.
Figure 3. Antibiotic treatment reduced colitis severity in LCD-fed mice and limited protective effects of HCD against colitis. (a) Scheme of diet, antibiotics (ABX) and DSS treatment. Mice (8-week-old females) were fed LCD or HCD plus ABX for 8 weeks and then treated with DSS for 7 days without ABX. (b) Body weight and (c) DAI during DSS treatment were monitored daily (n = 5/group). (d) Colon length measured after sacrifice (n = 5/group). (e) Pathologic scores and (f) representative images of H&E-stained colon sections (n = 5/group). Data are representative of two independent experiments and are mean ± SEM. Statistical analyses were conducted using Student’s t-test and one- or two-way ANOVA with Bonferroni’s post-hoc test. Statistical comparisons between HCD-DSS vs. HCD+ABX-DSS are presented as $P < .05 and $$P < .01. LCD-DSS vs. LCD+ABX-DSS is shown as #P < .05 and ##P < .01. **P < .01.
Cellulose intake changed the gut microbiota landscape
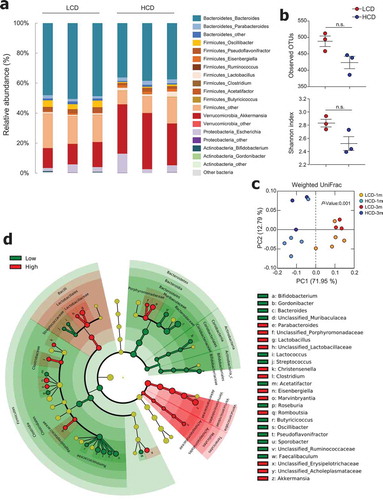
In order to determine which gut microbiota are involved in the beneficial effects of an HCD, we performed metagenomic analysis of feces from mice fed LCD and HCD for 3 months. The phylum Bacteroidetes was prevalent in approximately 50% and 40% of LCD- and HCD-fed mice, respectively ( and S4a). Bacteroides was the predominant genus among both LCD- and HCD-fed mice. Of note, the relative abundance of the genus Akkermansia was higher in HCD-fed mice than in LCD-fed mice (32.7 ± 4.8% vs. 14.6 ± 1.9%, ), and HCD-fed mice had higher levels of Akkermansia even after feeding for 1 month (38.6 ± 7.6% vs. 19.2 ± 6.4%, Figure S4a). The species level of Akkermansia showed 99% similarity to A. muciniphila by metagenome data (data not shown), which was confirmed by the species-specific primer (Figure S4b). The results of OTUs and the Shannon index showed comparable richness and diversity of microbiota in LCD-fed and HCD-fed mice ( and S4c). PCA revealed a clear segregation between the gut microbiota compositions of LCD- and HCD-fed mice after 1 and 3 months of feeding (). Of note, the abundance of Bacteroides in the phylum Bacteroidetes and Pseudoflavonifractor and Oscillibacter in the phylum Firmicutes was elevated in LCD-fed mice compared to those in HCD-fed mice (). In addition, Akkermansia in the phylum Verrucomicrobia; Parabacteroides in the phylum Bacteroidetes; and Lactobacillus, Clostridium, Eisenbergiella, Marvinnbryantia, and Romboutsia in the phylum Firmicutes were more abundant in HCD-fed mice than in LCD-fed mice (). Taken together, these results show that although high-cellulose intake did not substantially influence the diversity of microbiota, it did cause an alteration in gut microbiota composition.
Figure 4. Cellulose consumption changed gut microbiota composition. (a) Relative abundance of operational taxonomic units (OTUs) at genus levels detected by 16s rDNA sequencing in feces of mice fed LCD or HCD for 12 weeks (n = 3/group). (b) Observed OTUs and the Shannon diversity index were assessed. (c) Principal coordinate analysis (PCoA) of weighted UniFrac distances was conducted for fecal microbial communities from mice fed LCD or HCD for 4 weeks (n = 5/group) and 12 weeks (n = 3/group). (d) Cladogram, generated from LEfSe analysis, shows differentially abundant taxa of fecal microbiota (at genus level) that were enriched in LCD- and HCD-fed mice. Dot size is proportional to taxon abundance. Statistical analyses were conducted using Student’s t-test. n.s., not significant (P > .05).
Metabolic profiles were altered by dietary cellulose
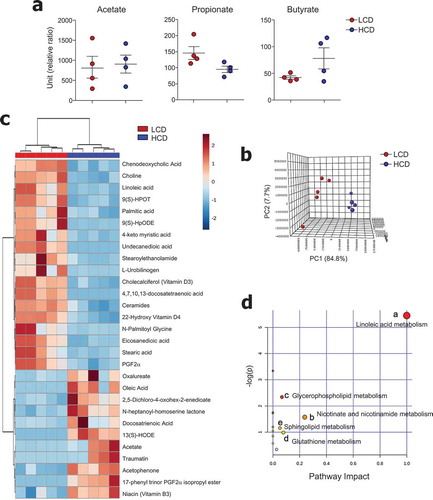
We subsequently tried to characterize microbiota-derived metabolites in both LCD- and HCD-fed mice. Because previous studies suggested that intake of insoluble fiber such as cellulose did not alter the levels of SCFAs,Citation35 we first determined the levels of SCFA in mouse cecal contents. As expected, dietary cellulose did not alter the SCFAs (i.e., acetate, propionate, and butyrate) secretion (). To investigate the effects of dietary cellulose on other metabolite profiles, we examined metabolites in the cecal contents in a non-targeted manner. Among annotated metabolites, 83 were significantly different between LCD- and HCD-fed mice (fold change ≥2, P < .05) (data not shown). The PCA plot showed a clear segregation between LCD- and HCD-fed mice (). Of note, saturated fatty acid (i.e., palmitic, 4-keto myristic, eicosanedioic, and stearic), unsaturated fatty acid (i.e., docosatetraenoic and linoleic), and ceramide levels were higher in the cecal contents of LCD-fed mice than in those of HCD-fed mice (). Furthermore, higher levels of a primary bile acid (chenodeoxycholic), glycerophospholipid (choline), and vitamin D3 and D4 derivatives were found in the cecal contents of LCD-fed mice than in those of HCD-fed mice (). In contrast, levels of docosatrienoic acid, oleic acid, and vitamin B3 were lower in LCD-fed mice than in HCD-fed mice (). The metabolic pathways affected by dietary cellulose were identified with MetaboAnalyst 4.0 software. Forty-four metabolites were identified among 83 metabolites, and the most influenced metabolic pathway was determined (i.e., those with impact values >0.05) (). The linoleic acid, nicotinate and nicotinamide, glycerophospholipid, glutathione, and sphingolipid metabolic pathways were altered by cellulose intake.
Figure 5. Metabolic profiles were altered by cellulose intake. (a) Levels of SCFA and (b-d) non-targeted metabolomics of cecal contents from LCD- and HCD-fed mice analyzed using LC-MS (n = 5/group). (b) Principal component analysis (PCA) plot showing clustering between groups. (c) Differentially enriched metabolites were selected and clustered in a heatmap. (d) Pathway analysis summary of significant changes in metabolite levels between LCD- and HCD-fed mice (obtained by MetaboAnalyst 4.0) shows pathway impact score from pathway topology analysis on x-axis and negative log (p-values) from pathway enrichment analysis on y-axis. Statistical analyses were conducted using Student’s t-test.
Administration of Akkermansia muciniphila ameliorated gut inflammation in lCD-fed mice
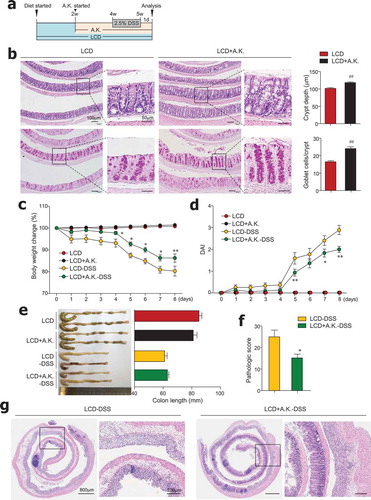
We observed that dietary cellulose contributes to an increased abundance of Akkermansia symbionts, which are known to elevate goblet cell numbers and mucus production.Citation36,Citation37 Moreover, antibiotic treatment of HCD-fed mice worsened colitis and had a positive association with decreased levels of A. muciniphila (Figure S4d). We therefore hypothesized that administration of A. muciniphila to LCD-fed mice would restore dysregulated intestinal barrier function and reduce colitis susceptibility. Thus, beginning 2 weeks after LCD feeding began, mice were given LCD with or without A. muciniphila (8 x 10⁸) every day for 3 more weeks (). We found that decreased crypt depth and goblet cell numbers caused by LCD feeding were significantly improved by administration of A. muciniphila in the steady-state condition (). Notably, administration of A. muciniphila reversed severe DSS-induced colitis in LCD-fed mice (–). Overall, symbiont A. muciniphila play a crucial role in maintenance of gut homeostasis.
Figure 6. Administration of Akkermansia muciniphila improved gut barrier and ameliorated severe colitis in LCD-fed mice. (a) Experimental design. After 2 weeks of LCD feeding, mice were treated daily with oral gavage of A. muciniphila (A.K.) or PBS for 3 weeks more. DSS treatment was started 2 weeks after A.K. administration began. (b) H&E- and PAS-stained sections of colon and quantification of crypt depth and goblet cells per crypt in distal and middle colon from LCD- and LCD+A.K.-fed mice (n = 3/group). (c) Body weight and (d) DAI scores were recorded daily during DSS treatment (n = 5/group). (e) Colon lengths were measured following sacrifice on day 8 (n = 5/group). (f) Pathologic score and (g) representative H&E-stained images of colon sections (n = 5/group). Data are representative of two independent experiments and are mean ± SEM. Statistical analyses were conducted using Student’s t-test and one- or two-way ANOVA with Bonferroni’s post-hoc test. ##P < .01. Statistical comparisons between LCD-DSS vs. LCD+A.K.-DSS are represented as *P < .05; **P < .01.
Discussion
In the present study, long-term consumption of LCD resulted in mild gut inflammation, crypt atrophy, and goblet cell depletion in the steady-state condition. Accordingly, LCD-fed mice showed a higher susceptibility to DSS-induced colitis than did HCD-fed mice. The protective role of the HCD against gut inflammation depended on the gut microbiota composition, as proved by antibiotic treatment. Further, the HCD supported expansion of symbiotic Akkermansia, which restored gut dysfunction and inflammation caused by the LCD. These results indicate that cellulose intake changes the gut microbiota landscape and subsequently ameliorates gut inflammation.
The consumption of an LCD for a relatively long period induced crypt atrophy and goblet cell depletion in the mouse colon, which suggests a potential anti–inflammatory role of dietary cellulose. In this regard, the expression levels of metabolic process-associated genes such as Mt1 and 2, which have a central function in zinc homeostasis by regulating zinc uptake, distribution, and excretion,Citation38 were higher in HCD-fed mice (,). Previously Mt was found to play a protective role in various types of inflammationCitation39 and a potential role in colitis through its anti-apoptotic and immune-modulating effects.Citation40 Moreover, zinc is involved in the proliferation and differentiation of intestinal epithelial cells.Citation41–Citation43 We observed increased zinc levels in cecal contents of HCD-fed mice (), consistent with previous studies in rats and humans.Citation44,Citation45 However, no changes were found in zinc level in the portal vein (data not shown), indicating zinc absorption was not affected. Although the exact mechanism is not known, our results suggest that high cellulose increases the amount of zinc entering the colon. Overall, the upregulation of the zinc metabolic pathway by dietary cellulose provides evidence of crypt proliferation and anti–inflammatory effects of dietary cellulose.
Although there was no significant change in the richness and diversity of gut microbiota in LCD- and HCD-fed mice, there were substantially more Akkermansia organisms in HCD-fed mice than in LCD-fed mice ( and S4). A. muciniphila, a mucin-degrading bacterium, is considered a beneficial microbe; it has a negative correlation with obesity, diabetes, and colitis.Citation46,Citation47 It is possible that A. muciniphila may reduce DSS-induced colitis either via its extracellular vesicleCitation48 or by beneficially modifying the gut microbiota community.Citation49,Citation50 Since supplementation with polyphenol-rich foods enhances mucus production and exerts prebiotic functions on A. muciniphila, the effect of polyphenols may result from providing a favorable niche for bacteria to thrive.Citation51,Citation52 Oligofructose intake also elevates goblet cell numbersCitation53 and subsequently supports the expansion of A. muciniphila.Citation54 In our study, even when gut microbiota were depleted by antibiotic treatment, crypt length and goblet cell numbers were still similar to HCD-fed mice without antibiotics (Figure S3c and S3e), indicating that dietary cellulose may directly trigger mucin secretion via goblet cell maturation. Previous studies have suggested that indigestible fiber augments crypt length, goblet cell maturation, and mucin secretion via mechanical stimulation caused by increased stool bulk.Citation55,Citation56 Hence, we speculate that dietary cellulose directly enhances mucin secretion by goblet cells and subsequently increases the numbers of mucin-degrading Akkermansia, which promote gut barrier function and ameliorate LCD-induced sensitivity to colitis.
In addition to having fewer symbionts such as A. muciniphila, LCD-fed mice had increased abundance of Ruminococcaceae and Oscillibacter (). Increased numbers of Ruminococcaceae were also found in patients with colonic Crohn’s disease.Citation57 Oscillibacter, in the family Ruminococcaceae, reportedly has a negative correlation with barrier function parameters in the colon.Citation58 Our metabolite analysis showed that LCD-fed mice had higher levels of saturated fatty acids, including palmitic, stearic, and myristic, and ceramides (), which may be crucial for pro-inflammatory signaling.Citation59 For instance, in vitro treatment of intestinal epithelial cells with palmitate-induced oxidative and ER stress contributing to a decrease in mature MUC2 secretion.Citation60 Overall, LCD consumption increases microbiota and metabolites, which could exacerbate mucosal barrier dysfunction and lead to high susceptibility to colitis.
Our results, as well as those of previous studies, show that dietary cellulose does not contribute to the production of SCFAs in mice () and rats.Citation35 We found that the metabolic pathways most influenced by cellulose intake were those of linoleic acid and nicotinate and nicotinamide metabolism (). Two types of biologically active-oxidized linoleic acid metabolites [i.e., 9(S)-HpODE and 13-HODE] were altered by cellulose feeding. The level of 9(S)-HpODE (hydroperoxyoctadecadienoic acid), a precursor of 9(S)-HODE (hydroxyoctadecadienoic acid), was higher in the cecal contents of LCD-fed mice than in those of HCD-fed mice, whereas the situation was reversed for 13(S)-HODE levels (). The two oxidized products may have opposite effects. Recent studies suggest that 9-HODE performs pro-inflammatory roles,Citation61,Citation62 whereas 13-HODE exhibits anti–inflammatory functions.Citation63,Citation64 These studies support our findings that mild inflammation in the normal colon and severe inflammation in the DSS-induced colon of LCD-fed mice might be the consequence of high 9-HODE levels. Consequently, 13-HODE might contribute to the protection against DSS-induced colitis in HCD-fed mice. Which enzymes or non-enzymatic factors drive the different types of linoleic acid oxidation processes during cellulose feeding remain to be determined.
Our present study also revealed a higher level of niacin (vitamin B3) in HCD-fed mice than in LCD-fed mice (). In previous studies, niacin was found to prevent colitis through Treg cell differentiation and IL-18 secretion in a Gpr109a-dependent mannerCitation65 as well as through prostaglandin D2 production, which could suppress colitis-induced epithelial cell apoptosis and pro-inflammatory cytokine secretion.Citation66 These results suggest that a beneficial effect of cellulose consumption may be an increase in niacin in the gut. One study reported that the colonization of A. muciniphila in germ-free mice changed the gene expression of nicotinate and nicotinamide metabolism.Citation67 Recently, Blacher et. alCitation68 found that A. muciniphila directly produces nicotinamide. Although further study is needed, nicotinamide production might be one of the mechanisms of the beneficial effect of A. muciniphila on gut barrier function.
In this study, we found that high cellulose feeding enhances mucus production by goblet cells and shows prebiotic effects on A. muciniphila (Figure S5). The results also suggest that administration of A. muciniphila may improve gut barrier function impaired by low cellulose intake, thereby ameliorating gut inflammation. Taken together, these results suggest that dietary cellulose may be a beneficial food supplement for the maintenance of gut homeostasis and treatment of colitis.
Author contributions
Y.K., S.W.H. performed study design, experimental work and wrote the manuscript; S.K. performed microbiome analysis and bacterial culture; Y.-S.L., T.-Y.K., S.-H.L. performed data acquisition; S.J.K., H.J.Y. performed metabolome analysis; E.N.K. did histological evaluation; M.-N.K. contributed to the conception and design of the study and supervised the study.
Disclosure of potential conflicts of interest
The authors declare that there are no conflicts of interest.
Supplemental Material
Download Zip (580.2 KB)Acknowledgments
We thank the Metabolomics and FACS cores at the Convergence Medicine Research Center, Asan Medical Center, for support and instrumentation.
Supplementary material
Supplemental data for this article can be accessed on the publisher’s website.
Additional information
Funding
References
- Levine A, Sigall Boneh R, Wine E. Evolving role of diet in the pathogenesis and treatment of inflammatory bowel diseases. Gut. 2018;67(9):1726–1738. doi:10.1136/gutjnl-2017-315866.
- Lewis JD, Abreu MT. Diet as a trigger or therapy for inflammatory bowel diseases. Gastroenterology. 2017;152(2):398–414. doi:10.1053/j.gastro.2016.10.019.
- Hou JK, Abraham B, El-Serag H. Dietary intake and risk of developing inflammatory bowel disease: a systematic review of the literature. Am J Gastroenterol. 2011;106(4):563–573. doi:10.1038/ajg.2011.44.
- D’Souza S, Levy E, Mack D, Israel D, Lambrette P, Ghadirian P, Deslandres C, Morgan K, Seidman EG, Amre DK, et al. Dietary patterns and risk for Crohn’s disease in children. Inflamm Bowel Dis. 2008;14(3):367–373. doi:10.1002/ibd.20333.
- Ananthakrishnan AN, Khalili H, Konijeti GG, Higuchi LM, de Silva P, Korzenik JR, Fuchs CS, Willett WC, Richter JM, Chan AT, et al. A prospective study of long-term intake of dietary fiber and risk of Crohn’s disease and ulcerative colitis. Gastroenterology. 2013;145(5):970–977. doi:10.1053/j.gastro.2013.07.050.
- Racine A, Carbonnel F, Chan SS, Hart AR, Bueno-de-Mesquita HB, Oldenburg B, van Schaik FDM, Tjønneland A, Olsen A, Dahm CC, et al. Dietary patterns and risk of inflammatory bowel disease in europe: results from the EPIC study. Inflamm Bowel Dis. 2016;22(2):345–354. doi:10.1097/mib.0000000000000638.
- Makki K, Deehan EC, Walter J, Backhed F. The impact of dietary fiber on gut microbiota in host health and disease. Cell Host Microbe. 2018;23(6):705–715. doi:10.1016/j.chom.2018.05.012.
- Desai MS, Seekatz AM, Koropatkin NM, Kamada N, Hickey CA, Wolter M, Pudlo NA, Kitamoto S, Terrapon N, Muller A, et al. A dietary fiber-deprived gut microbiota degrades the colonic mucus barrier and enhances pathogen susceptibility. Cell. 2016;167(5):1339–1353. doi:10.1016/j.cell.2016.10.043.
- Dhingra D, Michael M, Rajput H, Patil RT. Dietary fibre in foods: a review. J Food Sci Technol. 2012;49(3):255–266. doi:10.1007/s13197-011-0365-5.
- Koh A, De Vadder F, Kovatcheva-Datchary P, Backhed F. From dietary fiber to host physiology: short-chain fatty acids as key bacterial metabolites. Cell. 2016;165(6):1332–1345. doi:10.1016/j.cell.2016.05.041.
- Smith PM, Howitt MR, Panikov N, Michaud M, Gallini CA, Bohlooly YM, Glickman JN, Garrett WS. The microbial metabolites, short-chain fatty acids, regulate colonic Treg cell homeostasis. Science. 2013;341(6145):569–573. doi:10.1126/science.1241165.
- Kim M, Qie Y, Park J, Kim CH. Gut microbial metabolites fuel host antibody responses. Cell Host Microbe. 2016;20(2):202–214. doi:10.1016/j.chom.2016.07.001.
- Donohoe DR, Garge N, Zhang X, Sun W, O’Connell TM, Bunger MK, Bultman S. The microbiome and butyrate regulate energy metabolism and autophagy in the mammalian colon. Cell Metab. 2011;13(5):517–526. doi:10.1016/j.cmet.2011.02.018.
- Furusawa Y, Obata Y, Fukuda S, Endo TA, Nakato G, Takahashi D, Nakanishi Y, Uetake C, Kato K, Kato T, et al. Commensal microbe-derived butyrate induces the differentiation of colonic regulatory T cells. Nature. 2013;504(7480):446–450. doi:10.1038/nature12721.
- Fukuda S, Toh H, Hase K, Oshima K, Nakanishi Y, Yoshimura K, Tobe T, Clarke JM, Topping DL, Suzuki T, et al. Bifidobacteria can protect from enteropathogenic infection through production of acetate. Nature. 2011;469(7331):543–547. doi:10.1038/nature09646.
- Wolin MJ. Fermentation in the rumen and human large intestine. Science. 1981;213(4515):1463–1468. doi:10.1126/science.7280665.
- Holscher HD. Dietary fiber and prebiotics and the gastrointestinal microbiota. Gut Microbes. 2017;8(2):172–184. doi:10.1080/19490976.2017.1290756.
- Nagy-Szakal D, Hollister EB, Luna RA, Szigeti R, Tatevian N, Smith CW, Versalovic J, Kellermayer R. Cellulose supplementation early in life ameliorates colitis in adult mice. PLoS One. 2013;8(2):e56685. doi:10.1371/journal.pone.0056685.
- Berer K, Martinez I, Walker A, Kunkel B, Schmitt-Kopplin P, Walter J, Krishnamoorthy G. Dietary non-fermentable fiber prevents autoimmune neurological disease by changing gut metabolic and immune status. Sci Rep. 2018;8(1):10431. doi:10.1038/s41598-018-28839-3.
- Yang JY, Kim MS, Kim E, Cheon JH, Lee YS, Kim Y, Lee S-H, Seo S-U, Shin S-H, Choi S, et al. Enteric viruses ameliorate gut inflammation via toll-like receptor 3 and toll-like receptor 7-mediated interferon-β production. Immunity. 2016;44(4):889–900. doi:10.1016/j.immuni.2016.03.009.
- Moolenbeek C, Ruitenberg EJ. The “Swiss roll”: a simple technique for histological studies of the rodent intestine. Lab Anim. 1981;15(1):57–59. doi:10.1258/002367781780958577.
- Cooper HS, Murthy SN, Shah RS, Sedergran DJ. Clinicopathologic study of dextran sulfate sodium experimental murine colitis. Lab Invest. 1993;69(2):238–249. PMID: 8350599.
- Do A, Reid RC, Lohman RJ, Sweet MJ, Fairlie DP, Iyer A. An HDAC6 inhibitor confers protection and selectively inhibits B-cell infiltration in DSS-induced colitis in mice. J Pharmacol Exp Ther. 2017;360(1):140–151. doi:10.1124/jpet.116.236711.
- Folch J, Lees M, Sloane, Stanley GH. A simple method for the isolation and purification of total lipids from animal tissues. J Biol Chem. 1957;226(1):497–509. PMID: 13428781.
- Bligh EG, Dyer WJ. A rapid method of total lipid extraction and purification. Can J Biochem Physiol. 1959;37(8):911–917. doi:10.1139/o59-099.
- Stark A, Nyska A, Madar Z. Metabolic and morphometric changes in small and large intestine in rats fed high-fiber diets. Toxicol Pathol. 1996;24(2):166–171. doi:10.1177/019262339602400204.
- Vahouny GV, Le T, Ifrim I, Satchithanandam S, Cassidy MM. Stimulation of intestinal cytokinetics and mucin turnover in rats fed wheat bran or cellulose. Am J Clin Nutr. 1985;41(5):895–900. doi:10.1093/ajcn/41.5.895.
- Bohnsack JF, Cooper NR. CR2 ligands modulate human B cell activation. J Immunol. 1988;141(8):2569–2576. PMID: 2459218.
- Bonnefoy JY, Lecoanet-Henchoz S, Aubry JP, Gauchat JF, Graber P. CD23 and B-cell activation. Curr Opin Immunol. 1995;7(3):355–359. doi:10.1016/0952-7915(95)80110-3.
- van Spriel AB, de Keijzer S, van der Schaaf A, Gartlan KH, Sofi M, Light A, Linssen PC, Boezeman JB, Zuidscherwoude M, Reinieren-Beeren I, et al. The tetraspanin CD37 orchestrates the α4β1 integrin-Akt signaling axis and supports long-lived plasma cell survival. Sci Signal. 2012;5(250):ra82. doi:10.1126/scisignal.2003113.
- Leslie CC. Cytosolic phospholipase A2: physiological function and role in disease. J Lipid Res. 2015;56(8):1386–1402. doi:10.1194/jlr.R057588.
- Vasak M, Hasler DW. Metallothioneins: new functional and structural insights. Curr Opin Chem Biol. 2000;4(2):177–183. doi:10.1016/s1367-5931(00)00082-x.
- Song H, Wilson DL, Farquhar ER, Lewis EA, Emerson JP. Revisiting zinc coordination in human carbonic anhydrase II. Inorg Chem. 2012;51(20):11098–11105. doi:10.1021/ic301645j.
- Llewellyn SR, Britton GJ, Contijoch EJ, Vennaro OH, Mortha A, Colombel JF, Grinspan A, Clemente JC, Merad M, Faith JJ, et al. Interactions between diet and the intestinal microbiota alter intestinal permeability and colitis severity in mice. Gastroenterology. 2018;154(4):1037–1046. doi:10.1053/j.gastro.2017.11.030.
- den Besten G, van Eunen K, Groen AK, Venema K, Reijngoud DJ, Bakker BM. The role of short-chain fatty acids in the interplay between diet, gut microbiota, and host energy metabolism. J Lipid Res. 2013;54(9):2325–2340. doi:10.1194/jlr.R036012.
- Shin NR, Lee J-C, Lee H-Y, Kim M-S, Whon T-W, Lee M-S, Bae J-W. An increase in the Akkermansia spp. population induced by metformin treatment improves glucose homeostasis in diet-induced obese mice. Gut. 2014;63(5):727–735. doi:10.1136/gutjnl-2012-303839.
- Hanninen A, Toivonen R, Poysti S, Belzer C, Plovier H, Ouwerkerk JP, Emani R, Cani PD, De Vos WM. Akkermansia muciniphila induces gut microbiota remodelling and controls islet autoimmunity in NOD mice. Gut. 2018;67(8):1445–1453. doi:10.1136/gutjnl-2017-314508.
- Davis SR, Cousins RJ. Metallothionein expression in animals: a physiological perspective on function. J Nutr. 2000;130(5):1085–1088. doi:10.1093/jn/130.5.1085.
- Inoue K, Takano H, Shimada A, Satoh M. Metallothionein as an anti-inflammatory mediator. Mediators Inflamm. 2009;2009:101659. doi:10.1155/2009/101659.
- Waeytens A, De Vos M, Laukens D. Evidence for a potential role of metallothioneins in inflammatory bowel diseases. Mediators Inflamm. 2009;2009:729172. doi:10.1155/2009/729172.
- Cohen L, Sekler I, Hershfinkel M. The zinc sensing receptor, ZnR/GPR39, controls proliferation and differentiation of colonocytes and thereby tight junction formation in the colon. Cell Death Dis. 2014;5:e1307. doi:10.1038/cddis.2014.262.
- Duff M, Ettarh R. Crypt cell production rate in the small intestine of the zinc-supplemented mouse. Cells Tissues Organs. 2002;172(1):21–28. doi:10.1159/000064383.
- Southon S, Livesey G, Gee JM, Johnson IT. Intestinal cellular proliferation and protein synthesis in zinc-deficient rats. Br J Nutr. 1985;53(3):595–603. doi:10.1079/bjn19850069.
- Gordon DT, Besch-Williford C, Ellersieck MR. The action of cellulose on the intestinal mucosa and element absorption by the rat. J Nutr. 1983;113(12):2545–2556. doi:10.1093/jn/113.12.2545.
- Ismail-Beigi F, Reinhold JG, Faraji B, Abadi P. Effects of cellulose added to diets of low and high fiber content upon the metabolism of calcium, magnesium, zinc and phosphorus by man. J Nutr. 1977;107(4):510–518. doi:10.1093/jn/107.4.510.
- Cani PD, de Vos WM. Next-generation beneficial microbes: the case of Akkermansia muciniphila. Front Microbiol. 2017;8:1765. doi:10.3389/fmicb.2017.01765.
- Derrien M, Vaughan EE, Plugge CM, de Vos WM. Akkermansia muciniphila gen. nov., sp. nov., a human intestinal mucin-degrading bacterium. Int J Syst Evol Microbiol. 2004;54(Pt 5):1469–1476. doi:10.1099/ijs.0.02873-0.
- Kang CS, Ban M, Choi EJ, Moon HG, Jeon JS, Kim DK, Park S-K, Jeon SG, Roh T-Y, Myung S-J, et al. Extracellular vesicles derived from gut microbiota, especially Akkermansia muciniphila, protect the progression of dextran sulfate sodium-induced colitis. PLoS One. 2013;8(10):e76520. doi:10.1371/journal.pone.0076520.
- Bian X, Wu W, Yang L, Lv L, Wang Q, Li Y, Ye J, Fang D, Wu J, Jiang X, et al. Administration of Akkermansia muciniphila ameliorates dextran sulfate sodium-induced ulcerative colitis in mice. Front Microbiol. 2019;10:2259. doi:10.3389/fmicb.2019.02259.
- Png CW, Linden SK, Gilshenan KS, Zoetendal EG, McSweeney CS, Sly LI, McGuckin MA, Florin THJ. Mucolytic bacteria with increased prevalence in IBD mucosa augment in vitro utilization of mucin by other bacteria. Am J Gastroenterol. 2010;105(11):2420–2428. doi:10.1038/ajg.2010.281.
- Anhe FF, Roy D, Pilon G, Dudonne S, Matamoros S, Varin TV, Garofalo C, Moine Q, Desjardins Y, Levy E, et al. A polyphenol-rich cranberry extract protects from diet-induced obesity, insulin resistance and intestinal inflammation in association with increased Akkermansia spp. population in the gut microbiota of mice. Gut. 2015;64(6):872–883. doi:10.1136/gutjnl-2014-307142.
- Anhe FF, Varin TV, Le Barz M, Desjardins Y, Levy E, Roy D, Marette A. Gut microbiota dysbiosis in obesity-linked metabolic diseases and prebiotic potential of polyphenol-rich extracts. Curr Obes Rep. 2015;4(4):389–400. doi:10.1007/s13679-015-0172-9.
- Kleessen B, Hartmann L, Blaut M. Fructans in the diet cause alterations of intestinal mucosal architecture, released mucins and mucosa-associated bifidobacteria in gnotobiotic rats. Br J Nutr. 2003;89(5):597–606. doi:10.1079/BJN2002827.
- Everard A, Belzer C, Geurts L, Ouwerkerk JP, Druart C, Bindels LB, Guiot Y, Derrien M, Muccioli GG, Delzenne NM, et al. Cross-talk between Akkermansia muciniphila and intestinal epithelium controls diet-induced obesity. Proc Natl Acad Sci USA. 2013;110(22):9066–9071. doi:10.1073/pnas.1219451110.
- Enss ML, Schmidt-Wittig U, Honer K, Kownatzki R, Gartner K. Mechanical challenge causes alterations of rat colonic mucosa and released mucins. Alterations of mucosa and mucins. J Exp Anim Sci. 1994;36(4–5):128–140. PMID: 7948064.
- Schmidt-Wittig U, Enss ML, Coenen M, Gartner K, Hedrich HJ. Response of rat colonic mucosa to a high fiber diet. Ann Nutr Metab. 1996;40(6):343–350. doi:10.1159/000177936.
- Willing BP, Dicksved J, Halfvarson J, AF A, Lucio M, Zheng Z, Järnerot G, Tysk C, Jansson JK, Engstrand L, et al. A pyrosequencing study in twins shows that gastrointestinal microbial profiles vary with inflammatory bowel disease phenotypes. Gastroenterology. 2010;139(6):1844–1854. doi:10.1053/j.gastro.2010.08.049.
- Lam YY, Ha CW, Campbell CR, Mitchell AJ, Dinudom A, Oscarsson J, Cook DI, Hunt NH, Caterson ID, Holmes AJ, et al. Increased gut permeability and microbiota change associate with mesenteric fat inflammation and metabolic dysfunction in diet-induced obese mice. PLoS One. 2012;7(3):e34233. doi:10.1371/journal.pone.0034233.
- Haversen L, Danielsson KN, Fogelstrand L, Wiklund O. Induction of proinflammatory cytokines by long-chain saturated fatty acids in human macrophages. Atherosclerosis. 2009;202(2):382–393. doi:10.1016/j.atherosclerosis.2008.05.033.
- Gulhane M, Murray L, Lourie R, Tong H, Sheng YH, Wang R, Kang A, Schreiber V, Wong KY, Magor G, et al. High fat diets induce colonic epithelial cell stress and inflammation that is reversed by IL-22. Sci Rep. 2016;6:28990. doi:10.1038/srep28990.
- Warner DR, Liu H, Miller ME, Ramsden CE, Gao B, Feldstein AE, Schuster S, McClain CJ, Kirpich IA. Dietary linoleic acid and its oxidized metabolites exacerbate liver injury caused by ethanol via induction of hepatic proinflammatory response in mice. Am J Pathol. 2017;187(10):2232–2245. doi:10.1016/j.ajpath.2017.06.008.
- Vangaveti V, Baune BT, Kennedy RL. Hydroxyoctadecadienoic acids: novel regulators of macrophage differentiation and atherogenesis. Ther Adv Endocrinol Metab. 2010;1(2):51–60. doi:10.1177/2042018810375656.
- Yang XY, Wang LH, Mihalic K, Xiao W, Chen T, Li P, Wahl LM, Farrar WL. Interleukin (IL)-4 indirectly suppresses IL-2 production by human T lymphocytes via peroxisome proliferator-activated receptor gamma activated by macrophage-derived 12/15-lipoxygenase ligands. J Biol Chem. 2002;277(6):3973–3978. doi:10.1074/jbc.M105619200.
- Altmann R, Hausmann M, Spottl T, Gruber M, Bull AW, Menzel K, Vogl D, Herfarth H, Schölmerich J, Falk W, et al. 13-Oxo-ODE is an endogenous ligand for PPARγ in human colonic epithelial cells. Biochem Pharmacol. 2007;74(4):612–622. doi:10.1016/j.bcp.2007.05.027.
- Singh N, Gurav A, Sivaprakasam S, Brady E, Padia R, Shi H, Thangaraju M, Prasad P, Manicassamy S, Munn D, et al. Activation of Gpr109a, receptor for niacin and the commensal metabolite butyrate, suppresses colonic inflammation and carcinogenesis. Immunity. 2014;40(1):128–139. doi:10.1016/j.immuni.2013.12.007.
- Li J, Kong D, Wang Q, Wu W, Tang Y, Bai T, Guo L, Wei L, Zhang Q, Yu Y, et al. Niacin ameliorates ulcerative colitis via prostaglandin D2-mediated D prostanoid receptor 1 activation. EMBO Mol Med. 2017;9(5):571–588. doi:10.15252/emmm.201606987.
- Derrien M, Van Baarlen P, Hooiveld G, Norin E, Muller M, de Vos WM. Modulation of mucosal immune response, tolerance, and proliferation in mice colonized by the mucin-degrader Akkermansia muciniphila. Front Microbiol. 2011;2:166. doi:10.3389/fmicb.2011.00166.
- Blacher E, Bashiardes S, Shapiro H, Rothschild D, Mor U, Dori-Bachash M, Kleimeyer C, Moresi C, Harnik Y, Zur M, et al. Potential roles of gut microbiome and metabolites in modulating ALS in mice. Nature. 2019;572(7770):474–480. doi:10.1038/s41586-019-1443-5.