
ABSTRACT
Alcohol can potentiate disease in a mouse model of dextran sodium sulfate (DSS) colitis; however, the underlying mechanism remains to be established. In this study, we assessed whether the potentiated disease could be related to Enterobacteriaceae and Lactobacillus, as changes in their relative abundance can impact intestinal health. We also assessed whether the intestinal barrier is compromised after alcohol and DSS as it may increase bacterial translocation and liver inflammation. Mice were administered DSS followed by binge ethanol or water vehicle, generating four experimental groups: (Control+Vehicle, Control+Ethanol, DSS+Vehicle, DSS+Ethanol). DNA was isolated from colon and cecal contents followed by qPCR for levels of Enterobacteriaceae and Lactobacillus. Colon and liver sections were taken for histology. Intestinal epithelial cells were isolated from the colon for RNA expression. DSS+Ethanol cecal contents exhibited a 1 log increase in Enterobacteriaceae (p < .05), a 0.5 log decrease in Lactobacillus, and a 1.5 log decrease (p < .05) in the Lactobacillus:Enterobacteriaceae ratio compared to DSS+Vehicle, with similar trends in colon contents. These changes correlated with shorter colons and more weight loss. Irrespective of ethanol administration, DSS compromised the mucosal barrier integrity, however only DSS+Ethanol exhibited significant increases in circulating endotoxin. Furthermore, the livers of DSS+Ethanol mice had significantly increased levels of triglycerides, mononuclear cells, yet exhibited significantly depressed expression of liver inflammatory pathways, suggestive of tolerance induction, compared to mice receiving DSS+Vehicle. Our results suggest that ethanol after DSS colitis increases the intestinal burden of Enterobacteriaceae which may contribute to intestinal and liver damage, and the induction of immune tolerance.
Introduction
Inflammatory bowel diseases (IBD) are highly prevalent within the United States, affecting 1.5 million individuals.Citation1 The incidence of IBD in other countries is also increasing rapidly.Citation1 There are two main forms of IBD: Crohn’s disease (CD), which produces discontinuous lesions throughout the gastrointestinal tract, and ulcerative colitis (UC), which produces a continuous mucosal lesion that is localized to the colon.Citation2 The onset of disease in both CD and UC follows a similar course, whereby patients experience intense abdominal pain, diarrhea, and bloody stools. While the etiology of the disease is not fully understood, studies suggest that genetic, environmental, and microbial factors can contribute to the disease onset.Citation3 After the initial onset of disease, individuals with IBD experience cycles of active disease followed by quiescent periods. With regard to UC, the flares in disease are frequent, with 80% of UC patients experiencing a relapse within 2 years of entering remission.Citation4 No cure is available, thus maintenance of remission and preventing flares is the current mainstay of treatment. What leads to a flare in the disease is not entirely defined but lifestyle and dietary factors,Citation3 such as alcohol,Citation5 have been implicated. Studies examining IBD patients have found that alcohol consumption is associated with worsening of gastrointestinal symptoms,Citation6,Citation7 induction of flare,Citation8 and increased intestinal infections.Citation9 These effects may arise from alcohol’s ability to alter the intestinal microbiota,Citation10–14 which would negatively impact the already altered intestinal microbiome of IBD patients.Citation15–17 In particular, alcohol consumption and IBD are independently characterized by intestinal decreases of the Lactobacillus genus,Citation18,Citation19 and increases of the Enterobacteriaceae family.Citation14–18,Citation20 The observed increase in Enterobacteriaceae is relevant because they can penetrate the mucus layer of intestines in UC patients,Citation15,Citation16,Citation21 and express pro-inflammatory endotoxin.
Murine colitis models show that Enterobacteriaceae penetration occurs before the onset of intestinal tissue damage.Citation22,Citation23 A decrease in lactobacilli may further compound this effect since they promote intestinal health and also check the growth of Enterobacteriaceae.Citation24–27 Studies have determined that the intestinal ratio of these two bacteria can be an indicator of gut health,Citation28,Citation29 and thus, changes in their relative abundance may disrupt the normal gut homeostasis. This may allow for leakage of gut bacteria and/or their products into systemic circulation, which have been implicated as causal agents of liver inflammation and damage.Citation30–32 IBD patients experience higher levels of liver steatosis and altered liver enzymes,Citation33,Citation34 which may in part be explained by a combination of increased bacterial translocation and increased Enterobacteriaceae load. Using a mouse model of DSS-induced colitis, we explored the effect of ethanol on intestinal levels of Enterobacteriaceae and lactobacilli within the context of colitis severity and liver changes.
Results
Alcohol after DSS colitis increases Enterobacteriaceae and decreases Lactobacillus in colon and cecal contents
Consistent with our previous observations,Citation9 mice gavaged with alcohol after DSS treatment shows more pronounced weight loss and shorter colon lengths (Figure S1a–c). To assess intestinal bacterial changes, cecal contents, and colon contents were harvested from mice euthanized on experimental day seven, 3 h after final gavage. DNA was isolated from the colon and cecal contents followed by quantitative PCR (qPCR) to detect relative copy numbers of Enterobacteriaceae and Lactobacillus 16S rRNA. Both the colon and cecal contents of the DSS administered mice had significantly increased Enterobacteriaceae compared to the control mice (p < .05; ). Furthermore, between the DSS mice, ethanol administration produced a 1 log increase (p < .05) in the Enterobacteriaceae compared to vehicle administration. Lactobacillus levels were decreased 0.5 log in DSS+Ethanol mice compared to all other experimental groups, which was not significant, but a trend for significance was observed in the cecal contents (). Ratios of Lactobacillus to Enterobacteriaceae have been used as determinants of intestinal health.Citation28,Citation29 This ratio is significantly depressed (>1.5 log, p < .05) in DSS administered mice compared to control mice (). Meanwhile between the DSS treated groups, ethanol gavage significantly decreases the Lactobacillus:Enterobacteriaceae ratio in colon (~1 log, p < .05) and cecal (~1.5 log, p < .05) contents compared to vehicle ().
Figure 1. Increased Enterobacteriaceae and decreased Lactobacillus in large intestine and cecal contents of DSS+Ethanol mice. Cecal and colon contents were harvested from mice after euthanasia on day 7, 3 hours after gavage, followed by DNA isolation, qPCR, and determination of bacterial RQ for (a) Enterobacteriaceae, (b) Lactobacillus, (c) Lactoabacillus:Enterobacteriaceae. Bars display mean ± SEM, with each symbol representing data from one mouse. RQ: Relative Quantity. Statistics by One-Way ANOVA with Tukey post-hoc test. n = 6–8 per group. * p < .05, ** p < .01, **** p < .0001
A single ethanol gavage alters Enterobacteriaceae and Lactobacillus levels in fecal pellets
To define the longitudinal changes of the Enterobacteriaceae and Lactobacillus, we collected fecal pellets from the mice after weighing the mice and before gavaging with vehicle or ethanol on days 5 and 6. The effect of ethanol on bacterial populations in mice receiving combined DSS+Ethanol can be appreciated on day 6, one day after the first administration of alcohol ( and S2). From day 5 to day 6, there is a 0.9 log increase in the Enterobacteriaceae from DSS+Ethanol mice compared to a 0.7 log increase from the DSS+Vehicle mice (). During this same time period, the Lactobacillus decreases by 0.2 log in the DSS+Ethanol mice, while there is a slight increase (0.1 log) in the DSS+Vehicle mice (). This culminates in a~1 log decrease in the Lactobacillus:Enterobacteriaceae for the DSS+Ethanol mice, whereas this ratio decreases by ~0.5 log in DSS+Vehicle mice ().
Figure 2. Lactobacillus:Enterobacteriaceae decreases in DSS+Ethanol fecal pellets from Day 5 to Day 6. Fecal pellets were collected from mice after weighing and prior to gavage followed by DNA isolation, qPCR, and determination of bacterial RQ for (a) Enterobacteriaceae, (b) Lactobacillus, (c) Lactobacillus: Enterobacteriaceae. Some mice did not produce a fecal pellet, limiting continuous sampling from the same mouse, and therefore data are presented as a summary of each experimental group. Symbols represent the mean ± SEM for the experimental group. RQ: Relative Quantity. n = 4–6 per group
These results suggest that the alcohol administration elicits an effect on the intestinal microbiota after colitis leading to increases in Enterobacteriaceae and decreases in Lactobacillus, producing a decreased Lactobacillus:Enterobacteriaceae ratio. The higher level of Enterobacteriaceae and lower level of Lactobacillus may contribute to disease flares and increased intestinal inflammation.
Increased Enterobacteriaceae and decreased Lactobacillus are associated with aspects of disease severity
To further assess how the disease state of these mice relates to the intestinal bacteria, we performed a linear regression of the cecal contents bacteria in relation to the mouse colon length. The colon length is a macroscopic indicator of the inflammatory status of the colon, where longer colons are healthier and shorter colons are more inflamed. In our experiment, the colon length is inversely correlated to cecal content of Enterobacteriaceae () and directly correlated to cecal content of Lactobacillus (). On the scatter plot of the linear regression, samples from the DSS+Ethanol mice have shorter colons in conjunction with increased Enterobacteriaceae () and decreased Lactobacillus (). In addition, combining data from all four experimental groups, we examined the correlation of colon length, day 7 percent weight change, and cecal contents bacteria using a Pearson correlation (). This revealed that the colon length, and day 7 percent weight change are positively correlated with Lactobacillus while being inversely correlated with Enterobacteriaceae. Meanwhile, the relationship of Enterobacteriaceae and Lactobacillus are inversely correlated, although this result was not significant (p = .139).
Figure 3. Enterobacteriaceae inversely correlates with colon length and Lactobacillus positively correlates with colon length. (a) Cecal Enterobacteriaceae vs colon length linear regression with corresponding R2 value. (b) Cecal Lactobacillus vs colon length linear regression with corresponding R2 value. (c) Pearson correlation matrix examining correlation between colon length, day 7 percent weight change, cecal Enterobacteriaceae, and cecal Lactobacillus. Each symbol represents data from one mouse. RQ: Relative Quantity. Statistics by Pearson correlation. n = 6–8 per group. ** p < .01, *** p < .001, **** p < .0001
Intestinal mucin expression is altered post DSS-colitis with no additional effect by ethanol
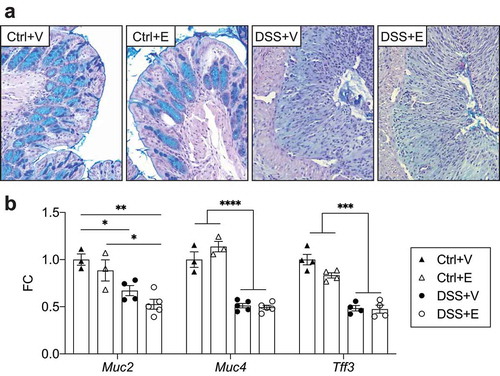
The healthy large intestine is covered by mucins, which act as a barrier to limit bacterial interaction with the intestinal epithelium.Citation35 However, in IBD there are marked disruptions of the intestinal mucin, which allow for increased interaction of the bacteria with the intestinal epithelium, which may induce a flare.Citation36–39 In our model, we first assessed mucin changes using a PAS-Alcian blue stain of intestinal sections. We observed that mucin staining was unaffected in the control mice but severely decreased in the DSS mice regardless of ethanol exposure (). The decreased intestinal mucin levels in the DSS mice suggests that bacterial interaction with the epithelium is uninhibited. We isolated large intestine epithelial cells (IECs) and assessed their expression of mucins and trefoil factor, a marker of intestinal health. Mucin 2, mucin 4, intestinal trefoil factor 3 were all significantly decreased ~twofold in the DSS+Vehicle and DSS+Ethanol mice when compared to the Control+Vehicle mice (p < .05) (). This mirrors the histologic changes observed in . These data suggest that DSS induces a primary effect on intestinal mucin depletion, while alcohol has no additive effect.
Figure 4. DSS decreases intestinal mucin staining and IEC mucin RNA expression with no additional effect after ethanol. (a) PAS-Alcian blue stained slides of distal colon from mice. Representative of 6–8 mice pre-group. Images taken at 400x total magnification. (b) IEC RNA expression of mucins and intestinal trefoil factor. n = 3–5 per group. Bars display mean ± SEM, with each symbol representing data from one mouse. FC: Fold change. Statistics by One-Way ANOVA with Tukey post-hoc test. * p < .05, ** p < .01, *** p < .001, **** p < .0001
Bacterial infiltration of the mucosa, tight junction protein expression, and plasma endotoxin levels
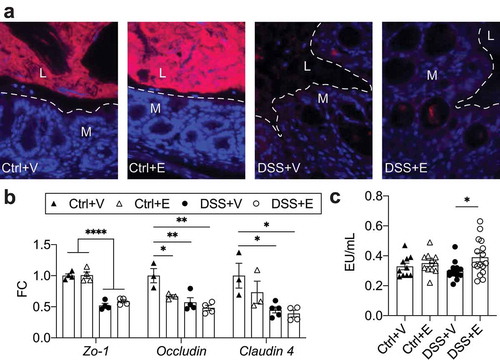
To determine bacterial penetration of the epithelial lining, we used fluorescent in situ hybridization with a probe targeting all bacteria. We detected an increased presence of bacteria in the mucosa of DSS mice; meanwhile bacteria were largely relegated to the intestinal lumen in control mice (). The presence of bacteria in the mucosa prompted examination of intestinal tight junction proteins. These proteins limit bacterial translocation, and have been found to be decreased in patients with colitis.Citation40 IEC RNA expression of tight junction proteins revealed that DSS administration with or without ethanol led to ~twofold decrease in ZO-1, Occludin, and Claudin-4 compared to the Control+Vehicle (p < .05) (). Some direct effects of ethanol appear to also occur as there was a significant decrease in Occludin expression in the Control+Ethanol mice compared to the Control+Vehicle mice, which is not significant between the DSS+Vehicle or DSS+Ethanol mice. The combined observations of decreased tight junction expression and increased mucosal infiltration suggest that there is increased opportunity for translocation of bacteria and their by-products, such as endotoxin. We, therefore, assessed plasma endotoxin levels as a marker of translocation. DSS+Ethanol mice exhibited significantly increased plasma endotoxin levels compared to DSS+Vehicle, but were not significantly different when compared to the control groups (). This effect may be secondary to the increased burden of Enterobacteriaceae in the DSS+Ethanol mice. As the liver is the primary site of interaction for any translocated bacteria and endotoxin, we next assessed for liver changes in our model.
Figure 5. DSS increases bacterial infiltration of intestinal mucosa and decreases expression of tight junction proteins with increases of circulating endotoxin in DSS+Ethanol. (a) Distal large intestine sections displaying localization of bacteria in red. Dashed line represents interface between intestinal epithelium and the intestinal lumen. Representative of 4–6 mice pre-group. Images taken at 400x total magnification. M: Mucosa; L: Lumen. (b) IEC RNA expression tight junction proteins. n = 3–5 per group. (c) Plasma levels of endotoxin. n = 10–16 per group. Bars display mean ± SEM, with each symbol representing data from one mouse. Zo-1: Zonula occludens-1, FC: Fold change. Statistics by One-Way ANOVA with Tukey post-hoc test. * p < .05, ** p < .01, **** p < .0001
DSS+Ethanol mice livers exhibit increased lipid deposition
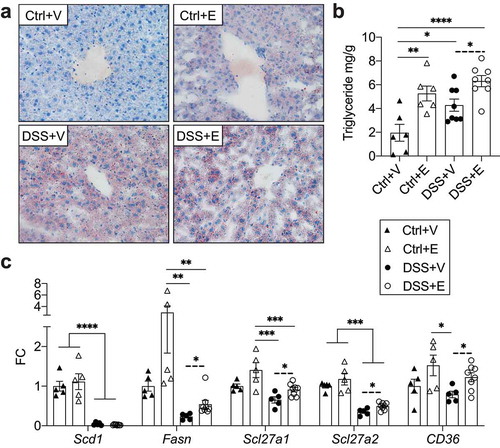
Accumulation of lipids within the liver is a marker of metabolic dysfunction and can be a consequence of alcohol consumption.Citation41,Citation42 Qualitative assessment of liver fat deposition using Oil Red O showed increased lipid staining in all experimental groups relative to Control+Vehicle (). In addition, the liver triglyceride concentrations were found to be highest in the DSS+Ethanol mice and this increase was significant when compared to the DSS+Vehicle mice (p = .0117, t-test) (). To identify the pathways promoting liver lipid accumulation in our model, we examined the expression of hepatic components involved in lipid synthesis (Scd1 and Fasn) and uptake (Scl27a1, Scl27a2, CD36) (). Overall DSS appeared to reduce expression of these components with respect to Control. Meanwhile between DSS+Vehicle and DSS+Ethanol, ethanol significantly promoted the expression of all these components except for Scd1. These results indicate that while DSS induces liver lipid deposition, the combination of DSS and ethanol further increases that effect likely through the upregulation of lipid uptake and synthesis pathways.
Figure 6. Increased lipid deposition and gene expression associated with lipid synthesis and uptake in DSS+Ethanol livers. (a) Oil Red O stain of frozen liver sections harvested from mice after euthanasia on day 7. Images taken at 400x total magnification. Representative images of n = 6–8 per group. (b) Liver triglyceride mg/g of liver tissue. n = 6–8 per group. (c) Expression of hepatic lipid synthesis and uptake genes. n = 5–8 per group. Bars display mean ± SEM, with each symbol representing data from one mouse. FC: Fold change. Solid lines indicate statistics by One-Way ANOVA with Tukey post-hoc test. Dashed lines indicate significance by student’s t-test. * p < .05, ** p < .01, *** p < .001, **** p < .0001
DSS+Ethanol mice livers exhibit features of immune tolerance
Bacteria and bacterial products that translocate from the colon, enter into the mesenteric circulation and can eventually arrive at the liver.Citation43 Within the liver, these translocated elements can induce inflammation and accumulation of inflammatory cells.Citation30 To assess liver inflammation in our model, we counted the number of mononuclear cells located around the central vein of H&E stained liver sections (). The mean number of mononuclear cells in Control+Ethanol, DSS+Vehicle, and DSS+Ethanol were significantly increased compared to Control+Vehicle (). No difference in mononuclear cell number was observed between Control+Ethanol and DSS+Vehicle, however, DSS+Ethanol exhibited a significant increase compared to these two groups. To better characterize the cell populations present in the livers of these mice, we assessed RNA expression of markers for T-cell (Cd3e), neutrophil (Ly6g) and macrophage (F4/80) lineages. The results from this analysis revealed an increase in neutrophils and macrophages after DSS administration and this was not found to be different when ethanol was added (Figure S3a). T-cells were noted to be reduced in DSS+Vehicle compared to Control+Vehicle.
Figure 7. DSS+Ethanol mice exhibit hepatic immune tolerance in the setting of increased plasma ALT. (a) H&E stained liver sections. Taken at 400x total magnification. Images representative of n = 6–8 per group (b) Liver mononuclear cell number counted per liver slide. (c) Plasma levels of ALT. n = 8–14 per group. (d) Liver inflammatory gene expression. n = 3–6 per group. (E) Western blot of liver homogenates for pNF-κB, total NF-κB, and β-actin. Bars display mean ± SEM, with each symbol representing data from one mouse. FC: Fold change. Statistics by One-Way ANOVA with Tukey post-hoc test. * p < .05, ** p < .01, *** p < .001, **** p < .0001
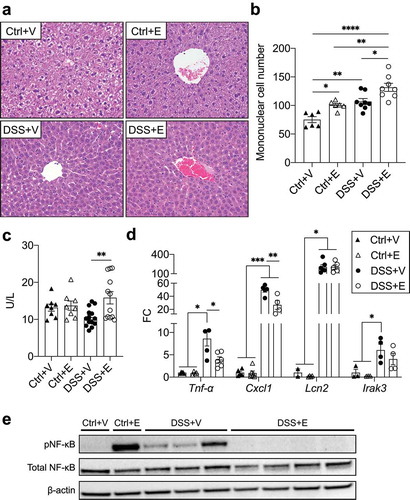
Liver damage was assessed by quantifying plasma levels of alanine aminotransferase (ALT), which were found to be significantly higher in DSS+Ethanol compared to the DSS+Vehicle (). Liver inflammation was measured by RNA expression of various inflammatory markers. DSS+Vehicle livers had significant increases in most inflammatory markers (Tnf-α, Cxcl1, S100a9, Tlr4, Nos2) compared to control groups and DSS+Ethanol (d and S3b), which was also observed at the protein level for CXCL1 (Figure S3c). The liver RNA expression of these genes in the DSS+Ethanol group were often significantly lower than the DSS+Vehicle group, while maintaining an upward trend compared to control groups that was at times significant. This trend, however, did not persist for Lipocalin-2, (Lcn2) which instead was noted to be increased to the same degree in both DSS+Vehicle and DSS+Ethanol ().
To define whether alterations in transcriptional activation could explain these observed changes, liver homogenates were assessed for activation of the NF-κB pathway via phosphorylation of serine 536, which increases transactivation potential and is commonly stimulated endotoxin.Citation44 Control+Vehicle had no detectable phosphorylated NF-κB, while a strong increase in NF-κB phosphorylation was observed in Control+Ethanol (). All DSS+Vehicle livers, exhibited phosphorylated NF-κB, meanwhile livers from DSS+Ethanol displayed no phosphorylated NF-κB. Similar results were seen for STAT1 phosphorylation, wherein the DSS+Vehicle livers exhibited a strong phosphorylation of STAT1, while the phosphorylation of STAT1 was in the DSS+Ethanol livers appeared similar to controls (Figure S3d). The downregulation of inflammatory gene expression and signaling seemed to suggest the presence of immune tolerance in the DSS+Ethanol livers which has been shown to rely in part on IRAK3 expression.Citation45 qPCR analysis identified an increase in Irak3 in mice receiving DSS compared to control, but there was no difference between the DSS+Vehicle and DSS+Ethanol livers (). Tolerance induction by alcohol has been linked to temporal component, where shortly after an alcohol binge, tolerance occurs but waiting 24 hours after an alcohol binge, a state of increased inflammation occurs.Citation46 We observed that sacrifice of DSS mice 24 hours after the last gavage of vehicle or ethanol abrogated the difference in inflammatory gene expression (Figure S3e).
Discussion
In this study, we identified that ethanol administration post-DSS induced colitis increases intestinal Enterobacteriaceae burden while also reducing the Lactobacillus:Enterobacteriaceae ratio compared to DSS colitis alone. These bacterial changes may in part explain our previously observed finding that ethanol exacerbates colitis flare.Citation9 Barrier function was similarly compromised between the mice receiving DSS+Vehicle and DSS+Ethanol, however, circulating endotoxin levels were higher in the DSS+Ethanol mice. The circulating endotoxin can initiate liver inflammation, which we observed as increased liver triglycerides, mononuclear cell infiltrate, and ALT levels in the DSS+Ethanol mice. Despite these increased markers of inflammation, examination of inflammatory gene expression and transcriptional pathways showed a decrease in their expression and activation, respectively, in the DSS+Ethanol mice, suggestive of an immune tolerant phenotype.
IBD flares and colitis models are characterized by increases in intestinal Enterobacteriaceae,Citation15–17,Citation47 with similar increases noted in individuals with chronic alcohol consumption.Citation14,Citation18,Citation48 We observed that the combination of colitis and ethanol increased the Enterobacteriaceae greater than that seen in either experimental group separately. In fact, ethanol alone did not produce any significant changes, suggesting that the presence of preexisting intestinal inflammation may be required in order for ethanol to have an effect on the Enterobacteriaceae. The observed increases in the Enterobacteriaceae are relevant as they can penetrate the mucus layer of UC patient intestines,Citation15,Citation16,Citation21 and studies carried out in UC disease models show that this penetration occurs before the onset of intestinal tissue damage.Citation22,Citation23 Furthermore, selectively limiting the expansion of Enterobacteriaceae in a mouse model of colitis has been shown to decrease colitis severity.Citation49
In contrast to the Enterobacteriaceae, lactobacilli play a beneficial role in intestinal health and are the primary constituents of numerous probiotics.Citation50 Lactobacilli have been found to be decreased in UC patients,Citation19 and alcohol consumers.Citation18 We observed that the DSS+Ethanol experimental group had near significant decreases of Lactobacillus in the cecal contents compared to Control+Vehicle and Control+Ethanol but not compared to DSS+Vehicle. Using the ratio of Lactobacillus:Enterobacteriaceae (where higher ratios are indicative of healthier intestines),Citation28,Citation29 we observed that both control groups exhibited a high ratio, with minimal deviation from each other, while the DSS+Vehicle group had a lower ratio, and the lowest ratio was seen in the DSS+Ethanol group. The ratio changes seen between the DSS experimental groups, highlights the importance of a prior insult in order for ethanol. A similar scenario can be seen in experiments that combine ethanol and burn injury, where minimal effects can be attributed to acute ethanol intake alone, however, in the context of a burn injury there is increased intestinal inflammation.Citation51 The limited effects of ethanol alone are further underscored by the limited changes in the mucins of this study and the intestinal pathology noted in this study and our previous study.Citation9
Due to the association of lactobacilli with gut health, numerous studies have turned to the reintroduction of these bacteria in the setting of colitis,Citation52–55 and alcohol consumption.Citation13,Citation18,Citation56,Citation57 One beneficial effect of lactobacilli is their ability to limit the proliferative of Enterobacteriaceae and other pathogenic bacteria.Citation24–27 Lactobacilli accomplishes this defense in part through the production of lactic acid that alters pH, which the lactobacilli can tolerate but other bacteria cannot.Citation58 Furthermore, reduced pH enhances bacterial production of short-chain fatty acid production which promotes intestinal health and inhibits the growth of Enterobacteriaceae bacteria.Citation59–61 Ethanol, on the other hand, has been shown to increase fecal pH which was sharply reduced by the administration of Lactobacillus.Citation13 Therefore, in our model of DSS-colitis, the observed decrease in lactobacilli with concomitant administration of ethanol may be one explanation for the increase in Enterobacteriaceae. Additionally, overgrowth of Enterobacteriaceae has been shown in a chronic model of DSS colitis with ethanol administration, which could be hindered by the addition of the antimicrobial peptide, human defensin-5.Citation62
As the Enterobacteriaceae expand, they are more likely to induce inflammatory reactions via increased IEC interaction and endotoxin translocation, leading to downstream liver inflammation,Citation30,Citation31 and even nonalcoholic fatty liver disease.Citation32 In the healthy intestine, mucins and tight junction proteins serve to limit these effects.Citation35,Citation63 However, in UC, both mucins and tight junction proteins can become dysfunctional.Citation37,Citation38,Citation64 In active UC, serum endotoxin levels rise,Citation65 which may be causal in some of the observed UC liver changes, such as increased hepatic steatosis, liver enlargement,Citation33 and elevated liver enzymes.Citation34 Meanwhile, ethanol has a demonstrated ability to disrupt tight junction proteins, increasing endotoxin translocation,Citation66–69 which can downregulate liver inflammation, an effect that is reversed by the administration of antibiotics.Citation46,Citation70 In a similar manner, mice receiving DSS exhibit increased liver mononuclear cells which are not observed in germ-free mice receiving DSS, suggesting a bacterial origin for liver inflammation during DSS-colitis.Citation71 In our model, we observed that irrespective of whether mice received DSS alone or ethanol after DSS, tight junction and mucin expression were similarly decreased. Furthermore, both of these experimental groups exhibited bacterial infiltration of the intestinal mucosa, however, increased circulating levels of endotoxin were noted to only be increased in the DSS+Ethanol mice. Although circulating endotoxin did not differ significantly in the DSS treated mice compared to the control mice, the difference in circulating endotoxin levels between the DSS+Vehicle and DSS+Ethanol may be reflective of the recovery states between the two experimental groups. Withdrawal of DSS on day 5 may allow for the DSS+Vehicle mice to enter a state of recovery enhancing endotoxin clearance, while this is prevented by the ethanol administration in the DSS+Ethanol mice. Additionally, the endotoxin levels may be significantly decreased in the DSS+Vehicle mice secondary to the increased expression of liver Tlr4, which can facilitate endotoxin clearance.Citation72
The changes in hepatic triglycerides and expression of lipid synthesis and uptake genes in our model appear to be multifactorial. Previous models of DSS and Citrobacter rodentium infection have shown that these livers decrease expression of Fasn and Scd1,Citation73 which was similarly observed in our DSS experimental groups. The mechanism for this decrease is not entirely understood but does rely in part on increased levels of TNF-α.Citation74 Meanwhile, ethanol has showed a potentiating effect on the expression of Fasn and Cd36,Citation75,Citation76 which can be appreciated in the livers of the DSS+Ethanol mice relative to DSS+Vehicle. Therefore, the increased concentration of hepatic triglycerides in the DSS+Ethanol mice may be a culmination of ethanol promoting expression of lipid synthesis and uptake genes, which is further exacerbated by the depression of Tnf-α expression.
The induction of tolerance from excessive endotoxin relies on a complex signaling network that reduces the activation of proinflammatory transcription factors such as NF-κB,Citation77 and STAT1.Citation78 The induction of tolerance relies in part on the increased expression of Irak3, which has been identified as a negative regulator of TLR signaling.Citation45 We observed increases in Irak3 in both DSS treated groups but did not see any significant difference, suggesting other tolerizing effectors may be playing a role, such as Bcl-3, which can be induced by ethanol,Citation79 and then inhibits the activity of NF-κB and STAT1.Citation80 In contrast, the persistent expression of Lcn2 we observed in DSS treated mice, had been described in kidney fibroblasts to occur via a biphasic mechanism wherein endotoxin activates TLR4, leading to early phase activation of c-Jun, followed by late phase and sustained activation of C/EBPδ.Citation81
In summary, we observed that administration of ethanol post-DSS colitis leads to increased Enterobacteriaceae, decreased Lactobacillus, and a decreased Lactobacillus:Enterobacteriaceae ratio. These bacterial changes were associated with increased weight loss and shorter colons. In the DSS+Ethanol mice, the barrier dysfunction produced by ethanol, likely allows for a proportional increase in leakage of the Enterobacteriaceae endotoxin relative to the DSS+Vehicle mice as seen by the increased circulating levels of endotoxin. The result of this may explain the exacerbated intestinal pathology of the DSS+Ethanol mice. Meanwhile, the continued interaction of endotoxin with the liver increases triglyceride content, mononuclear cells, and liver damage, while also inducing an immune tolerant phenotype. Together these findings suggest that ethanol further exacerbates DSS colitis via an increase in the intestinal Enterobacteriaceae which likely contribute to the downstream effects including liver injury and immune tolerance.
Methods
Murine model of alcohol and colitis
Male C57BL/6 mice (8–9 weeks old; ∼23–25 g body weight) were obtained from Charles River Laboratories (Wilmington, MA). The mouse model used in this study was previously described.Citation9 Briefly, mice were randomly assigned to four experimental groups: Control+Vehicle (Ctrl+V), Control+Ethanol (Ctrl+E), Dextran sodium sulfate+Vehicle (DSS+V), Dextran sodium sulfate+Ethanol (DSS+E). Mice were administered either normal drinking water or a 2% (w/v) solution of DSS (36,000–50,000 molecular weight; MP Biomedicals) ad libitum, starting on day 0 and until day 5. On day 5, DSS was stopped and mice received a gavage of either 3 g/kg ethanol or water per day until day 7. Mice were euthanized either 3 hours or 24 hours (DSS + V + 1, DSS + E + 1) after the last gavage. Mice were weighed each day to determine percent weight change relative to day 0. Following euthanasia, the large intestine was excised and its length determined. All the animal procedures were carried out in accordance with the National Institutes of Health Guide for the Care and Use of Laboratory Animals. These studies were approved by the Loyola University Chicago Health Sciences Division Institutional Animal Care and Use Committee.
Bacterial DNA isolation
Fecal pellets were collected from mice on days 5 and 6. Colon contents and cecal contents were removed from mice at euthanasia on day 7. Bacterial DNA was isolated from these samples using the QIAamp PowerFecal DNA Kit (Qiagen) according to manufacturer’s guidelines. The optional 5-minute incubation at 2–8°C was not used. Isolated DNA was quantified using a NanoDrop 2000 spectrophotometer (Thermo Fisher Scientific). Due to noted PCR inhibition in the DNA from the day 5 fecal pellets of the DSS mice, all day 5 fecal pellet DNA samples were further purified using the DNeasy PowerClean Pro Cleanup Kit (Qiagen).
Bacterial DNA qPCR
Primers for bacterial community quantification were as follows: Total bacteria- UniF340 (ACTCCTACGGGAGGCAGCAGT) and UniR514 (ATTACCGCGGCTGCTGGC), annealing temperature 63°C; Enterobacteriaceae- Uni515F (GTGCCAGCAGCCGCGGTAA) and Ent826R (GCCTCAAGGGCACAACCTCCAAG), annealing temperature 67°C; Lactobacillus- LabF362 (AGCAGTAGGGAATCTTCCA) and LabR677 (CACCGCTACACATGGAG), annealing temperature 56°C.Citation82 Six µL of DNA (0.7ng/µL for fecal pellets and large intestine contents, or 7 ng/µL cecal contents) was mixed with 2 µL of each forward and reverse primer and 10 µL of iTaq Universal SYBR Green supermix (Bio-Rad) for a total reaction volume of 20 µL. Reactions were performed on a Step One Plus qPCR instrument (Applied Biosystems) and run as follows: 95°C for 3 minutes, 40 cycles of 95°C for 15 seconds, followed by data collection at the annealing temperature for 1 minute. This was followed by a melt-curve analysis. To interpret bacterial DNA relative quantity (RQ), Ct values from target bacteria (Enterobacteriaceae or Lactobacillus) were subtracted from total bacteria Ct values to obtain a ΔCt, this was used for the 2^(-ΔCt) calculation. The 2(-ΔCt) value was then log10 transformed. For ratio assessment, the Lactobacillus 2(-ΔCt) value was divided by the Enterobacteriaceae value and the result was then log10 transformed.
Large IEC isolation
Isolation of large IECs was performed as described previously.Citation83 The large intestine was opened longitudinally and placed in cold PBS containing a 1% penicillin/streptomycin (pen/strep) cocktail (Corning). The tissues were washed twice with PBS+pen/strep, then placed in a digestion solution (prewarmed to 37°C) containing 5% heat-inactivated fetal bovine serum (FBS), 1% HEPES, 1% pen/strep, 0.5% gentamicin, 5 mM EDTA, and 1 mM dithiothreitol in Hank’s Balanced Salt Solution. The tissues were then placed in a 37°C shaking incubator (250 rpm) for 20 minutes, then vortexed to dissociate epithelial cells and passed through a 100 μm filter set in a tube on ice. The prior step was repeated with additional digestion solution. The IECs were washed twice in PBS and then stored at −80°C until downstream processing.
IEC RNA isolation, cDNA synthesis, and gene expression
RNA was isolated from large IECs and liver tissue using the RNeasy Mini Kit (Qiagen) according to manufacturer’s guidelines. The RNase-free-DNase Set (Qiagen) was used in conjunction with the RNA isolation kit to remove genomic DNA. RNA was quantified using a NanoDrop 2000 spectrophotometer (Thermo Fisher Scientific). cDNA was synthesized using the High Capacity cDNA Reverse Transcription Kit (Thermo Fisher Scientific) and run on a Veriti 96-well Fast Thermocycler (Life Technologies).
Expression of mucins and tight junction proteins were assessed by qPCR using TaqMan primer probes and TaqMan Fast Advanced Master Mix (Thermo Fisher Scientific). Reactions were performed on a Step One Plus qPCR instrument (Applied Biosystems). Endogenous controls for the targets are as listed on the y-axis of figures. Targets were assessed using the 2(-ΔCt) method and expressed as fold change (FC) relative to Control+Vehicle or DSS + V + 1.
Large intestine mucin staining and histopathology
A 1 cm portion of the distal large intestine was removed, fixed in Carnoy’s solution (RICCA Chemical Company), and submitted to AML labs (Jacksonville, FL). Samples were embedded in paraffin and sectioned at 5 μm onto glass slides. Slides were stained with Periodic acid-Schiff (PAS) and Alcian blue, to detect neutral and acidic mucins. Images were taken on an Olympus BX43 Microscope using an Olympus DP26 camera at total magnification of 400x. These sections were then scored based on a 0–4 point scale examining exudate, epithelial damage, polymorphonuclear leukocyte invasion, submucosal edema, and necrosis. The values from each of these categories were summed to produce the combined histopathology score.
Endotoxin assay
Isolated plasma was tested in duplicate for endotoxin levels using the Pierce Chromogenic Endotoxin Quant Kit (Thermo Fisher Scientific), according to the manufacturer’s guidelines.
Liver histology and oil red O staining
Livers were removed at euthanasia and divided for fixation in 10% neutral buffered formalin or embedded in optimal cutting temperature media. Formalin fixed samples were submitted to AML labs (Jacksonville, FL). Samples were embedded in paraffin and sectioned at 5 μm onto glass slides, followed by staining with hematoxylin and eosin (H&E). Images were taken on an Olympus BX43 Microscope using an Olympus DP26 camera at total magnification of 400x. For mononuclear cell quantification of H&E stained liver slides (n = 6–8 per experimental group), a single 400x area was counted by a blinded technician.
Livers embedded in optimal cutting temperature media were cut at 5 μm sections in a cryostat. Sections were stained with Oil Red O at the Loyola Histology Core. Assessment of slides was performed by a blinded pathologist. Images were taken on an Olympus BX43 Microscope using an Olympus DP26 camera at total magnification of 400x.
Cxcl1 ELISA
Liver homogenates were assayed in duplicate using the Cxcl1 ELISA (R&D Systems) according to manufacturer’s instructions and then normalized to total protein in the liver homogenate as quantified by the DC Protein Assay (Bio-Rad).
Fluorescent in-situ hybridization
Hybridization of distal large intestine slides with bacterial probes was completed as described previously.Citation84 Briefly, unstained slides were deparaffinized in 3 washes with xylene followed by 3 washes in ethanol. Slides were dried in an incubator at 50°C for 25 minutes. Slides were incubated overnight at 50°C with 1 ng/µL of probe targeting all bacteria (EUB338: Alexa 555 5’-GCTGCCTCCCGTAGGAGT −3’) (Invitrogen) in buffer (0.9 M NaCl, 20mMTris-HCL, pH 7.5, 0.1% SDS). To wash unbound probe, the slides were incubated 15 minutes in buffer (0.9 M NaCl, 20mMTris-HCL, pH 7.5, 0.1% SDS) three times. Slides were then air-dried, mounted, and counterstained with ProLong Gold Antifade Mountant with DAPI (Thermo Fisher Scientific). Slides were imaged on a Zeiss Axiovert 200 m fluorescent microscope at total magnification of 400x and processed by the Axiovision software. In Adobe photoshop, a histogram stretch was employed for the blue and red channels to spread the image intensities across the entire intensity display range.
Triglyceride quantification
Liver triglycerides were quantified using the Triglyceride Colorimetric Assay Kit (Cayman) according to manufacturer’s guidelines. Briefly, livers were weighed prior to homogenization in the NP40 substitute assay reagent with 1x Halt Protease and Phosphatase Inhibitor Cocktail (Thermo Fisher Scientific) and then assayed in duplicate. Data are displayed as triglyceride mg/g of liver tissue.
Plasma ALT quantification
Plasma levels of ALT were assayed in duplicate using the Alanine Transaminase Colorimetric Activity Assay Kit (Cayman), according to manufacturer’s guidelines.
Liver western blot
Thirty mg of liver were homogenized in 1x Cell Lysis Buffer (Cell Signaling Technologies) supplemented with 1x Halt Protease and Phosphatase Inhibitor Cocktail (Thermo Fisher Scientific). Protein was quantified using the DC Protein Assay (Bio-Rad). Protein was separated using SDS- PAGE using Bolt Bis-Tris gels (Thermo Fisher Scientific) and then transferred to a PVDF Membrane using a wet transfer method. Membrane was blocked with milk, washed with TBS, then incubated overnight with respective antibodies (pNF-κB, Cell Signaling Technologies; NF-κB Cell Signaling Technologies; pSTAT1 Abcam; STAT1 Abcam; β-actin Cell Signaling Technologies). After washing with TBST, the membrane was incubated with HRP-linked secondary antibody (Cell Signaling Technology) and developed using Western Lightning Plus-ECL, Enhanced Chemiluminescence Substrate (Perkin Elmer). Membrane was imaged on a ChemiDoc (Bio-Rad) and densitometry analysis performed using ImageLab software (Bio-Rad). Afterward the blot was stripped using Restore Plus Stripping Buffer (Thermo Fisher Scientific) and then reprobed with a different antibody.
Statistics
Linear regression, Pearson correlation, One-way ANOVA followed by Tukey posthoc test, and student’s t-test were performed using GraphPad Prism 8 software. When values between DSS+Vehicle and DSS+Ethanol did not achieve significance, a student’s t-test was performed. In figures, the t-test appears as a dashed line. For the plasma ALT quantification, a Grubb’s test was used to identify and remove a significant outlier in the DSS+Vehicle experimental group. Statistical significance was defined as a p value < .05.
Disclosure of Potential Conflicts of interest
The authors report no conflict of interest.
Supplemental Material
Download PDF (762.1 KB)Supplementary material
Supplemental data for this article can be accessed on the publisher’s website.
Additional information
Funding
References
- Ananthakrishnan AN. Epidemiology and risk factors for IBD. Nat Rev Gastroenterol Hepatol. 2015;12:205–217. doi:10.1038/nrgastro.2015.34.
- Hendrickson BA, Gokhale R, Cho JH. Clinical aspects and pathophysiology of inflammatory bowel disease. Clin Microbiol Rev. 2002;15(1):79–94. doi:10.1128/CMR.15.1.79-94.2002.
- Ananthakrishnan AN, Bernstein CN, Iliopoulos D, Macpherson A, Neurath MF, Ali RAR, Vavricka SR, Fiocchi C. Environmental triggers in IBD: a review of progress and evidence. Nat Rev Gastroenterol Hepatol. 2018;15(1):39. doi:10.1038/nrgastro.2017.136.
- Ghosh S, Shand A, Ferguson A. Ulcerative colitis. BMJ. 2000;320(7242):1119–1123. doi:10.1136/bmj.320.7242.1119.
- Brown AC, Rampertab SD, Mullin GE. Existing dietary guidelines for Crohn’s disease and ulcerative colitis. Expert Rev Gastroenterol Hepatol. 2011;5(3):411–425. doi:10.1586/egh.11.29.
- Cohen AB, Lee D, Long MD, Kappelman MD, Martin CF, Sandler RS, Lewis JD. Dietary patterns and self-reported associations of diet with symptoms of inflammatory bowel disease. Dig Dis Sci. 2013;58(5):1322–1328. doi:10.1007/s10620-012-2373-3.
- Swanson GR, Sedghi S, Farhadi A, Keshavarzian A. Pattern of alcohol consumption and its effect on gastrointestinal symptoms in inflammatory bowel disease. Alcohol. 2010;44(3):223–228. doi:10.1016/j.alcohol.2009.10.019.
- Jowett S, Seal C, Pearce M, Phillips E, Gregory W, Barton J, Welfare MR. Influence of dietary factors on the clinical course of ulcerative colitis: a prospective cohort study. Gut. 2004;53(10):1479–1484. doi:10.1136/gut.2003.024828.
- Cannon AR, Kuprys PV, Cobb AN, Ding X, Kothari AN, Kuo PC, Eberhardt JM, Hammer AM, Morris NL, Li X, et al. Alcohol enhances symptoms and propensity for infection in inflammatory bowel disease patients and a murine model of DSS‐induced colitis. J Leukoc Biol. 2018;104(3):543–555. doi:10.1002/JLB.4MA1217-506R.
- Mutlu EA, Gillevet PM, Rangwala H, Sikaroodi M, Naqvi A, Engen PA, Kwasny M, Lau CK, Keshavarzian A. Colonic microbiome is altered in alcoholism. Am J Physiol Gastrointest Liver Physiol. 2012;302(9):G966–G78. doi:10.1152/ajpgi.00380.2011.
- Lowe PP, Gyongyosi B, Satishchandran A, Iracheta-Vellve A, Ambade A, Kodys K, Catalano D, Ward DV, Szabo G. Alcohol-related changes in the intestinal microbiome influence neutrophil infiltration, inflammation and steatosis in early alcoholic hepatitis in mice. PLoS One. 2017;12(3):e0174544. doi:10.1371/journal.pone.0174544.
- Llopis M, Cassard A, Wrzosek L, Boschat L, Bruneau A, Ferrere G, Puchois V, Martin JC, Lepage P, Le Roy T, et al. Intestinal microbiota contributes to individual susceptibility to alcoholic liver disease. Gut. 2015;65(5):830–839. doi:10.1136/gutjnl-2015-310585.
- Bull-Otterson L, Feng W, Kirpich I, Wang Y, Qin X, Liu Y, Gobejishvili L, Joshi-Barve S, Ayvaz T, Petrosino J. Metagenomic analyses of alcohol induced pathogenic alterations in the intestinal microbiome and the effect of Lactobacillus rhamnosus GG treatment. PLoS One. 2013;8(1):e53028. doi:10.1371/journal.pone.0053028.
- Tsuruya A, Kuwahara A, Saito Y, Yamaguchi H, Tsubo T, Suga S, Inai M, Aoki Y, Takahashi S, Tsutsumi E. Ecophysiological consequences of alcoholism on human gut microbiota: implications for ethanol-related pathogenesis of colon cancer. Sci Rep. 2016;6:27923. doi:10.1038/srep27923.
- Swidsinski A, Ladhoff A, Pernthaler A, Swidsinski S, Loening–Baucke V, Ortner M, Weber J, Hoffmann U, Schreiber S, Dietel M. Mucosal flora in inflammatory bowel disease. Gastroenterology. 2002;122(1):44–54. doi:10.1053/gast.2002.30294.
- Schultsz C, van den Berg FM, Fiebo W, Tytgat GN, Dankert J. The intestinal mucus layer from patients with inflammatory bowel disease harbors high numbers of bacteria compared with controls. Gastroenterology. 1999;117(5):1089–1097. doi:10.1016/S0016-5085(99)70393-8.
- Kotlowski R, Bernstein CN, Sepehri S, Krause DO. High prevalence of Escherichia coli belonging to the B2+ D phylogenetic group in inflammatory bowel disease. Gut. 2007;56(5):669–675. doi:10.1136/gut.2006.099796.
- Kirpich IA, Solovieva NV, Leikhter SN, Shidakova NA, Lebedeva OV, Sidorov PI, Bazhukova TA, Soloviev AG, Barve SS, McClain CJ. Probiotics restore bowel flora and improve liver enzymes in human alcohol-induced liver injury: a pilot study. Alcohol. 2008;42(8):675–682. doi:10.1016/j.alcohol.2008.08.006.
- Fabia R, Ar’Rajab A, Johansson M-L, Andersson R, Willén R, Jeppsson B, Molin G, Bengmark S. Impairment of bacterial flora in human ulcerative colitis and experimental colitis in the rat. Digestion. 1993;54(4):248–255. doi:10.1159/000201045.
- Sarin SK, Pande A, Schnabl B. Microbiome as a therapeutic target in alcohol-related liver disease. J Hepatol. 2019;70:260–272.
- Mylonaki M, Rayment NB, Rampton DS, Hudspith BN, Brostoff J. Molecular characterization of rectal mucosa-associated bacterial flora in inflammatory bowel disease. Inflamm Bowel Dis. 2005;11(5):481–487. doi:10.1097/01.MIB.0000159663.62651.4f.
- Johansson ME, Gustafsson JK, Sjöberg KE, Petersson J, Holm L, Sjövall H, Hansson GC. Bacteria penetrate the inner mucus layer before inflammation in the dextran sulfate colitis model. PLoS One. 2010;5(8):e12238. doi:10.1371/journal.pone.0012238.
- Johansson ME, Gustafsson JK, Holmén-Larsson J, Jabbar KS, Xia L, Xu H, Ghishan FK, Carvalho FA, Gewirtz AT, Sjövall H, et al. Bacteria penetrate the normally impenetrable inner colon mucus layer in both murine colitis models and patients with ulcerative colitis. Gut. 2013;63(2):281–291. doi:10.1136/gutjnl-2012-303207
- Yang J, Niu C, Guo X. Mixed culture models for predicting intestinal microbial interactions between Escherichia coli and Lactobacillus in the presence of probiotic Bacillus subtilis. Benef Microbes. 2015;6(6):871–877. doi:10.3920/BM2015.0033.
- Fijan S, Šulc D, Steyer A. Study of the in vitro antagonistic activity of various single-strain and multi-strain probiotics against Escherichia coli. Int J Environ Res Public Health. 2018;15(7):1539. doi:10.3390/ijerph15071539.
- Sreekumar O, Hosono A. Immediate effect of Lactobacillus acidophilus on the intestinal flora and fecal enzymes of rats and the in vitro inhibition of Escherichia coli in coculture. J Dairy Sci. 2000;83(5):931–939. doi:10.3168/jds.S0022-0302(00)74956-3.
- Delley M, Bruttin A, Richard M, Affolter M, Rezzonico E, Brück WM. In vitro activity of commercial probiotic Lactobacillus strains against uropathogenic Escherichia coli. FEMS Microbiol Lett. 2015;362:13. doi:10.1093/femsle/fnv096.
- Reid C-A, Hillman K. The effects of retrogradation and amylose/amylopectin ratio of starches on carbohydrate fermentation and microbial populations in the porcine colon. Anim Sci. 1999;68(3):503–510. doi:10.1017/S1357729800050529.
- Muralidhara K, Sheggeby G, Elliker P, England D, Sandine W. Effect of feeding lactobacilli on the coliform and lactobacillus flora of intestinal tissue and feces from piglets. J Food Prot. 1977;40(5):288–295. doi:10.4315/0362-028X-40.5.288.
- Bilzer M, Roggel F, Gerbes AL. Role of Kupffer cells in host defense and liver disease. Liver Int. 2006;26(10):1175–1186. doi:10.1111/j.1478-3231.2006.01342.x.
- Nolan JP. The role of endotoxin in liver injury. Gastroenterology. 1975;69(6):1346–1356. doi:10.1016/S0016-5085(19)32333-9.
- Fei N, Bruneau A, Zhang X, Wang R, Wang J, Rabot S, Gérard P, Zhao L. Endotoxin producers overgrowing in human gut microbiota as the causative agents for nonalcoholic fatty liver disease. mBio. 2020;11:1. doi:10.1128/mBio.03263-19.
- Bargiggia S, Maconi G, Elli M, Molteni P, Ardizzone S, Parente F, Todaro I, Greco S, Manzionna G, Porro GB. Sonographic prevalence of liver steatosis and biliary tract stones in patients with inflammatory bowel disease: study of 511 subjects at a single center. J Clin Gastroenterol. 2003;36(5):417–420. doi:10.1097/00004836-200305000-00012.
- Mendes FD, Levy C, Enders FB, Loftus EV Jr, Angulo P, Lindor KD. Abnormal hepatic biochemistries in patients with inflammatory bowel disease. Am J Gastroenterol. 2007;102(2):344. doi:10.1111/j.1572-0241.2006.00947.x.
- Liévin-Le Moal V, Servin AL. The front line of enteric host defense against unwelcome intrusion of harmful microorganisms: mucins, antimicrobial peptides, and microbiota. Clin Microbiol Rev. 2006;19:315–337.
- Pullan R, Thomas G, Rhodes M, Newcombe R, Williams G, Allen A, Rhodes J. Thickness of adherent mucus gel on colonic mucosa in humans and its relevance to colitis. Gut. 1994;35(3):353–359. doi:10.1136/gut.35.3.353.
- Larsson JMH, Karlsson H, Crespo JG, Johansson ME, Eklund L, Sjövall H, Hansson GC. Altered O-glycosylation profile of MUC2 mucin occurs in active ulcerative colitis and is associated with increased inflammation. Inflamm Bowel Dis. 2011;17(11):2299–2307. doi:10.1002/ibd.21625.
- van der Post S, Jabbar KS, Birchenough G, Arike L, Akhtar N, Sjovall H, Johansson ME, Hansson GC. Structural weakening of the colonic mucus barrier is an early event in ulcerative colitis pathogenesis. Gut. 2019;68(12):2142–2151. doi:10.1136/gutjnl-2018-317571.
- Gersemann M, Becker S, Kübler I, Koslowski M, Wang G, Herrlinger KR, Griger J, Fritz P, Fellermann K, Schwab M. Differences in goblet cell differentiation between Crohn’s disease and ulcerative colitis. Differentiation. 2009;77(1):84–94. doi:10.1016/j.diff.2008.09.008.
- Martini E, Krug SM, Siegmund B, Neurath MF, Becker C. Mend your fences: the epithelial barrier and its relationship with mucosal immunity in inflammatory bowel disease. Cell Mol Gastroenterol Hepatol. 2017;4(1):33–46. doi:10.1016/j.jcmgh.2017.03.007.
- Liu Q, Bengmark S, Qu S. The role of hepatic fat accumulation in pathogenesis of non-alcoholic fatty liver disease (NAFLD). Lipids Health Dis. 2010;9(1):42. doi:10.1186/1476-511X-9-42.
- Purohit V, Gao B, Song BJ. Molecular mechanisms of alcoholic fatty liver. Alcohol Clin Exp Res. 2009;33:191–205.
- Seo YS, Shah VH. The role of gut-liver axis in the pathogenesis of liver cirrhosis and portal hypertension. Clin Mol Hepatol. 2012;18(4):337. doi:10.3350/cmh.2012.18.4.337.
- Viatour P, Merville M-P, Bours V, Chariot A. Phosphorylation of NF-κB and IκB proteins: implications in cancer and inflammation. Trends Biochem Sci. 2005;30(1):43–52. doi:10.1016/j.tibs.2004.11.009.
- Kobayashi K, Hernandez LD, Galán JE, Janeway CA Jr, Medzhitov R, Flavell RA. IRAK-M is a negative regulator of Toll-like receptor signaling. Cell. 2002;110(2):191–202. doi:10.1016/S0092-8674(02)00827-9.
- Enomoto N, Ikejima K, Bradford B, Rivera C, Kono H, Brenner DA, Thurman RG. Alcohol causes both tolerance and sensitization of rat Kupffer cells via mechanisms dependent on endotoxin. Gastroenterology. 1998;115(2):443–451. doi:10.1016/S0016-5085(98)70211-2.
- Gkouskou K, Deligianni C, Tsatsanis C, Eliopoulos AG. The gut microbiota in mouse models of inflammatory bowel disease. Front Cell Infect Microbiol. 2014;4:28. doi:10.3389/fcimb.2014.00028.
- Bjørkhaug ST, Aanes H, Neupane SP, Bramness JG, Malvik S, Henriksen C, Skar V, Medhus AW, Valeur J. Characterization of gut microbiota composition and functions in patients with chronic alcohol overconsumption. Gut Microbes. 2019;10(6):663–675. doi:10.1080/19490976.2019.1580097.
- Zhu W, Winter MG, Byndloss MX, Spiga L, Duerkop BA, Hughes ER, Büttner L, de Lima Romão E, Behrendt CL, Lopez CA. Precision editing of the gut microbiota ameliorates colitis. Nature. 2018;553(7687):208. doi:10.1038/nature25172.
- Lebeer S, Vanderleyden J, De Keersmaecker SC. Genes and molecules of lactobacilli supporting probiotic action. Microbiol Mol Biol Rev. 2008;72:728–764.
- Li X, Akhtar S, Kovacs EJ, Gamelli RL, Choudhry MA. Inflammatory response in multiple organs in a mouse model of acute alcohol intoxication and burn injury. J Burn Care Res. 2011;32(4):489–497. doi:10.1097/BCR.0b013e3182223c9e.
- Zocco M, Dal Verme LZ, Cremonini F, Piscaglia A, Nista E, Candelli M, Novi M, Rigante D, Cazzato IA, Ojetti V. Efficacy of Lactobacillus GG in maintaining remission of ulcerative colitis. Aliment Pharmacol Ther. 2006;23(11):1567–1574. doi:10.1111/j.1365-2036.2006.02927.x.
- Oliva S, Di Nardo G, Ferrari F, Mallardo S, Rossi P, Patrizi G, Cucchiara S, Stronati L. Randomised clinical trial: the effectiveness of Lactobacillus reuteri ATCC 55730 rectal enema in children with active distal ulcerative colitis. Aliment Pharmacol Ther. 2012;35(3):327–334. doi:10.1111/j.1365-2036.2011.04939.x.
- Abdin AA, Saeid EM. An experimental study on ulcerative colitis as a potential target for probiotic therapy by Lactobacillus acidophilus with or without “olsalazine”. J Crohns Colitis. 2008;2(4):296–303. doi:10.1016/j.crohns.2008.04.002.
- Bibiloni R, Fedorak RN, Tannock GW, Madsen KL, Gionchetti P, Campieri M, De Simone C, Sartor RB. VSL# 3 probiotic-mixture induces remission in patients with active ulcerative colitis. Am J Gastroenterol. 2005;100(7):1539. doi:10.1111/j.1572-0241.2005.41794.x.
- Wang Y, Liu Y, Sidhu A, Ma Z, McClain C, Feng W. Lactobacillus rhamnosus GG culture supernatant ameliorates acute alcohol-induced intestinal permeability and liver injury. Am J Physiol Gastrointest Liver Physiol. 2012;303(1):G32–G41. doi:10.1152/ajpgi.00024.2012.
- Zhou Z, Zhong W. Targeting the gut barrier for the treatment of alcoholic liver disease. Liver Res. 2017;1(4):197–207. doi:10.1016/j.livres.2017.12.004.
- Kashket ER. Bioenergetics of lactic acid bacteria: cytoplasmic pH and osmotolerance. FEMS Microbiol Rev. 1987;3(3):233–244. doi:10.1111/j.1574-6968.1987.tb02463.x.
- Shin R, Suzuki M, Morishita Y. Influence of intestinal anaerobes and organic acids on the growth of enterohaemorrhagic Escherichia coli O157: H7. J Med Microbiol. 2002;51(3):201–206. doi:10.1099/0022-1317-51-3-201.
- Sorbara MT, Dubin K, Littmann ER, Moody TU, Fontana E, Seok R, Leiner IM, Taur Y, Peled JU, van den Brink MRM. Inhibiting antibiotic-resistant Enterobacteriaceae by microbiota-mediated intracellular acidification. J Exp Med. 2019;216(1):84–98. doi:10.1084/jem.20181639.
- Cherrington CA, Hinton M, Pearson G, Chopra I. Short‐chain organic acids at pH 5.0 kill Escherichia coli and Salmonella spp. without causing membrane perturbation. J Appl Bacteriol. 1991;70(2):161–165. doi:10.1111/j.1365-2672.1991.tb04442.x.
- Shukla PK, Meena AS, Rao V, Rao RG, Balazs L, Rao R. Human defensin-5 blocks ethanol and colitis-induced dysbiosis, tight junction disruption and inflammation in mouse intestine. Sci Rep. 2018;8(1):1–14. doi:10.1038/s41598-018-34263-4.
- Suzuki T. Regulation of intestinal epithelial permeability by tight junctions. Cell Mol Life Sci. 2013;70:631–659.
- Heller F, Florian P, Bojarski C, Richter J, Christ M, Hillenbrand B, Mankertz J, Gitter A, Burgel N, Fromm M. Interleukin-13 is the key effector Th2 cytokine in ulcerative colitis that affects epithelial tight junctions, apoptosis, and cell restitution. Gastroenterology. 2005;129(2):550–564. doi:10.1016/j.gastro.2005.05.002.
- Rojo ÓP, Román ALS, Arbizu EA, de la Hera Martínez A, Sevillano ER, Martínez AA. Serum lipopolysaccharide-binding protein in endotoxemic patients with inflammatory bowel disease. Inflamm Bowel Dis. 2006;13(3):269–277. doi:10.1002/ibd.20019.
- Mir H, Meena AS, Chaudhry KK, Shukla PK, Gangwar R, Manda B, Padala MK, Shen L, Turner JR, Dietrich P. Occludin deficiency promotes ethanol-induced disruption of colonic epithelial junctions, gut barrier dysfunction and liver damage in mice. Biochim Biophy Acta (BBA). 2016;1860(4):765–774. doi:10.1016/j.bbagen.2015.12.013.
- Atkinson K, Rao R. Role of protein tyrosine phosphorylation in acetaldehyde-induced disruption of epithelial tight junctions. Am J Physiol Gastrointest Liver Physiol. 2001;280(6):G1280–G8. doi:10.1152/ajpgi.2001.280.6.G1280.
- Sheth P, Seth A, Thangavel M, Basuroy S, Rao R. Epidermal growth factor prevents acetaldehyde‐induced paracellular permeability in Caco‐2 cell monolayer. Alcohol Clin Exp Res. 2004;28(5):797–804. doi:10.1097/01.ALC.0000125358.92335.90.
- Bala S, Marcos M, Gattu A, Catalano D, Szabo G. Acute binge drinking increases serum endotoxin and bacterial DNA levels in healthy individuals. PLoS One. 2014;9:5. doi:10.1371/journal.pone.0096864.
- Nishiyama D, Ikejima K, Honda H, Hirose M, Takei Y, Sato N. Acute ethanol administration down-regulates toll-like receptor-4 in the murine liver. Hepatol Res. 2002;23(2):130–137. doi:10.1016/S1386-6346(01)00168-1.
- Mikami Y, Mizuno S, Nakamoto N, Hayashi A, Sujino T, Sato T, Kamada N, Matsuoka K, Hisamatsu T, Ebinuma H. Macrophages and dendritic cells emerge in the liver during intestinal inflammation and predispose the liver to inflammation. PLoS One. 2014;9(1):e84619. doi:10.1371/journal.pone.0084619.
- Deng M, Scott MJ, Loughran P, Gibson G, Sodhi C, Watkins S, Hackam D, Billiar TR. Lipopolysaccharide Clearance, Bacterial Clearance, and Systemic Inflammatory Responses Are Regulated by Cell Type–Specific Functions of TLR4 during Sepsis. J Immunol. 2013;190(10):5152–5160. doi:10.4049/jimmunol.1300496.
- Chen C, Shah YM, Morimura K, Krausz KW, Miyazaki M, Richardson TA, Morgan ET, Ntambi JM, Idle JR, Gonzalez FJ. Metabolomics reveals that hepatic stearoyl-CoA desaturase 1 downregulation exacerbates inflammation and acute colitis. Cell Metab. 2008;7(2):135–147. doi:10.1016/j.cmet.2007.12.003.
- Weiner FR, Smith PJ, Wertheimer S, Rubin CS. Regulation of gene expression by insulin and tumor necrosis factor alpha in 3T3-L1 cells. Modulation of the transcription of genes encoding acyl-CoA synthetase and stearoyl-CoA desaturase-1. J Biol Chem. 1991;266:23525–23528.
- Chen P, Miyamoto Y, Mazagova M, Lee KC, Eckmann L, Schnabl B. Microbiota protects mice against acute alcohol‐induced liver injury. Alcohol Clin Exp Res. 2015;39(12):2313–2323. doi:10.1111/acer.12900.
- Clugston RD, Yuen JJ, Hu Y, Abumrad NA, Berk PD, Goldberg IJ, Blaner WS, Huang L-S. CD36-deficient mice are resistant to alcohol-and high-carbohydrate-induced hepatic steatosis. J Lipid Res. 2014;55(2):239–246. doi:10.1194/jlr.M041863.
- Biswas SK, Lopez-Collazo E. Endotoxin tolerance: new mechanisms, molecules and clinical significance. Trends Immunol. 2009;30(10):475–487. doi:10.1016/j.it.2009.07.009.
- Sly LM, Rauh MJ, Kalesnikoff J, Song CH, Krystal G. LPS-induced upregulation of SHIP is essential for endotoxin tolerance. Immunity. 2004;21(2):227–239. doi:10.1016/j.immuni.2004.07.010.
- Bala S, Tang A, Catalano D, Petrasek J, Taha O, Kodys K, Szabo G. Induction of Bcl‐3 by acute binge alcohol results in Toll‐like receptor 4/LPS tolerance. J Leukoc Biol. 2012;92(3):611–620. doi:10.1189/jlb.0112050.
- Jamaluddin M, Choudhary S, Wang S, Casola A, Huda R, Garofalo RP, Ray S, Brasier AR. Respiratory syncytial virus-inducible BCL-3 expression antagonizes the STAT/IRF and NF-κB signaling pathways by inducing histone deacetylase 1 recruitment to the interleukin-8 promoter. J Virol. 2005;79(24):15302–15313. doi:10.1128/JVI.79.24.15302-15313.2005.
- Glaros T, Fu Y, Xing J, Li L. Molecular mechanism underlying persistent induction of LCN2 by lipopolysaccharide in kidney fibroblasts. PLoS One. 2012;7(4):e34633. doi:10.1371/journal.pone.0034633.
- Barman M, Unold D, Shifley K, Amir E, Hung K, Bos N, Salzman N. Enteric salmonellosis disrupts the microbial ecology of the murine gastrointestinal tract. Infect Immun. 2008;76(3):907–915. doi:10.1128/IAI.01432-07.
- Weigmann B, Tubbe I, Seidel D, Nicolaev A, Becker C, Neurath MF. Isolation and subsequent analysis of murine lamina propria mononuclear cells from colonic tissue. Nat Protoc. 2007;2(10):2307. doi:10.1038/nprot.2007.315.
- Earley ZM, Akhtar S, Green SJ, Naqib A, Khan O, Cannon AR, Hammer AM, Morris NL, Li X, Eberhardt JM. Burn injury alters the intestinal microbiome and increases gut permeability and bacterial translocation. PLoS One. 2015;10(7):e0129996. doi:10.1371/journal.pone.0129996.