
ABSTRACT
Emerging evidence indicates that the gut microbiome can modulate metabolic homeostasis, and thus may influence the development of gestational diabetes mellitus (GDM). However, whether and how the gut microbiome and its correlated metabolites change in GDM is uncertain. Herein we compare the gut microbial compositions, and fecal and urine metabolomes, of 59 patients with GDM versus 48 pregnant healthy controls (HCs). We showed that the microbial and metabolic signatures of GDM patients were significantly different from those of HCs. Compared to HCs, the GDM subjects were characterized by enriched bacterial operational taxonomic units (OTUs) of the family Lachnospiraceae, and depleted OTUs of the families Enterobacteriaceae and Ruminococcaceae. Some altered gut microbes were significantly correlated with glucose values and fetal ultrasonography indexes. Moreover, we identified four fecal and 15 urine metabolites that discriminate GDM from HC. These differential metabolites are mainly involved in carbohydrate and amino acid metabolism. Significantly, co-occurrence network analysis revealed that Lachnospiraceae and Enterobacteriaceae bacterial OTUs formed strong co-occurring relationships with metabolites involved in carbohydrate and amino acid metabolism, suggesting that disturbed gut microbiome may mediate GDM. Furthermore, we identified a novel combinatorial marker panel that could distinguish GDM from HC subjects with high accuracy. Together our findings demonstrate that altered microbial composition and metabolic function may be relevant to the pathogenesis and pathophysiology of GDM.
Introduction
Gestational diabetes mellitus (GDM), the most common complication of pregnancy, is defined as glucose intolerance that is first identified during pregnancy.Citation1 GDM is closely linked with adverse maternal and neonatal outcomes.Citation2 For example, GDM greatly increases the risk of preeclampsia and delivery by cesarean section.Citation3,Citation4 In addition, GDM also increases the risk of infant morbidity such as diabetic fetopathy.Citation4 Several risk factors for GDM have been identified, such as higher maternal age and obesity.Citation5,Citation6 An imbalance between insulin resistance and insulin secretion has been implicated in the development of this disorder.Citation7 However, the underlying pathological mechanisms of GDM remain largely unknown.
The gut microbiome can greatly influence the host’s health and diseases.Citation8 Previously, dysbiotic gut microbiome has been implicated in the development of metabolic diseases such as obesity and type 2 diabetes (T2D).Citation9,Citation10 Pregnancy is accompanied by significant changes in metabolic status, and some pregnant women are predisposed to GDM onset. In addition, gut microbial composition and function have been shown to be altered during pregnancy.Citation11 Therefore, it is important to explore whether GDM is characterized by disturbances of gut microbial composition and function.
A few previous studies have explored how the gut microbial composition changes in GDM, with diverse findings.Citation12–15 This heterogeneity may result from differences in recruitment criteria, sequencing methods, and/or cohort demographics. For example, using fecal samples collected mainly at the time of delivery, Wang et al.Citation12 reported that GDM patients had significant disturbances of gut microbiome genera Prevotella and Streptococcus, relative to HCs. Interestingly, these disturbances of maternal gut microbiome in GDM individuals could be vertically transmitted to the next generation.Citation12 Ferrocino et al.Citation13 found that GDM individuals had enriched Blautia, Butyricicoccus, and Clostridium, as well as depleted Bacteroides, Collinsella and Rikenellaceae in the second (T2) relative to third trimesters (T3) of pregnancy. Crusell et al.Citation16 also reported substantial dysregulation of the GDM gut microbiome in the T3 and postpartum. They identified 17 species-level operational taxonomic units (OTUs) mostly belonging to the phylum Firmicutes, that could discriminate GDM individuals from healthy controls. In addition, probiotic interventions could improve the insulin resistance of GDM subjects.Citation17 These studies show that GDM is closely linked with disturbances of the gut microbiome. Disturbances of fecal and blood metabolic signatures were also reported in GDM.Citation18 Given that the gut microbiome modulates diverse host metabolic pathways, it is important to simultaneously characterize how microbial and metabolic signatures change and interact in GDM.
In this study, we used 16S ribosomal RNA (rRNA) gene sequencing metagenomics to compare the microbial compositions of GDM subjects and pregnant healthy controls (HCs). To capture functional readouts of microbial activity, fecal, and urine metabolomic analyses were performed. This integration of metagenomic and metabolomic methods has proven an effective way to uncover gut microbial composition and function in various diseases.Citation19 Using this well-established strategy, we compared the microbial and metabolic signatures of GDM patients versus HCs, to uncover their reciprocal interactions in the gut ecosystem of GDM. In addition, we examined correlations between the altered gut microbes, fecal and urine metabolites, and various clinical indexes (e.g. blood glucose values and outcomes of fetal ultrasonography). Based on these multi-omic data, we identified a novel combinatorial marker panel that could distinguish GDM from HC with high accuracy.
Results
Clinical characteristics of recruited subjects
In this study, we included a total of 59 patients with GDM and 48 HCs. There was no significant difference in the mean age (HC = 29.2, GDM = 30.6; p = .063) or body mass index (BMI) (HC = 20.5, GDM = 21.5; p = .070) between the two groups. At 12 weeks’ gestation, fasting blood glucose (FBG) levels were higher in the GDM group than in the HC group (GDM, 4.91 ± 0.39; HC, 4.70 ± 0.52, p = .021). Moreover, at 24–28 weeks’ gestation, fasting glucose, and 1- and 2-h post-oral glucose tolerance test (OGTT) glucose levels, were significantly elevated in GDM versus HC (all p-values<0.001). There were no group differences for remaining variables such as newborn weight, gestation week of delivery, and sampling. There was no difference between the two groups in major indexes of fetal ultrasonography such as biparietal diameter, head circumference, and abdominal circumference at 24, 30, and 37 weeks’ gestation. Interestingly, fetuses of GDM mothers had slightly shorter femur length at 37 weeks’ gestation (p = .049), compared to the HC group. The detailed clinical characteristics of the recruited individuals and the fetal ultrasonography outcomes are shown in .
Table 1. Detailed clinical characteristics of the recruited subjects
Maternal microbial diversity and composition are altered in GDM
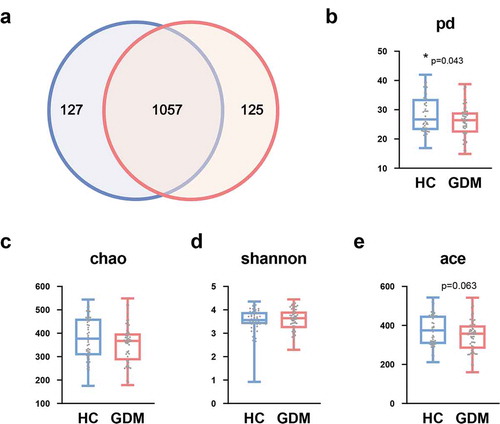
Here, 16S rRNA gene sequencing was used to compare the microbial composition of patients with GDM and HCs. In total, we identified 4,880,685 high-quality reads in 107 fecal samples with an average length of 412.39. These reads could be classified into 1309 bacterial OTUs. 1057 OTUs were shared between the GDM and HC groups, while 125 and 127 OTUs were unique to GDM and HC, respectively (). We then compared the α-diversity indexes between the two groups. We found that patients with GDM had a lower phylogenetic diversity (PD) index relative to HCs (p = .043, ). In contrast, the shannon, chao, and ace indexes showed no differences between the two groups ().
Figure 1. Lower phylogenetic diversity (PD) index in the GDM relative to HCs. (a) Venn diagram displaying that 1057 of 1309 OTUs were detected in the two groups, while 125 and 127 OTUs were unique to GDM subjects and HCs, respectively (n = 48, HC; n = 59, GDM). (b) α-phylogenetic diversity analysis showing that GDM group was characterized by lower phylogenetic diversity (PD) index relative to control group. (c-e) There was no difference of other three indexes (shannon, chao, and ace) between the two groups. Abbreviations: gestational diabetes mellitus, GDM; healthy controls, HCs; operational taxonomic units, OTUs
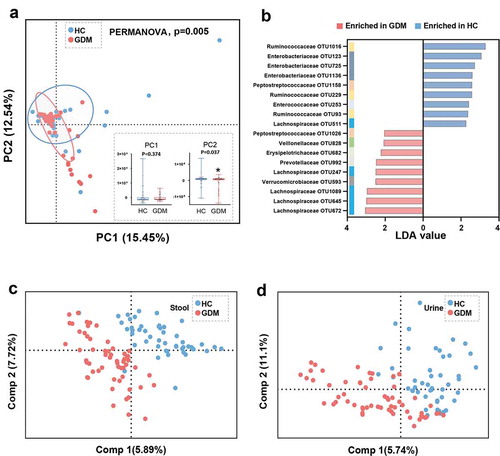
To explore whether the microbial composition of GDM subjects was different from that of HCs, β-diversity analysis was performed. To visualize the separation between the two groups, principal component analysis (PCA) was performed. We found that overall microbial composition was significantly different between the GDM and HC groups, as confirmed by PERMANOVA test (p = .005) (). This difference arose from the principal component (PC) 2 (p = .037), rather than PC1 (p = .374), of the PCA analysis ().
Figure 2. Gut microbial and metabolic characteristics of GDM relative to HCs. (a) At the OTU level, Principal Component analysis (PCA) showing a discriminative trend of microbial composition between patients with GDM and HCs (PERMANOVA, p = .005). In the PC2 not but PC1 of PCA, the GDM group was significantly different from the HC group. (b) Using linear discriminant analysis (LEfSe, LDA>2.0), 18 differential OTUs responsible for the discrimination between two groups were identified. These enriched OTUs in GDM group were primarily belonged to family Lachnospiraceae (OTU 247, 645, 672 and 1089); and these depleted OTUs were mainly assigned to family Enterobacteriaceae (OTU 123, 725 and 1136) and Ruminococcaceae (OTU 93, 229 and 1016). (c-d) The Partial least-squares discriminant analysis (PLS-DA) scores plot showing that the stool and urine metabolic signatures of GDM group were substantially different from that in HCs. (HC, n = 48; GDM, n = 59). Abbreviations: PC, Principal Component
The microbial signatures responsible for distinguishing GDM from HC
Next, Linear Discriminant Analysis Effect Size (LEfSe) was used to identify the key gut microbes responsible for distinguishing the GDM patients from HCs. In total, 18 differential OTUs were identified (, and Table S1). Compared to HCs, patients with GDM were characterized by nine enriched OTUs mainly belonging to the Lachnospiraceae family (4 OTUs: OTU 247, 645, 672, and 1089), and 9 depleted OTUs mainly of the Enterobacteriaceae (3 OTUs: OTU 123, 725, and 1136) and Ruminococcaceae (3 OTUs: OTU93, 229, and 1016) families. These 18 differential OTUs belonged primarily to the phyla Firmicutes (13/18, 72.2%) and Proteobacteria (3/18, 16.7%).
Maternal stool and urine metabolic signatures are altered in GDM
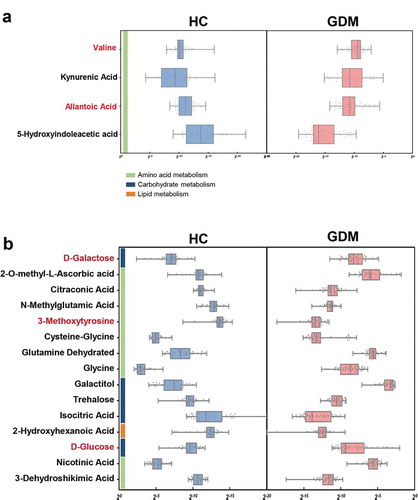
Since gut microbiota modulate their host’s metabolic pathways, we used GC-MS based metabolomics to compare the metabolic signatures of GDM subjects and HCs. The stool and urine metabolic signatures of GDM subjects were significantly different from that of HCs (). In total, four fecal metabolites were responsible for discriminating between the two groups. Relative to HCs, GDM patients were enriched in two metabolites and depleted in two metabolites, all of which were mainly involved in amino acid metabolism (, and Table S2). In the urine samples, 15 metabolites differed between the GDM and HC groups. Compared with HCs, GDM patients were characterized by three up-regulated and 12 down-regulated metabolites (, and Table S3). Functional clustering analysis showed that these urine metabolites were linked with amino acid and carbohydrate metabolism. Together, the stool and urine metabolomic analyses showed that GDM was characterized by disturbances of the host’s amino acid and carbohydrate metabolism.
Figure 3. Altered metabolites in fecal and urine samples of GDM. (a) Relative abundances of 4 fecal metabolites responsible for differentiation between the two groups. Compared to HCs, patients with GDM were characterized by 2 up-regulated metabolites (red) and 2 down-regulated metabolites (black). These metabolites were mainly involved in amino acid metabolism. (b) Similarly, GDM individuals were characterized by 3 up-regulated (red) and 12 down-regulated (black) urine metabolites relative to HCs (VIP>1, p < .05). These altered urine metabolites were mainly belonged to carbohydrate and amino acid metabolism
Maternal glucose values and fetal physical characteristics correlate with altered maternal gut bacteria in GDM
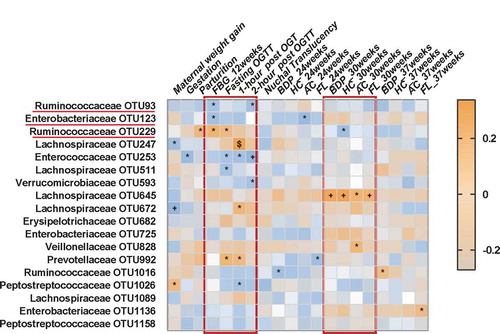
To further explore potential correlations of key clinical indexes with altered gut microbiome in GDM, correlation analysis was performed. Overall, four blood glucose values including fasting blood glucose (FBG) value at 12 weeks’ gestation, as well as fasting and 1- and 2-h post-OGTT blood glucose values at 24–28 weeks’ gestation, all showed substantial correlations with a panel of bacterial OTUs (). For example, two bacterial OTUs (Enterobacteriaceae_OTU 123 and Ruminococcaceae_OTU 93) were negatively correlated, and one bacterial OTU (Ruminococcaceae_OTU 229) was positively correlated, with FBG level at 12 weeks’ gestation. This finding suggests the potential predictive value of this microbial panel for GDM. Moreover, at 24–28 weeks’ gestation, two OTUs (229,992) were positively and two OTUs (253,511) were negatively correlated with fasting OGTT blood glucose values; three OTUs (247,672 and 992) were positively and one OTU (253) negatively correlated with 1-h post-OGTT glucose values; and three OTUs (93,253 and 593) were negatively correlated with 2-h post-OGTT glucose values (). Significantly, we found that Lachnospiraceae_OTU 645 was positively correlated with four indexes of fetal ultrasonography taken at 30 weeks’ gestation, including abdominal circumference, femur length, biparietal diameter, and head circumference. Importantly, these findings suggest gut microbiome disturbances are highly correlated with maternal blood glucose values and fetal physical characteristics as measured by fetal ultrasonography.
Figure 4. Associations among glucose values, fetal ultrasonography indexes and altered gut bacteria. Heat map of the Spearman’s rank correlation coefficient of 20 clinical indexes and 18 gut bacterial OTUs adjusted with age and BMI. Different kinds of blood glucose values at 12 weeks’ (FBG level) and 24–28 weeks’ (OGTT) gestation showed substantial correlations with a panel of bacterial OTUs such as two OTUs belonged to Lachnospiraceae (OTU 93, 123). In addition, some of bacterial OTUs (eg. Lachnospiraceae OTU 645) were also correlated with the indexes of fetal ultrasonography such as abdominal circumference and femur length at 30 weeks’ gestation. Brown squares and blue squares indicate positive and negative associations, respectively. The statistical significance was denoted on the squares (*P < .05; +P < .01; $P < .001). Abbreviation: OGTT, Oral glucose tolerance test; FBG, Fasting blood glucose; BPD, Biparietal diameter; HC, Head circumference; AC, Abdominal circumference; FL, Femur length
Co-occurrence network analysis of altered maternal gut bacteria, fecal and urine metabolites, and blood glucose levels
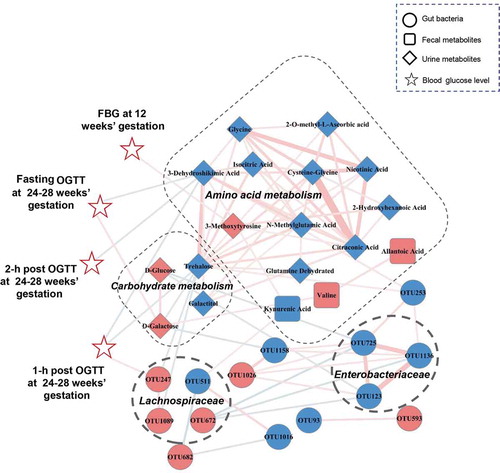
To explore potential reciprocal interactions between altered gut bacteria, fecal and urine metabolites, and glucose values, a co-occurrence network was constructed based on Spearman correlation analysis. We found that bacterial OTUs from the Enterobacteriaceae and Lachnospiraceae families formed strong co-occurring relationships with fecal and urine metabolites involved with carbohydrate and amino acid metabolism (). The metabolites involved with carbohydrate metabolism were also strongly correlated with those related to amino acid metabolism. For example, Trehalose, which was broadly correlated with carbohydrate and amino acid metabolites, was a vital node between the two metabolic pathways within this co-expression network. Other metabolites, and bacterial Lachnospiraceae_OTU247, were correlated with FBG at 12 weeks’ gestation or OGTT blood glucose at 24–28 weeks’ gestation. These findings suggest that altered gut microbes and host metabolites formed a synergistic and nodal co-occurrence network in GDM ().
Figure 5. A co-occurrence network constructed from the relative abundances of differential bacterial OTUs, fecal and urine metabolites as well as blood glucose values in GDM subjects versus HCs. The spearman correlation analysis was used to explore the co-occurrence network. The relevant networks with Spearman’s correlation (r) > 0.25 or < −0.25 were shown. Overall, bacterial OTUs belonged to families Enterobacteriaceae and Lachnospiraceae formed strong co-occurring relationships with metabolites assigned to carbohydrate and amino acid metabolism. In addition, within this co-expression network, some of metabolites and bacterial OTU (Lachnospiraceae_OTU 247) also showed significant correlations with glucose values of FBG at 12 weeks’ gestation or OGTT at 24–28 weeks’ gestation. These characteristic co-expression network formed synergistic relationships in GDM. Size of the nodes represents the fold changes (GDM relative to HC) of these variables. Red and blue dots indicate the increased and decreased relative abundances of variables in GDM subjects relative to HCs, respectively. Edges between nodes indicate Spearman’s negative (light blue) or positive (light red) correlation, edges thickness indicate range of p value (p < .01). Abbreviations: fasting blood glucose, FBG; oral glucose tolerance test, OGTT
Microbial and metabolic markers can discriminate GDM from HC with high accuracy
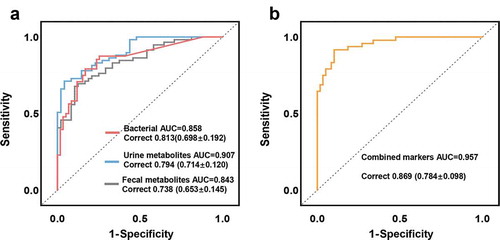
Random forest analysis was used to explore whether microbial and metabolic markers can be used to discriminate subjects with GDM from HCs. We found that individual marker panels of key bacterial OTUs, urine metabolites, or fecal metabolites could distinguish GDM from HC with area under the curve (AUC) values ranging from 0.843 to 0.907 (bacteria: Enterobacteriaceae_OTU123 and Enterococcaceae_OTU253, AUC = 0.858; urine metabolites: Trehalose and 3-dehydroshikimic acid, AUC = 0.907; fecal metabolites: 5-Hydroxyindoleacetic acid and valine, AUC = 0.843) (). Moreover, we found that a combinatorial marker panel comprised of these six biomarkers could even more effectively differentiate GDM from HC (AUC = 0.957) (), than could any individual panel alone. We also calculated the positive and negative predictive values of this combined marker, since these diagnostic sensitivity and specificity measures are commonly used in clinical practice. We found that this combinatorial marker panel could discriminate GDM subjects from HCs with positive a predictive value of 82.6%, and a negative predictive value of 94.7%. The diagnostic performance of these marker panels was also validated by 10-fold cross-validation (), confirming their generalizability to GDM diagnosis.
Figure 6. Microbial and metabolic markers for discriminating GDM subjects from HCs. (a) Random forest analysis was used to quantify diagnostic performance of biomarker panels. Individual marker panels could distinguish patients with GDM and HC subjects with an area under the curve (AUC) ranging from 0.843 to 0.907, and the correct rate is 0.738 to 0.813 (bacteria: Enterobacteriaceae_OTU123, Enterococcaceae_OTU253, AUC = 0.858; urine metabolites: Trehalose and 3-dehydroshikimic acid, AUC = 0.907; fecal metabolites: 5-Hydroxyindoleacetic acid and valine, AUC = 0.843). (b) This combinatorial marker panel including these 6 markers yielded more robust diagnostic performance over that of separate microbial or metabolic markers (AUC = 0.957; correct rate: 0.869). The correct rates in brackets were calculated from the 10-fold cross-validation; the error values reflect the standard deviation of the correct rates
Discussion
In this study, we examined gut microbiome composition, and fecal and urine metabonomics, in GDM and HC expectant mothers. We further analyzed correlations between gut microbes and metabolites, and clinical indexes. We found that patients with GDM were characterized by enriched Lachnospiraceae, and depleted Enterobacteriaceae and Ruminococcaceae, as well as disturbances of fecal and urine amino acid and carbohydrate metabolism. Moreover, bacterial OTUs from the Enterobacteriaceae and Lachnospiraceae families formed strong co-occurring relationships with several metabolites involved with host carbohydrate metabolism. In addition, we identified a novel combinatorial marker panel that could distinguish the GDM individuals from HCs with high accuracy. Our findings suggest that gut microbiota disturbances could potentially contribute to GDM pathogenesis by modulating the host’s amino acid and carbohydrate metabolism, which provides a new avenue by which to understand the basis of GDM.
We identified 18 differential bacterial OTUs responsible for this discrimination, which were primarily from the phyla Firmicutes (72.2%). Interestingly, a previous study found that major dysregulations of 17 bacterial OTUs in third trimester GDM subjects were also assigned to Firmicutes (88.2%).Citation16 Together, this study and ours demonstrate that alterations of Firmicutes are a hallmark of GDM. Further studies are needed to identify the specific Firmicutes bacterial strains involved, and uncover their roles in GDM. For example, exploration of whether fecal microbial transplants of candidate bacteria into germ-free mice can modulate blood glucose levels may be useful.
In addition, we found that compared to HCs, GDM subjects had enriched Lachnospiraceae family OTUs, and depleted Enterobacteriaceae and Ruminococcaceae family OTUs. Consistent with these findings, a previous animal study reported that Lachnospiraceae OTUs were positively associated with serum glucose levels.Citation20 Significantly, Qin et al.Citation10 reported that gut Lachnospiraceae bacteria showed a positive correlation with type 2 diabetes mellitus (T2D). Here, we also found that two Lachnospiraceae OTUs (247 and 672) were positively correlated with 1-h post-OGTT glucose values at 24–28 weeks’ gestation. In contrast, we found lower Enterobacteriaceae abundance in GDM individuals relative to HCs. Enterobacteriaceae are facultative aerobes that anaerobically degrade sugars. These findings suggest that enriched Lachnospiraceae and depleted Enterobacteriaceae may synergistically contribute to higher glucose levels in GDM.
Previously, using untargeted metabolic profiling, Zhao et al.Citation21 found that the overall fecal metabolomic signature of GDM was distinct from that of HC. They also found that fecal amino acid levels (e.g. leucine and alanine) were disrupted in patients with GDM. In line with these findings, disturbances of serum branched chain amino acids (e.g. alanine, glutamate, and serine) were also observed in GDM.Citation22,Citation23 In addition, Jiang et al.Citation24 showed that changes in amino acids levels (isoleucine, tyrosine, and alanine) could predict subsequent incidence of GDM. These findings suggest potential critical roles for peripheral amino acid metabolism in the development of GDM, although the outcomes were relatively diverse. Here, we observed that GDM was characterized by disturbances of gut microbiota, and fecal and urine metabolomics. Furthermore, co-expression network analysis showed that alterations of bacterial OTUs were substantially correlated with glucose levels, as well as fecal and urine metabolites related to amino acid and carbohydrate metabolism. Prior evidence has consistently linked gut microbiome disturbances with T2D onset, via modulation of the host’s amino acid and carbohydrate metabolism.Citation25,Citation26 These findings suggest that disturbances of the gut microbiome may affect the occurrence of GDM and T2D through shared metabolic pathways. Further metabolomic studies are needed to identify the specific microbial metabolites and pathways involved in diabetic onset and pathology.
Within this co-expression network, we found that the Enterobacteriaceae and Lachnospiraceae families formed strong co-occurring relationships with fecal and urine metabolites assigned to carbohydrate and amino acid metabolism. In addition, we found that Lachnospiraceae_OTU247 was positively correlated with 1-h post-OGTT glucose blood levels at 24–28 weeks’ gestation. These findings imply synergistic relationships between altered gut microbes and the host’s metabolism in GDM. Based on these findings, animal experiments to further identify the key gut microbial strains that regulate blood glucose would be of great value, and may lead to new therapeutic strategies for GDM.
Currently, machine learning such as random forest analysis is increasingly used in the medical diagnostics field.Citation27,Citation28 Using this strategy, here we found that separate microbial or metabolic markers could effectively discriminate the GDM individuals from HCs. Moreover, a combinatorial marker panel could distinguish GDM individuals from HCs with a positive predictive value of 82.6%, and a negative predictive value of 94.7%. These findings suggest that, similar to OGTT, both individual and combinatorial biomarker panels have noninvasive diagnostic potential for GDM. As all individuals were recruited from the same site for this study, another clinical study using larger multicenter samples should be performed to validate this diagnostic performance before further clinical advancement. The OGTT has been recommended to diagnose patients with GDM at 24–28th gestational weeks; however, OGTT is a relatively time consuming and invasive diagnostic method. As such, the novel potential diagnostic method based on our identified biomarkers for GDM, as described herein, may be a promising alternative.
Interestingly, we also found that bacterial OTUs (e.g. Enterobacteriaceae_OTU 123 and Ruminococcaceae_OTU 93) were correlated with FBG level at 12 weeks’ gestation. Currently, GDM is always diagnosed at 24–28th gestational weeks. Thus, our findings suggest that gut microbes may be able to predict GDM onset even earlier, which would allow for earlier identification and treatment of these high-risk individuals during the first trimester of pregnancy, and better treatment outcomes.
Our study is not without limitations. First, our findings cannot conclusively determine whether there is a causal relationship between gut microbiome dysbiosis and GDM, which should be further confirmed by fecal transplantation experiments. In addition, further animal studies should be carried out to explore how the interactions of bacterial species and metabolites may affect the occurrence or onset of GDM. Due to the relatively limited resolution of the 16S rRNA sequencing method, further study using a high-resolution shotgun metagenomic sequencing method should be performed to identify the specific microbial species for GDM. It would also be interesting to perform dynamic metagenomic and metabolomic analyses, to uncover how the gut microbiome and its modulated metabolic pathways dynamically change in GDM.
Taken together, using multi-omics data, we outlined the landscapes and interaction networks of altered bacteria, and fecal and urine metabolites, in GDM. We found that disturbances of the gut microbiome may participate in the development of GDM through modulating the host’s carbohydrate and amino acid metabolism. Moreover, we identified a novel combinatorial marker panel that can discriminate GDM from HC with high accuracy. Our findings provide new directions to understand the occurrence of GDM, and the potential to develop a new diagnostic method by which to noninvasively screen for GDM in expectant mothers.
Materials and methods
Subject recruitment and sample collection
The study protocol was approved by the Ethics Committee of The First Affiliated Hospital of Chongqing Medical University. All participants signed a written informed consent before any procedure was performed. The diagnosis of GDM was performed based on the 75 g oral glucose tolerance test (OGTT) at 24–28th gestational weeks with following criterion:Citation29 (i) without a history of diabetes; (ii) meeting one of the criteria: fasting blood glucose (FBG) ≥5.1 mmol/L or 1 h OGTT glucose values ≥10.0 mmol/L or 2 h OGTT glucose values ≥8.5 mmol/L. Correspondingly, the pregnant women who have normal glucose levels in OGTT were designated as healthy controls (HCs). All participants have no other complications of pregnancy, diarrhea, and other gastrointestinal symptoms when the samples were collected. And the gestation fetuses have no chromosomal and structural abnormalities. All participants did not take any antibiotics, probiotics, or prebiotics within 1 month prior to sampling. The indexes of fetal ultrasonography were acquired using the GE Voluson E8. Fetal Nuchal Translucency (NT) is measured from 11 weeks to 13 weeks and six days by transabdominally to assess the risks of Down’s syndrome and other chromosomal abnormalities. A mid sagittal section image of the fetus is required, and the magnification of fetal head and upper thorax image should occupy the whole screen. The two hyperechoic bands on the back of the fetus should be measured at the widest part of the NT. Generally, fresh stool samples were collected from participants at 7:00–12:00 AM in our hospital, and frozen at −80 C until further analysis.
DNA extraction, PCR amplification, and Illumina MiSeq sequencing
The Illumina MiSeq sequencing protocol was performed as we previously described.Citation30,Citation31 Briefly, microbial DNA was extracted from frozen stool samples using the OMEGA-soil DNA Kit (Omega Bio-Tek, USA) following manufacturer’s protocols. The V3-V4 regions of the bacterial 16S rRNA gene were amplified by PCR using primers 338 F (5ʹ-ACTCCTACGGGAGGCAGCA-3ʹ) and 806 R (5ʹ-GGACTACHVGGGTWTCTAAT-3ʹ). PCR reactions were performed in triplicate 20 μl mixtures. Primers included an eight-base sequence unique to each sample. Amplicons were extracted from 2% agarose gels and purified using the AxyPrep DNA Gel Extraction Kit (Axygen Biosciences, Union City, CA). Purified amplicons were quantified using QuantiFluor™-ST (Promega, US) and paired-end sequenced (2 × 250) on an Illumina MiSeq platform according to the standard protocols.
16S rRNA gene sequence analysis
Raw fastq files were demultiplexed, and quality-filtered using QIIME (version 1.17, http://qiime.org/). The 250 bp reads were truncated at any site of more than three sequential bases receiving an average quality score <20. Reads shorter than 50 bp containing ambiguous base calls or barcode/primer errors were discarded. Chimeric sequences were checked by UCHIME and removed from subsequent analyses. The remaining high-quality sequences were clustered into operational taxonomic units (OTUs) at 97% similarity. α-diversity was assessed using the species richness indexes (Ace and Chao) and species diversity indexes (Shannon, Phylogenetic diversity). Principal component analysis (PCA) was used to visually evaluate the overall difference and similarity of bacterial communities between GDM and HC groups. To test statistical significance, the Kruskal–Wallis test was used for the two Principal Components (PC) derived from the PCA model. In addition, the permutational multivariate analysis of variance (PERMANOVA) was used to test group differences.Citation31 The key bacterial taxa responsible for discrimination between the two groups were identified using linear discriminant analysis (LEfSe) with linear discriminant analysis (LDA) >2.0.Citation32
Fecal and urine metabolome analysis
Gas chromatography-mass spectrometry (GC/MS; Agilent 7890A/5975 C) was used to characterize the fecal and urine metabolic signatures as our previously published studies.Citation33,Citation34 Briefly, an HP-5 MS fused-silica capillary column was used to separate the derivatives. Helium was used as the carrier gas at a constant flow rate of 1.0 mL/min through the column. The injector temperature was maintained at 280°C. The obtained MS data were further analyzed by ChromaTOF software. The metabolites were identified by the Fiehn database. The GC/MS three-dimensional matrices comprised of peak indexes (RT-m/z pairs), sample names (observations), and normalized peak area percentages were imported into SIMCA-P + 14.0 (Umetrics, Umeå, Sweden). Projection to latent structure discriminant analysis (PLS-DA) was used to distinguish the GDM subjects from HCs.Citation35 By analysis of PLS-DA loadings, the differential metabolites attributing to the discrimination between the two groups were identified (variable importance plot (VIP) >1.0, and p-values <0.05). Pathway analyses were carried out based on Kyoto Encyclopedia of Genes and Genomes (KEGG) Pathway Database.
Statistical analysis
Statistical analyses were carried out using SPSS version 18 (SPSS, Chicago, IL, US). The continuous variables such as bacterial relative abundance and age were presented as mean ± standard error (SD) unless otherwise indicated and compared between groups using Student’s t-test. Categorical data (eg.sex) were analyzed by Chi-square test. Statistical significance level was set at P < .05. The co-occurrence network was constructed based on the relative abundance of bacterial OTUs, fecal and urine metabolites related to GDM, as well as the clinical indexes using the Spearman’s correlation coefficient (r > 0.25 or < −0.25; p < .05). The generated co-occurrence network was visualized in Cytoscape. Random forest classifier (Python’s scikit-learn package) was performed to predict the discrimination between GDM and HCs.Citation27 In each case, 500 trees were considered (other scikit-learn defaults were left unchanged) The receiver operating characteristic (ROC) curve was obtained (SPSS V.19.0) for the display of the constructed models, then the area under the ROC curve (AUC) was used to designate the ROC effect. Internal validation was performed by 10-fold cross-validation.
Disclosure of Potential Conflicts of Interest
No potential conflicts of interest were disclosed.
Author contributions
Designed the experiments: P.Z., and H.B.Q. Performed the microbiome analysis: X.W., H.L.L., and Y.F.L. Performed the metabolomic analysis: P.Z., and X.W. Collected the clinical samples: X.W., H.L.L. S.H; L.Z; and C.Y.C. Drafted the manuscript: X.W. Revised the manuscript for intellectual content: P.Z., H.B.Q, P.N.B. and C.T.
Supplemental Material
Download MS Word (92 KB)Acknowledgments
Our sincere gratitude is extended to Professor Seth W. Perry for his effort in polishing the manuscript. This work was supported by the National Key R&D Program of China (2016YFC1000407), Key Program of International (Regional) Cooperation of NSFC (81520108013), and the Natural Science Foundation Project of China (81971296, 81771490, 81371310, 81971271), and Chongqing Science &Technology Commission (cstc 2019 jcyjjqX0009).
Supplementary material
Supplemental data for this article can be accessed on the publisher’s website.
Additional information
Funding
References
- Kjos SL, Buchanan TA. Gestational diabetes mellitus. N Engl J Med. 1999;341:1749–1756.
- Metzger BE, Coustan DR, Trimble ER. Hyperglycemia and adverse pregnancy outcomes. Clin Chem. 2019;65:937–938.
- Ostlund I, Haglund B, Hanson U. Gestational diabetes and preeclampsia. Eur J Obstet Gynecol Reprod Biol. 2004;113:12–16.
- Billionnet C, Mitanchez D, Weill A, Nizard J, Alla F, Hartemann A, Jacqueminet S. Gestational diabetes and adverse perinatal outcomes from 716,152 births in France in 2012. Diabetologia. 2017;60:636–644.
- Lao TT, Ho LF, Chan BC, Leung WC. Maternal age and prevalence of gestational diabetes mellitus. Diabetes Care. 2006;29:948–949.
- Moore Simas TA, Waring ME, Callaghan K, Leung K, Ward Harvey M, Buabbud A, Chasan-Taber L. Weight gain in early pregnancy and risk of gestational diabetes mellitus among Latinas. Diabetes Metab. 2019;45:26–31.
- Kampmann U, Madsen LR, Skajaa GO, Iversen DS, Moeller N, Ovesen P. Gestational diabetes: a clinical update. World J Diabetes. 2015;6:1065–1072.
- Clemente JC, Ursell LK, Parfrey LW, Knight R. The impact of the gut microbiota on human health: an integrative view. Cell. 2012;148:1258–1270.
- Turnbaugh PJ, Ley RE, Mahowald MA, Magrini V, Mardis ER, Gordon JI. An obesity-associated gut microbiome with increased capacity for energy harvest. Nature. 2006;444:1027–1031.
- Qin J, Li Y, Cai Z, Li S, Zhu J, Zhang F, Liang S,Zhang W,Guan Y,Shen D, et al. A metagenome-wide association study of gut microbiota in type 2 diabetes. Nature. 2012;490:55–60.
- Koren O, Goodrich JK, Cullender TC, Spor A, Laitinen K, Backhed HK, Gonzalez A., Werner J.J, Angenent L.T, Knight R. Host remodeling of the gut microbiome and metabolic changes during pregnancy. Cell. 2012;150:470–480.
- Wang J, Zheng J, Shi W, Du N, Xu X, Zhang Y, Ji P, Zhang F, Jia Z., Wang Y, et al. Dysbiosis of maternal and neonatal microbiota associated with gestational diabetes mellitus. Gut. 2018;67:1614–1625.
- Ferrocino I, Ponzo V, Gambino R, Zarovska A, Leone F, Monzeglio C, Goitre I, Rosato R, Romano A, Grassi G, et al. Changes in the gut microbiota composition during pregnancy in patients with gestational diabetes mellitus (GDM). Sci Rep. 2018;8:12216.
- Kuang YS, Lu JH, Li SH, Li JH, Yuan MY, He JR, Chen NN, Xiao WQ, Shen SY, Qiu L, et al. Connections between the human gut microbiome and gestational diabetes mellitus. Gigascience. 2017;6:1–12.
- Hasan S, Aho V, Pereira P, Paulin L, Koivusalo SB, Auvinen P, Eriksson, J.G. Gut microbiome in gestational diabetes: a cross-sectional study of mothers and offspring 5 years postpartum. Acta Obstet Gynecol Scand. 2018;97:38–46.
- Crusell MKW, Hansen TH, Nielsen T, Allin KH, Ruhlemann MC, Damm P, Vestergaard H, Rørbye C, Jørgensen NR, Christiansen OB, et al. Gestational diabetes is associated with change in the gut microbiota composition in third trimester of pregnancy and postpartum. Microbiome. 2018;6:89.
- Dolatkhah N, Hajifaraji M, Abbasalizadeh F, Aghamohammadzadeh N, Mehrabi Y, Abbasi MM. Is there a value for probiotic supplements in gestational diabetes mellitus? A randomized clinical trial. J Health Popul Nutr. 2015;33:25.
- Liu H, Pan LL, Lv S, Yang Q, Zhang H, Chen W, Lv Z. and Sun J. Alterations of gut microbiota and blood lipidome in gestational diabetes mellitus with hyperlipidemia. Front Physiol. 2019;10:1015.
- Zheng P, Li Y, Wu J, Zhang H, Huang Y, Tan X, Pan J, Duan J, Liang W, Yin B, et al. Perturbed microbial ecology in myasthenia gravis: evidence from the gut microbiome and fecal metabolome. Adv Sci (Weinh). 2019;6:1901441.
- Huang X, Fang S, Yang H, Gao J, He M, Ke S, Zhao Y, Chen C, Huang L. Evaluating the contribution of gut microbiome to the variance of porcine serum glucose and lipid concentration. Sci Rep. 2017;7:14928.
- Zhao C, Ge J, Li X, Jiao R, Li Y, Quan H, Li J, Guo Q, Wang W. Integrated metabolome analysis reveals novel connections between maternal fecal metabolome and the neonatal blood metabolome in women with gestational diabetes mellitus. Sci Rep. 2020;10:3660.
- Hou W, Meng X, Zhao A, Zhao W, Pan J, Tang J, Huang Y, Li H, Jia W, Liu F, et al. Development of multimarker diagnostic models from metabolomics analysis for gestational diabetes mellitus (GDM). Mol Cell Proteomics. 2018;17:431–441.
- Bentley-Lewis R, Huynh J, Xiong G, Lee H, Wenger J, Clish C, Nathan D, Thadhani R, Gerszten R. Metabolomic profiling in the prediction of gestational diabetes mellitus. Diabetologia. 2015;58:1329–1332.
- Jiang R, Wu S, Fang C, Wang C, Yang Y, Liu C, Hu J, Huang Y. Amino acids levels in early pregnancy predict subsequent gestational diabetes. J Diabetes. 2020;12:503–511.
- Karlsson FH, Tremaroli V, Nookaew I, Bergstrom G, Behre CJ, Fagerberg B, Nielsen J, Bäckhed F. Gut metagenome in European women with normal, impaired and diabetic glucose control. Nature. 2013;498:99–103.
- Wu H, Esteve E, Tremaroli V, Khan MT, Caesar R, Manneras-Holm L, Ståhlman M, Olsson LM, Serino M, Planas-Fèlix M, et al. Metformin alters the gut microbiome of individuals with treatment-naive type 2 diabetes, contributing to the therapeutic effects of the drug. Nat Med. 2017;23:850–858.
- Oh TG, Kim SM, Caussy C, Fu T, Guo J, Bassirian S, Singh S, Madamba EV, Bettencourt R, Richards L, et al. A universal gut-microbiome-derived signature predicts cirrhosis. Cell Metab. 2020 Nov 3;32(5):878-88.
- Ren Z, Li A, Jiang J, Zhou L, Yu Z, Lu H, Xie H, Chen X, Shao L, Zhang R, et al. Gut microbiome analysis as a tool towards targeted non-invasive biomarkers for early hepatocellular carcinoma. Gut. 2019;68:1014–1023.
- Potter JM, Hickman PE, Oakman C, Woods C, Nolan CJ. Strict preanalytical oral glucose tolerance test blood sample handling is essential for diagnosing gestational diabetes mellitus. Diabetes Care. 2020;43:1438–1441.
- Zheng P, Zeng B, Liu M, Chen J, Pan J, Han Y, Liu Y, Cheng K, Zhou C, Wang H, et al. The gut microbiome from patients with schizophrenia modulates the glutamate-glutamine-GABA cycle and schizophrenia-relevant behaviors in mice. Sci Adv. 2019;5:eaau8317.
- Zheng P, Yang J, Li Y, Wu J, Liang W, Yin B, Tan X, Huang Y, Chai T, Zhang H, et al. Gut microbial signatures can discriminate unipolar from bipolar depression. Adv Sci (Weinh). 2020;7:1902862.
- Segata N, Izard J, Waldron L, Gevers D, Miropolsky L, Garrett WS, Huttenhower C. Metagenomic biomarker discovery and explanation. Genome Biol. 2011;12:R60.
- Xu XJ, Zheng P, Ren GP, Liu ML, Mu J, Guo J, Cao D, Liu Z, Meng HQ, Xie P. 2,4-Dihydroxypyrimidine is a potential urinary metabolite biomarker for diagnosing bipolar disorder. Mol Biosyst. 2014;10:813–819.
- Zheng P, Chen JJ, Zhou CJ, Zeng L, Li KW, Sun L, Liu ML, Zhu D, Liang ZH, Xie P. Identification of sex-specific urinary biomarkers for major depressive disorder by combined application of NMR- and GC-MS-based metabonomics. Transl Psychiatry. 2016;6:e955.
- Worley B, Halouska S, Powers R. Utilities for quantifying separation in PCA/PLS-DA scores plots. Anal Biochem. 2013;433:102–104.