
 ?Mathematical formulae have been encoded as MathML and are displayed in this HTML version using MathJax in order to improve their display. Uncheck the box to turn MathJax off. This feature requires Javascript. Click on a formula to zoom.
Abstract
This paper investigates green buildings and organizational performance, using financial services companies (FSCs) located in green and non-green buildings. Returns of low, moderate, and high-risk investment products were used to underpin organizational performance. FSCs based in green buildings on average outperformed their competitors in non-green buildings. One statistically significant relationship (high-risk fund) was found when assessing returns and IEQ. Average green return ratios (AGRRi) determined the discount/premium of the incremental return per IEQ point of a FSC based in green building(s). However, there were individual FSCs located in non-green buildings that outperformed some of the FSCs based in green buildings.
Introduction
This research is underpinned by the proposition of Nurick and Thatcher (Citation2021) that green building features and initiatives (GBFIs), specifically enhanced indoor environmental quality (IEQ), result in increased individual productivity and organizational performance. There is still much conjecture amongst previous researchers regarding the notion that green buildings result in increased productivity, although this outcome is often claimed by the various green building councils. Multiple researchers have debated and struggled to fully establish the relationship between green buildings and individual productivity, and ultimately enhanced organizational performance (Byrd et al., Citation2016; Feige et al., Citation2013; Rasheed & Byrd, Citation2017; Thatcher & Milner, Citation2016). Some of the methods that have focused on productivity have applied several approaches, which include inter alia building user surveys (BUS), post-occupancy evaluations (POE), longitudinal studies, and simulated office experiments, usually in laboratories. All these approaches have usually focused on the actual knowledge worker versus the overall organization, which either performs (or not), based on pre-determined industry defined metrics (Akimoto et al., Citation2010; Biron et al., Citation2006; Chadburn et al., Citation2017; Fisk et al., Citation2011; Wyon, Citation2004).
Rationale
The emergence of green building councils started to appear in the late 1990s. One of the mandates of these councils was to develop a tool to measure/assess potential green certified buildings. This required a set of standard categories within green building tools, which included electricity, water, management, transport, materials, land use, emissions, innovation, and internal environmental quality (IEQ) (Green Building Council of South Africa (GBCSA), Citation2015; United Kingdom Green Building Council (UKGBC), Citation2015; United States Green Building Council (USGBC), Citation2015). The GBCSA uses Green Star South Africa as the tool to measure office buildings, where a building is considered green certified if it achieves four, five, or six stars (Green Building Council of South Africa (GBCSA), Citation2015). The benefits of green building, more specifically GBFIs, have been demonstrated from a building operations perspective, in term of utility savings, and how this benefits both the owner and the tenant. Measuring utility savings is relatively simple and therefore it is easy to establish if an individual or group of GBFIs results in a long-term financial benefit. Assessing individual productivity levels of building occupants is more challenging and linking individual productivity levels to organizational performance adds a further layer of complexity. Attempting to link GBFIs (specifically enhanced IEQ) to organizational performance has to date not been fully established within the research community. There have been some researchers (Byrd et al., Citation2016) that have debated the accuracy of measuring productivity and these inaccuracies have falsely been attributed to the notion that enhanced IEQ results in improved productivity. Furthermore, a literature review conducted by Rasheed and Byrd (Citation2017) indicated that self-evaluation is not an accurate approach with regards to productivity in an office environment within the context of IEQ. Feige et al. (Citation2013) indicated that improved occupant comfort, as a result of enhanced IEQ can reduce the turnover rate of an organization, which may have a positive impact on the financial performance of the organization. However, Feige et al. (Citation2013) were unable to fully confirm a link between occupant comfort and productivity and were unable to provide evidence that if occupants were more productive then this would lead to financial gains for the organization. It should be noted that much of the literature examining office occupants within the context of IEQ use the term “performance” in relation to the individual occupant (i.e., individual productivity as it is defined in this paper) and not in relation to the overall organization. The research indicates that there is currently very little literature that specifically attempts to establish a relationship between GBFIs (i.e., enhanced IEQ) and organizational performance. Another indicating factor is that past researchers have been unable to link individual productivity to organizational performance (Feige et al., Citation2013; Flamholtz, Citation2009; Kampschroer et al., Citation2007), which further highlights the difficulty of exhibiting direct links of enhanced IEQ to individual productivity through to improved organizational performance.
The rationale underpinning this research is based on the model developed by Nurick and Thatcher (Citation2021), specifically the section below the dotted line that focuses on the organization, as shown in . The focal point of this paper is the link between individual productivity and organizational performance, i.e., cross-over of the dotted line. The reason for highlighting this linkage is due to green building advocates stating, albeit with mixed supporting empirical evidence (MacNaughton et al., Citation2015; Park & Yoon, Citation2011; Tanabe et al., Citation2015; Zhang et al., Citation2010), that green buildings result in increased productivity. Assuming that this is the case, then increased productivity should equate to enhanced organizational performance. If it could be established that organizational performance was to be enhanced because of superior IEQ, then this would benefit both the building owner (reducing the asset risk) and tenant, which would therefore ultimately justify the implementation of GBFIs (or at least an investment in IEQ features). The model shows that that the performance level also is influenced by leadership and the economy (Prouska et al., Citation2016; Saleem et al., Citation2019) and is partially assessed by absenteeism and turnover. Ultimately organizational performance level is measured by financial gain (increased ROI), that if linked to enhanced IEQ, would justify the implementation of specific GBFIs, as this would also add value to the building from an owner/occupier perspective.
Figure 1. Linking GBFIs to individual productivity and organizational performance (Nurick & Thatcher, Citation2021, p. 29).
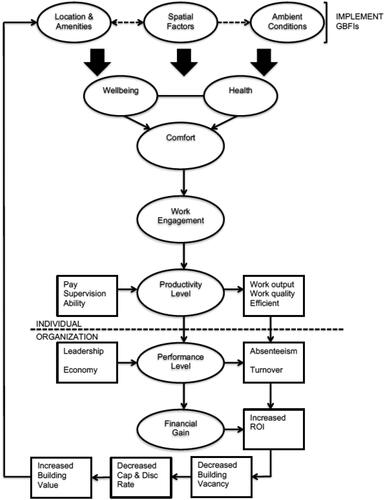
While there has been previous research (Akimoto et al., Citation2010; Alker et al., Citation2014; Clements-Croome & Baizhan, Citation2000; Feige et al., Citation2013; Garnys & Wargocki Citation2015; Heerwagen, Citation2000; Mallawaarachchi et al., Citation2016; Citation2017; Miller et al., Citation2009; Newsham et al., Citation2017; Singh et al., Citation2010; Thatcher & Milner, Citation2014; Wyon, Citation2004) that has focused on the relationship between green buildings and individual productivity, there has yet to be research that links green certified office buildings, more specifically enhanced IEQ, to overall organizational performance. The reason for a lack of research that specifically focuses on organizational performance in the context of GBFIs is that developing a robust generic performance measurement framework for knowledge-based workers has been difficult to develop and be fully accepted by both industry and academia. Office-based companies (knowledge-based/white collar workers) vary depending on the profession and industry. For example, measuring organizational performance in the legal, engineering, and banking sectors would have to done using very different underlying data and tools, and would therefore be a challenge to normalize and compare. Therefore, a new approach is required to isolate organizational performance data that can be potentially linked to the indoor environment. One of the challenges in a knowledge-based environment is the ability to link certain professional outcomes in a financially quantifiable manner. This research uses a bottom-up approach where the researcher intentionally focused on financial services companies (FSCs), as these types of organizations are assessed on their ability to outperform the market, but more importantly to outperform their competitors, in terms of annualized returns. Furthermore, knowledge-based workers employed by FSCs are office bound for the duration of the workday, as access to secure financial systems and confidential data normally occurs within the confines of the office building and other secure firewalls. Additionally, unlike other professions (e.g., engineers, auditors, and lawyers) that are often required to leave the office as part of their work to meet clients ().
Method and Hypotheses
Method
The overarching method is a bottom-up approach comprising three phases where twenty FSCs offering three commonly provided investments (i.e., an income fund, a balanced fund, and a South African equity fund) were selected. These three funds are offered by all the FSCs included in this study and can be directly linked to individual productivity, as highly effective (productive) asset managers find investment opportunities that outperform competing FSCs. Financial services tenants are intentionally selected as their inputs and outputs are quantifiable and therefore comparable.
The first phase involved comparing ten South African based FSCs (1–10) located across nineteen green certified buildings with ten FSCs (11–20) located in thirteen non-green buildings. The nineteen green buildings were all owned by the largest South African real estate investment trust (REIT) that own the majority of green certified office buildings in South Africa. These FSCs 1–10 were the only businesses in this REITs portfolio that offer the three main funds (income, balanced, and South African equity). The other ten FSCs were owned by various property-owning companies in South Africa that also offered the same three funds. Not all FSCs operating in the South African market have all three funds with the focus mainly on balanced and South African equity funds, while ignoring low risk/low return funds, i.e., income funds. The FSCs ranged from institutional investors, insurance companies, asset management companies and boutique private equity investment firms. Sixteen buildings were 4-star green certified, while two buildings were 5-star and one building was 6-star certified. Desktop analysis of publicly available data were obtained from downloaded fact sheets of the three funds from FSC websites for income funds (low risk), balanced funds (moderate risk), and South African equity funds (high risk). All the FSCs were managed in-house by a single or multiple asset manager(s). Additionally, all the investment funds were active funds, i.e., not funds of funds or index linked funds. A change in asset management personal was deemed acceptable over the different time periods, as all asset managers make investment decisions based on the same market information and conditions at a given point in time. It is therefore assumed that an asset manager (and their support staff) working in a green building with superior IEQ would outperform an asset manager (and their support staff) working in a non-green building and this would be reflected in the fund performance.
Hypotheses
For each of the three fund types the asset class allocation was similar across all the FSCs. The annualized returns from inception for each of these investment funds across each of the FSCs was included, assuming the investment fund was established at least five years ago in order to dilute the impact of COVID-19 on the investment markets. It was also assumed that financial services analysts were all exposed to the same market information and fluctuations regardless of the state of the market. Using the annualized return for each investment fund for each FSC, the average return and standard deviation was calculated for both the green and non-green building groups. The average return was used to forecast the projection of R100 over thirty years in order to determine if there was a significant difference in the average of FSCs located in green buildings versus non-green buildings.
Hypothesis 1.
FSCs located in green buildings in the long-term on average outperform competing companies located in non-green buildings.
The second phase attempted to establish if there was a relationship between enhanced IEQ and annualized returns. The annualized return since inception were compared to the annualized return since taking occupation of the green building – five years (approximate average for FSCs 1–10). The difference in return – discount/premium (delta – inception/5 year returns) was calculated and then ranking applied to FSCs 1–10 for each of the three funds. It is expected that as the ranking worsens (tending towards 10), so the IEQ score would decrease. Pearson’s Correlation analysis was conducted to test this hypothesis, where a negative correlation would support the notion that there is a relationship between IEQ and annualized returns. Length of time (interaction term) was considered as a co-variate in relation to annualized return for FSCs 1–10.
Hypothesis 2.
There is a relative improvement (i.e., ranking improves) of annualized returns for FSCs when compared to the number of IEQ points for a green building.
Hypothesis 3.
Time in a green building (operationalized as years since occupation) has a positive impact on the relative improvement in annualized returns.
The third phase comprised several calculations. The first calculation determined the difference between the returns for each FSC within one of the investments (income, balanced or South African equity) and the average return of the corresponding non-green building group. For example, in the income fund (low risk) data set, FSC 1 located in a green building has an annualized return since inception of 9%, and the average returns for the income fund in all the non-green buildings is 7.86%. The incremental return was 1.14%. FSC 1 was located across three buildings with IEQ scores of 12, 13 and 19 points, respectively. The incremental return was divided by each IEQ score (to normalize the output), resulting in a green return ratio incremental (GRRi) for each building for the income fund. The same process was repeated for the balanced and South African equity investments, to calculate the GRRi for each building. The GRRi’s across all the investments was summed and divided by the number of buildings (3) housing FSC 1, resulting in an average green return ratio incremental (AGRRi) per building. The AGRRi gives an average indication per building for each FSC located in a green building(s) of the premium/discount expressed as an incremental return when compared to average returns against a sample of FSCs located in non-green buildings.
The following formulae were applied:
Where:
FSC x = Any FSC 1–10
GB = Green Building
NGB = Non-Green Building
a = Income Fund; b = Balanced Fund; c = SA Equity Fund
Average Return (NGBa;b;c) = NGB average return for each of the three investments (a;b;c)
GRRi = Green Return Ratio incremental (i) for FSC x (a or b or c)
AGRRi = FSC x is incrementally(i) generating on average per building y% discount/premium to the average returns of FSC 11–20.
For FSC 1 located in a green building, the AGRRi was 0.18%. This means that on average FSC 1 incrementally, but slightly, outperformed the control group (FSCs in non-green buildings). FSC 2 had higher incremental returns across all three investment options and a significantly higher AGRRi (1.48%). Therefore, the larger the difference of returns for investment funds of FSCs located in green buildings compared to the corresponding average return of all FSCs for a particular investment, the larger the AGRRi.
Hypothesis 4.
Individual FSCs located in green buildings generate superior fund returns compared to the average returns of FSCs located in non-green buildings when IEQ scores are normalized.
Limitations
This research is limited to the South African green certified office market and FSCs that lease space in these buildings, where the FSCs must offer (amongst other financial products) the three main funds (income, balanced, South African equity). Due to the infancy of the green building movement in South Africa, compared to developed real estate markets there is a relatively small sample of as-built green certified office buildings. This results in a further reduced number of FSCs leasing space in green certified office buildings, which offer the three main funds (income, balanced, South African equity) included in the analysis. Furthermore, as stated in the introduction, other office tenants would not be suitable for this study, as it difficult to provide a more standardized quantification of their organizational performance in relation to their physical office environment, especially if their employees spend time away from the office to conduct business. It should be further noted that other factors such as the demographic profile (specifically age), political profile (conservative versus liberal/progressive), corporate governance, and access to resources of office tenants were not considered in this study. This is because these are factors that are luxuries within the context of the South African office market and are more applicable to developed economies and property markets. There is demand for South African green office buildings, due to the unpredictability and increasing prices of utilities. Electricity (which the tenant normally pays) has been increasing at above inflationary levels. Added to these increased costs, South Africa has, for at least the last ten years, experienced load shedding (scheduled power black outs). Rental for office green buildings is not charged at a premium due to the relatively weak office market and macro economy in the last five to seven years. Therefore, in South Africa green certified office buildings provide a form of protection (future proofing of business operations) against failures in infrastructure and rising costs in the form of renewable energy sources and/or the use of natural light through efficient design, i.e., there is not a premium for green buildings, but rather a brown discount for non-green buildings that are considered more vulnerable to infrastructure failures. This illustrates the main reason for being in a green certified office building (regardless of industry), as green buildings can have an operational and therefore financial impact on their tenants.
Results
Green Certified Buildings vs. Non-Green Buildings
Annualized returns of ten FSCs located in nineteen green certified buildings across the three types of funds were compared to the same return data of ten FSCs located in thirteen non-green buildings. The FSCs ranged from approximately 25–37,000 employees, where some FSCs were located across multiple buildings and others were based in a single multi-tenanted building. provides a breakdown of the buildings for each of the FSCs in terms of green certification (Green Star South Africa), IEQ points, and the period of time (years) that each FSC had been located in a green building. contains sixteen four (45–59 points), two five (60–74 points) and one six (75–100 points) star green certified buildings, respectively. There is not necessarily a direct link to points scored for IEQ and overall points awarded for the building. For example, building 1 has an IEQ score of 12 and a total building score of 48, while building 4 has an IEQ score of 4.5 and a total building score of 51, where both buildings are four star green certified. This is because there are several contributing factors to an IEQ score with varying points allocations. The IEQ score in the Green Star rating tool includes the following aspects: indoor air quality; lighting comfort; thermal comfort; acoustic quality; and daylight and views. While IEQ tends to focus on building occupants, there are also other categories within the Green Star South Africa rating tool that carry more points (e.g., electricity and water) and focus directly on the operational capabilities of the building ( and ).
Table 1. FSC and building breakdown.
Table 2. FSC (non-green buildings) breakdown.
provides a breakdown for the FSCs (11–20) located in thirteen non-green buildings. The number of employees ranges from approximately 10–725.
Income Fund (Low Risk)
An income fund typically comprises interest bearing investments that include South African government bonds, cash investments through several local banks, and possibly individual/corporate money market accounts. Income funds tend to use consumer price index (CPI), i.e., inflation, as a benchmark, and therefore attempt to outperform this benchmark.
Of the ten FSCs located in green buildings, FSC 3 had the highest annualized return since inception (11%), while FSC 7 had the lowest return (3.8%). FSC 1 (9%), FSC 2 (9.14%), FSC 3 (11%), FSC 6 (8.7%), FSC 8 (9.2%) and FSC 9 (9.64%) all yielded returns greater than the average return for FSCs 11–20 ( = 7.86%). The average return for FSCs 1–10 is
= 8.26%, and the standard deviation for the FSCs located in green buildings and non-green buildings is S = 1.85% and S = 1.16%, respectively. When the average returns (
= 8.26%,
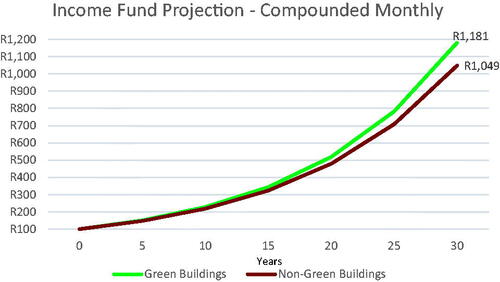
= 7.86%) for the two groups of FSCs is used to project the future value (FV) of R100, compounded both annually and monthly for thirty years, then this results in FSCs located in green buildings yielding a FV = R1,081 (annually) and FV = 1,181 (monthly), and the FSCs located in non-green buildings generating FV = R968 (annually) and FV (monthly) = R1,049. This means that the difference between the annually and monthly compounded FV is 11.75 and 12.66%, respectively. and provide a graphical representation of these projections.
Figure 2. Income fund projection – compounded annually.
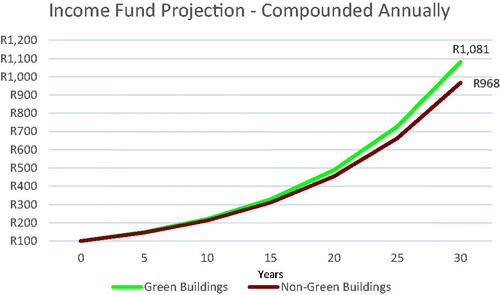
Figure 3. Income fund projection – compounded monthly.
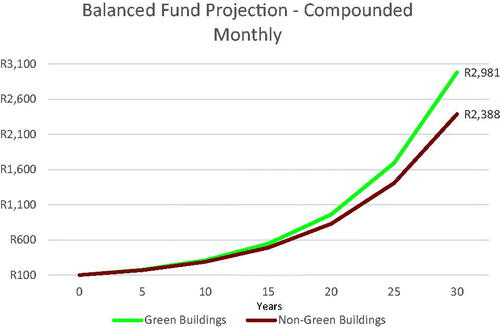
Balanced Fund (Moderate Risk)
A balance income fund is considered a moderate risk investment because it typically diversifies across a range of asset classes with varying degrees of risk. This normally comprises a combination of equities (approximately 70% of the fund, with the remaining 30% including property, commodities, bonds, and money market/bank deposits). A small proportion of the fund (approximately 30%) can be invested off-shore. The benchmark is similar funds in the market and is compared to the market value weighted return of funds in the South African multi-asset high equity category.
The ten FSCs located in green buildings indicated that FSC 1 had the highest annualized return (15.4%) and FSC 10 had the lowest return (8%). Five companies (FSC 1–15.4%, FSC 3–12%, FSC 5–12.45%, FSC 7–13.9%, and FSC 8–12.3%) all had returns greater than the average return for FSCs 11 to 20 ( = 10.62%). The standard deviation for FSCs 1–10 and FSCs 11–20 are S = 2.17% and S = 3.10%, respectively. The thirty-year compounded annual and monthly FV’s of R100 for FSCs 1–10, using the average return (
= 11.37%) is R2,530 and R2,981, respectively. The corresponding FV’s for FSCs 11-20, applying the average return (
= 10.62%) are R2,068 and R2,388, as shown in and . The difference between the green building and non-green building groups is 22.34% (compounded annually) and 24.83% (compounded monthly).
Figure 4. Balanced fund projection – compounded annually.
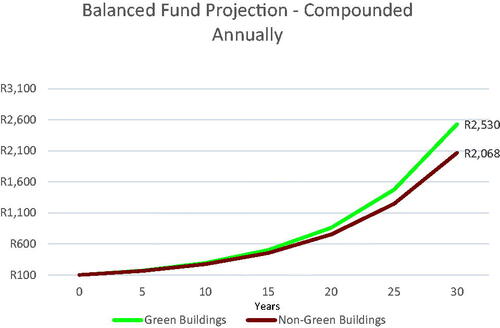
Figure 5. Balanced fund projection – compounded monthly.
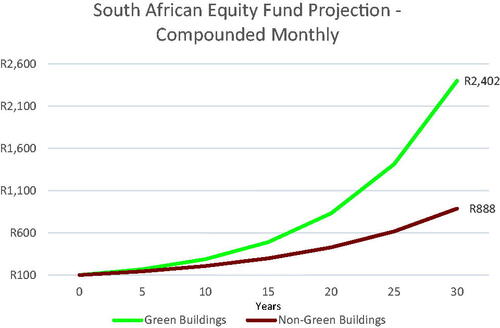
South African Equity Fund (High Risk)
A South African equity fund is considered a high-risk investment and aims to outperform the equity market over the long-term. A fund of this nature typically comprises at least 90% listed equities, with the remaining 10% including cash and property investments. A maximum of 40% of the assets can be listed outside of South Africa. This type of fund is normally benchmarked against the Financial Times Securities Exchange (FTSE) and/or the Johannesburg Securities Exchange (JSE) All Share Index.
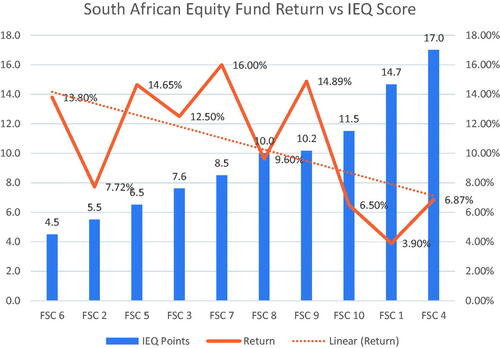
The South African Equity fund results indicate that for FSCs 1–10, the highest and lowest returns were obtained by FSC 7 (16%) and FSC 1 (3.9%), respectively. Only three companies (FSC 1, FSC 4 and FSC 10) were below the average returns of FSCs 11–20 ( = 7.3%). The standard deviations for the green building and non-green building groups were S = 4.03% and S = 4.21%, respectively. When R100 was compounded annually and monthly for thirty years for FSCs 1–10 using the average return (
= 10.64%), this resulted in FV’s of R2,078 and R2,402, respectively. When the same calculation is conducted for FSCs 11–20, applying the average return (
= 7.3%) then the FV compounded annually is R828 and compounded monthly is R888. The percentage difference between FSCs 1–10 (green building) and FSC 11–20 (non-green building) is 151% (compounded annually) and 170% (compounded monthly), as shown in and .
Figure 6. SA equity fund projection – compounded annually.
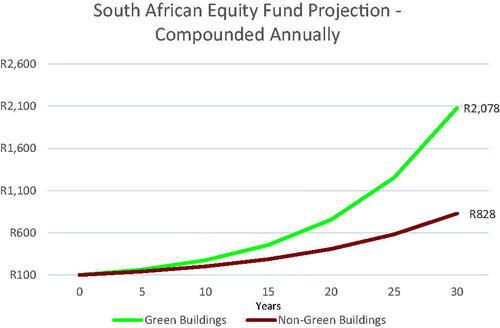
Figure 7. SA equity fund projection – compounded monthly.
IEQ Scores Compared to Return
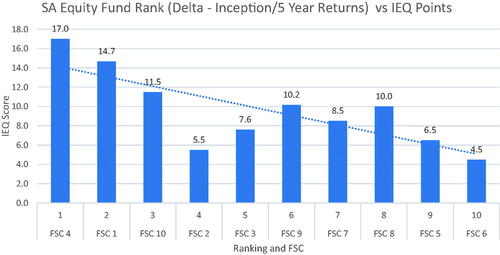
Correlation analyses were calculated to determine if there were any relationships between IEQ scores and annualized return in terms of rank after determining the annualized return delta for each investment vehicle (FSCs 1–10) since inception when compared to the five-year annualized returns. For example, for FSC 1 for the income fund, the annualized return for five years and since inception were 10 and 9%, respectively, resulting in a premium of 1%. For income and balanced investments, the correlation coefficients were r = −0.06 and r = 0.14, respectively. The South African equity investment yielded a negative correlation of r = −0.76 (p < 0.01), as shown in , while the consolidated correlation (all three funds) was negative, but also not statistically significant, at r = −0.48. Based on these results there was no significant relationship between IEQ score and annualized return in terms of rank, except for South African equity funds.
Figure 8. South African equity fund rank (delta – inception/5 year returns) vs. IEQ Score.
Further analysis of comparing annualized return (without implementing a ranking metric) to IEQ scores indicated there was a sweet spot where FSCs located in building(s) with mid-range IEQ scores (approximately 7.5–10) tend to yield the best returns, as shown in (income fund), (balanced fund), and (South African equity fund). This result may provide an indication that very low IEQ scores do not add value to annualized returns, while very high IEQ scores do not result in a sufficient increase in annualized returns. The extrapolation of the IEQ scores of 7.5–10 exhibited some commonalities, which included points for indoor air quality testing, thermal comfort, lighting comfort, conducting an occupant comfort survey, an acoustic audit, and access to daylight.
Figure 9. Income fund return vs. IEQ Score.
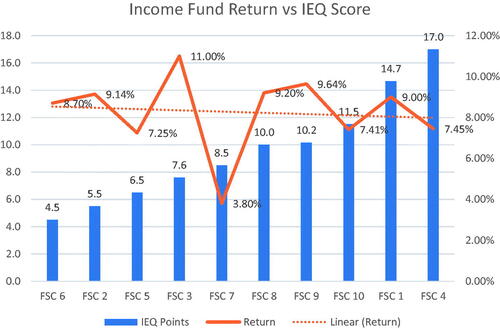
Figure 10. Balanced fund return vs. IEQ Score.
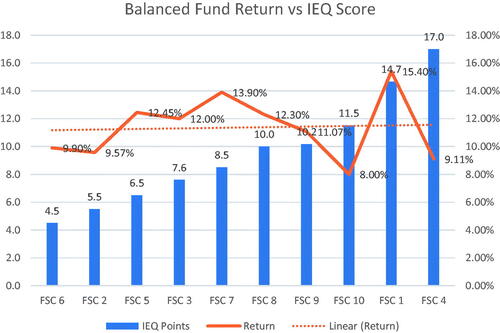
Figure 11. South African equity fund return vs. IEQ Score.
Further analysis was conducted by applying a covariate (time spent in a green building) against annualized return. Due to the average time spent in a green building for FSCs 1–10 was approximately five years, the annualized returns for the last five years were compared to an interaction term. The interaction term is the product of the time spent in a green building and the number of IEQ points. For the income (r = 0.06) and balanced funds (r = 0.28) there was no correlation between return and the interaction term. There was a moderate negative correlation (r = −0.59, p < 0.1) for the South African equity fund. As the interaction term increased the annualized return decreased, however the FSCs with IEQ scores between approximately 7.5 and 10 yielded the best annualized returns. This could further support the notion that there is a sweet spot for IEQ scores in relation to annualized return.
Average Green Return Ratio (AGRRi)
The AGRRi provides an average indication per building for each FSC located in a green building of the premium/discount expressed as an incremental return when compared to average returns against a sample of FSCs located in non-green buildings. IEQ score per building is embedded in this calculation in order to normalize the green return ratio (GRRi) for each building in relation to the incremental return for each investment vehicle for a particular FSC located in a green building. Nineteen IEQ scores (i.e., one per building) were used to calculate the AGRRi for FSCs 1-10.
FSC 1 was in three buildings where the GRRi for the income, balanced, and SA equity investments was 1.14, 4.78 and -3.4%, respectively. The sum of the GRRi’s was 0.54%. This results in an AGRRi of 0.18% (0.54% divided by 3). provides a numerical breakdown for FSCs 1–10. FSC 4 and FSC 10 have negative AGRRi’s of -0.14 and -0.34% respectively, while the other eight FSCs have a positive AGRRi. The AGRRi for FSC 1–10 was 0.46%, which indicates that as a group FSCs 1–10 marginally outperformed the non-green building group (FSCs 11–20) when an incremental return calculation is conducted taking into consideration IEQ scores ().
Table 3. Average green return ratio (AGRRi) breakdown.
Discussion
The following four hypotheses were stated in the methods section:
Hypothesis 1.
FSCs located in green buildings in the long-term on average outperform competing companies located in non-green buildings.
The results of the data analysis indicated that as a group FSCs 1–10 (green buildings) outperformed, on average, FSCs 11–20 (non-green buildings) in terms on annualized return since inception. There were, however, individual FSCs in the non-green building that outperformed FSCs in the green building group. A calculation was conducted using the average returns for the green and non-green building groups to forecast R100 for thirty years, compounded both annually and monthly. For all three investment funds there was a substantial percentage difference in nominal future values. These differences increased as the risk factor of each fund increased, i.e., the income fund had the smallest percentage difference, while the South African equity fund has the largest percentage difference.
Hypothesis 2.
There is a relative improvement of annualized returns for FSCs when compared to the number of IEQ points for a green building.
The data indicated that there was no correlation between IEQ scores and annualized return for two of the three investment funds. A return discount/premium was calculated comparing annualized returns since inception to annualized returns for the last five years. This was followed by ranking FSCs 1–10 and mapping them to their corresponding IEQ scores. The income and balanced funds did not exhibit any correlation; however, the South African equity fund indicated a statistically significant negative correlation (r = -0.76) at p < 0.01. This meant that as the annualized return premium decreased so the ranking increased (worsened/tended to 10), or in other words FSCs with the highest annualized return premium exhibited the highest IEQ scores. provides a graphical illustration of the relationship between IEQ scores and rank for the South African equity fund.
Hypothesis 3.
Time in a green building has a positive impact on annualized returns.
Correlation analysis between the interaction term and annualized return for the last five years did not indicate a relationship between these two variables for the income and balanced funds. For the South African equity fund there was a moderate negative correlation (r = −0.58) at p < 0.1, however this was only statistically significant at p = 0.10. Due to one fund providing statistically significant results at a relatively high p-value there an indication that there may be an IEQ sweet spot (7.5–10 points). An IEQ score lower or higher than this range does not add value in terms of annualized returns.
Hypothesis 4.
Individual FSCs located in green buildings generate superior fund returns compared to the average returns of FSCs located in non-green buildings when IEQ scores are normalized.
The application of a new indicator, the average green return ratio (incremental) (AGRRi) was used to provide insight into the incremental increase in return for each FSC 1-10 against the average return of FSCs 11–20 for each of the three investment funds. IEQ scores were used to normalize incremental calculations. Eight of the FSCs located in green buildings indicated a marginally positive AGGRi, while the remaining two FSCs had slightly negative AGGRi’s. The AGRRi’s for each FSC 1–10 were mostly positive, thus providing further support to hypothesis 1 that individual FSCs located in green buildings outperformed a group of FSCs located in non-green buildings. Furthermore, this approach incorporated IEQ scores and adjusted for the three investment funds held by each FSC.
The data indicated that there could be a high-level argument that FSCs located in green buildings do, on average, outperform (based on annualized return) similar companies based in non-green buildings. It could not be conclusively established that there was a significant relationship between annualized return and IEQ scores, both from a ranking and a nominal perspective to IEQ scores, despite the significant finding in support of this relationship for the high-risk South African Equity Fund. Furthermore, using time spent in a green building as a covariate did not uncover a significant relationship between annualized return and IEQ scores. This confirms that the indication of a significant relationship between enhanced IEQ and organizational performance is difficult to establish as was stated by Kampschroer et al. (Citation2007); Flamholtz (Citation2009); Feige et al. (Citation2013), but is contrary to many green building advocates (Alker et al., Citation2014).
A granular analysis of applying the AGRRi equations of return data across the three investment vehicles of each FSC 1–10 compared to the average return of FSCs 11–20 provided a different insight into the incremental return of FSCs located in green buildings. Eight of the FSCs located in green buildings produced a small incremental return per IEQ point when compared to the average return of the companies located in non-green buildings. Two FSCs performed relatively worse when a comparison was made to the sample of FSCs in the non-green building group. This new approach of assessing FSCs located in green and non-green buildings has not been conducted by previous researchers and therefore provides a different lens within a bottom-up approach of assessing organizational performance within the context of GBFIs, specifically enhanced IEQ. The AGRRi method adds value to assessing organizational performance within the financial services sectors in terms of enhanced IEQ, which is underpinned by green building certification.
Analyzing organizational performance within the context of green building is a challenge as there are factors that can influence both the productivity of the human resources and the organization’s performance as a whole (Prouska et al., Citation2016; Saleem et al., Citation2019). FSCs provide a relatively “clean” output that can be compared against industry benchmarks and competing organizations.
Green buildings in South Africa are classified as P-grade (premium) buildings, while the FSCs (11–20) located in non-green buildings tend to be classified as A-grade buildings, which typically also include high quality finishes and therefore command relatively high rental. There is a possibility that many A-grade buildings do have some GBFIs (including those related to IEQ), but the property owners choose not to opt for green certification, as this would be an additional cost that is not deemed necessary. This could partially explain why there were individual occurrences of FSCs in the non-green buildings outperforming FSCs located in green buildings, as the difference in the actual IEQ of some A-grade and P-grade buildings is often not immediately noticeable.
However, it must be noted that returns are significantly impacted by a number of other external and internal factors. External factors are characteristics that are not in the control of asset manager(s), while internal factors are characteristics that are in the control of the asset manager(s) and the organization. Examples of external factors include unforeseen socio-political and economic events that result in a sudden market shock (Prouska et al., Citation2016), such as COVID-19 where global economies were reduced to only essential services during the height of the pandemic. However, examples of internal factors could be investment policies set by executive leadership (Saleem et al., Citation2019) at an organizational level, which may restrict individual asset manager(s) from fully applying their best judgement in terms of investment decisions. External factors tend to have a longer lasting impact on returns as it generally takes time for an economy to recover or for a political system to change that will benefit the investment community. Furthermore, external factors are more difficult to manage than internal factors and therefore they can have a greater residual impact on an organization in terms of strategy development in order to pivot appropriately. These factors can distort annualized returns and make it difficult to establish if there is a relationship between IEQ scores and annualized return.
The obvious limitation of this study is that it only focuses on FSCs and therefore cannot be generalized for other office-based industries, or for that matter other FSCs that do not offer the three commonly available investment funds included in this study. These three funds covered a range of investment risk profiles that aided the standardization of organizational performance of the FSCs located in green and non-green buildings. This study included a relatively small sample of South African FSCs located in green buildings. However, the sample of FSCs was relatively complete as all the companies renting space in South Africa’s largest REIT that were in their green building portfolio and operating in financial services were screened and only ten FSCs were found to have income, balanced and South African equity funds that were established at least five years ago. It should be further noted that due to the small and exhausted sample size it is not possible to determine and/or control for staff attraction and retention (salaries and company culture) working for institutional versus boutique FSCs. Another factor that is difficult to determine are other reasons (outside of protection against failing infrastructure) for FSCs to lease space in green certified office buildings. There could be a range of reasons, that may include corporate brand enhancement, subtle recruiting strategy in the form a superior indoor working environment, and environmental consciousness as part of FSCs core company values, inter alia.
Conclusion
The study attempted to determine if there was any benefits for FSCs located in a green building in terms of organizational performance, as measured by annualized return (Hypothesis 1 – partially accepted). There were indications that FSCs located in green buildings did on average yield higher annualized returns to FSCs located in non-green buildings. The difference in performance is not always immediately large but can lead to a large difference when allowed to compound over time, thus benefiting both the FSCs and their clients over the long-term. It should be noted that extrapolating future values is a hypothetical exercise, which is often performed in industry by FSCs with the assumption that current market conditions are relatively stable/predictable over a long period of time. It could not be conclusively established that there was a relationship between annualized return and IEQ scores (Hypothesis 2 – rejected), however there was an indication that there is a moderate IEQ score range where annualized return seems to be maximized relative to the lower returns in the sample. Furthermore, the amount of time in a green building did not provide any insight into the organizational performance of FSCs located in green buildings (Hypothesis 3 – rejected). A new metric (AGRRi) was used to normalize the IEQ score to determine if there was an incremental difference in annualized return for each FSCs located in a green building when compared to the average returns of the FSCs located in non-green buildings (Hypothesis 4 – partially accepted). The AGRRi showed that generally FSCs located in green buildings slightly outperformed FSCs located in non-green buildings. However, it should also be noted that individual FSCs located in non-green buildings did outperform some FSCs in the green building group. This study addressed four hypotheses that focused on organizational performance rather than individual productivity within the context of green building, which yielded mixed results. This was an important step as it provides further insight into whether green buildings, more specifically enhanced IEQ impact the bottom line of FSCs that operate in this space.
There is potential for future research in this area to conduct qualitative data analysis in the form of semi-structured interviews with asset managers of FSCs to determine if there is a perception that their indoor office environment influences their productivity. This data could be used to substantiate the findings of this research and forms part of the model () developed by (Nurick & Thatcher, Citation2021) to determine if there is a link between enhanced individual productivity and organizational performance within the context of green office buildings. Furthermore, this research could be replicated in other markets where there is a larger sample of green office buildings and FSCs that offer similar funds, that may have different investment challenges to that of South Africa. Additionally, a larger sample would allow for an investigation into FSC performance in relation to company size (number of employees), and create the possibility of analyzing other funds that are commonly offered in developed financial markets, which are not widely offered to South African investors. A similar research approach could also be applied to retail property in green buildings, where the financial performance of similar tenants (e.g., anchor tenants such as major supermarkets) could be compared to non-green certified retail buildings. There is also potential for the application of similar type hypotheses within the context of light industrial property (i.e., distribution centres) to determine if an e-commerce type tenant performs better in a green certified industrial building.
Acknowledgments
The author wishes to acknowledge and thank Professor Andrew Thatcher at the University of the Witwatersrand for his assistance with this paper, specifically regarding the statistical components and proof reading.
Disclosure statement
No potential conflict of interest was reported by the author(s).
Data availability statement
The data is available at this link.
References
- Akimoto, T., Tanabe, S-i., Yanai, T., & Sasaki, M. (2010). Thermal comfort and productivity - Evaluation of workplace environment in a task conditioned office. Building and Environment, 45, 45–50. https://doi.org/10.1016/j.buildenv.2009.06.022
- Alker, J., Malanca, M., Pottage, C., & O'Brien, R. (2014). Health, wellbeing & productivity in offices. The next chapter for green building. World Green Building Council.
- Biron, C., Brun, J.-P., Ivers, H., & Cooper, C. L. (2006). At work but ill: Psychosocial work environment and well-being determinants of presenteeism propensity. Journal of Public Mental Health, 5(4), 26–37. https://doi.org/10.1108/17465729200600029
- Byrd, H., & Rasheed, E. O. (2016). The productivity paradox in green buildings. Sustainability, 8(4), 347. https://doi.org/10.3390/su8040347
- Chadburn, A., Smith, J., & Milan, J. (2017). Productivity drivers of knowledge workers in the central London office environment. Journal of Corporate Real Estate, 19(2), 66–79. https://doi.org/10.1108/JCRE-12-2015-0047
- Clements-Croome, D., & Baizhan, L. (2000). Productivity and indoor environment. In Proceedings of Healthy Buildings, 629–634. UK: Juke Associates.
- Feige, A., Wallbaum, H., Janser, M., & Windlinger, L. (2013). Impact of sustainable office buildings on occupant's comfort and productivity. Journal of Corporate Real Estate, 15(1), 7–34. https://doi.org/10.1108/JCRE-01-2013-0004
- Fisk, W. J., Black, D., & Brunner, G. (2011). Benefits and costs of improved IEQ in U.S. offices. Indoor Air, 21, 357–367. https://doi.org/10.1111/j.1600-0668.2011.00719.x
- Flamholtz, E. G. (2009). Towards using organizational measurements to assess corporate performance. Journal of Human Resource Costing & Accounting, 13(2), 105–117. https://doi.org/10.1108/14013380910968629
- Garnys, V., & Wargocki, P. (2015). Agreeing on the productivity index for IEQ. In M. Loomans & M. te Kulve (eds.), Healthy buildings Europe. Maastricht University.
- Green Building Council of South Africa (GBCSA). (2015). Green star SA – office v1. In: Rating tool fact sheet. Green Building Council of South Africa.
- Heerwagen, J. (2000). Green buildings, organizational success, and occupant productivity. Building Research & Information, 28(5), 353–367. https://doi.org/10.1080/096132100418500
- Kampschroer, K., Heerwagen, J., & Powell, K. (2007). Creating and testing workplace strategy. California Management Review, 49(2), 119–137. https://doi.org/10.2307/41166386
- MacNaughton, P., Pegues, J., Satish, U., Santanam, S., Spengler, J. D., & Allen, J. G. (2015). Economic, environmental and health implications of enhanced ventilation in office buildings. International Journal of Environmental Research and Public Health, 12, 14709–14722. https://doi.org/10.3390/ijerph121114709
- Mallawaarachchi, H., De Silva, L., & Rameezdeen, R. (2016). Indoor environmental quality and occupants’ productivity, Suggestions to enhance national green certification criteria. Built Environment Project and Asset Management, 6(5), 462–477. https://doi.org/10.1108/BEPAM-09-2015-0046
- Mallawaarachchi, H., De Silva, L., & Rameezdeen, R. (2017). Modelling the relationship between green built environment and occupants’ productivity. Facilities, 35(3/4), 170–187. https://doi.org/10.1108/F-07-2015-0052
- Miller, N. G., Pogue, D., Gough, Q. D., & Davis, S. M. (2009). Green buildings and productivity. Journal of Sustainable Real Estate, 1(1), 65–89. https://doi.org/10.1080/10835547.2009.12091783
- Newsham, G. R., Veitch, J. A., & Yitian, H. (2017). Effect of green building certification on organizational productivity metrics. Building Research & Information, 46(7), 755–766.
- Nurick, S., & Thatcher, A. (2021). The relationship of green office buildings to occupant productivity and organizational performance: A literature review. Journal of Real Estate Literature, 29(1), 18–42. https://doi.org/10.1080/09277544.2021.1909316
- Park, J. S., & Yoon, C. H. (2011). The effects of outdoor air supply rate on work performance during 8-h work period. Indoor Air, 21(4), 284–290. https://doi.org/10.1111/j.1600-0668.2010.00700.x
- Prouska, R., Psychogios, A. G., & Rexhepi, Y. (2016). Rewarding employees in turbulent economies for improved organisational performance – exploring SMEs in the South-Eastern European region. Personnel Review, 45(6), 1259–1280. https://doi.org/10.1108/PR-02-2015-0024
- Rasheed, E. O., & Byrd, H. (2017). Can self-evaluation measure the effect of IEQ on productivity? A review of literature. Facilities, 35(11/12), 601–621. https://doi.org/10.1108/F-08-2016-0087
- Saleem, M. A., Bhutta, Z. M., Nauman, M., & Zahra, S. (2019). Enhancing performance and commitment through leadership and empowerment – an emerging economy perspective. International Journal of Bank Marketing, 37(1), 303–322. https://doi.org/10.1108/IJBM-02-2018-0037
- Singh, A., Syal, M., Grady, S. C., & Korkmaz, S. (2010). Effects of green buildings on employee health and productivity. American Journal of Public Health, 100, 1665–1668. https://doi.org/10.2105/AJPH.2009.180687
- Tanabe, S-i., Haneda, M., & Nishihara, N. (2015). Workplace productivity and individual thermal satisfaction. Building and Environment, 91, 42–50. https://doi.org/10.1016/j.buildenv.2015.02.032
- Thatcher, A., & Milner, K. (2014). Changes in productivity, psychological wellbeing and physical wellbeing from working in a 'green' building. Work, 49, 381–393. https://doi.org/10.3233/WOR-141876
- Thatcher, A., & Milner, K. (2016). Is a green building really better for building occupants? A longitudinal evaluation. Building and Environment, 108, 194–206. https://doi.org/10.1016/j.buildenv.2016.08.036
- United Kingdom Green Building Council (UKGBC). (2015). Breeam Categories. http://www.ukgbc.org [Accessed September, 2015].
- United States Green Building Council (USGBC). (2015). LEED Categories. http://www.usgbc.org [Accessed September, 2015].
- Wyon, D. (2004). The effects of indoor air quality on performance and productivity. Indoor Air, 14, 92–101. https://doi.org/10.1111/j.1600-0668.2004.00278.x
- Zhang, H., Arens, E., Kim, D., Buchberger, E., Baumann, F., & Huizenga, C. (2010). Comfort, perceived air quality, and performance in a low-power task-ambient conditioning system. Building and Environment, 35, 29–39. https://doi.org/10.1016/j.buildenv.2009.02.016