
 ?Mathematical formulae have been encoded as MathML and are displayed in this HTML version using MathJax in order to improve their display. Uncheck the box to turn MathJax off. This feature requires Javascript. Click on a formula to zoom.
Abstract
This paper investigates the investment strategy that large Canadian pension funds implement in the private real estate market. Even though they manage just 6% of global pension assets in our data, Canadian pension funds are responsible for 60% of the total value of private real estate deals that directly involve a pension fund. A key component of their strategy consists of internally developing and greening urban properties in core downtown areas. Using a common benchmarking methodology across funds, we show that this impact strategy delivers superior performance net of fees and drives the green development of major city centers.
Introduction
The growth of interest in sustainable investing over the past decade raises hard questions for asset owners. Will the cost of investing green result in lower portfolio returns in the long-run? Or are there win-win strategies where green investments can generate high returns alongside positive environmental impact? These questions are particularly relevant in the real estate space since green real estate development has been shown to generate significant economic value (Eichholtz et al., Citation2010; Fuerst & McAllister, Citation2010; Miller et al., Citation2008).
The present paper investigates the investment strategy that large Canadian pension funds implement in the private real estate market. These funds are interesting to study because they actively invest in green buildings, such as the Deloitte Tower in Montreal and the Texas Tower in Houston, and they allocate an unusually large share of their portfolio to real assets. A recent study by Beath et al. (Citation2021) finds that, among pension funds with over USD 50bn assets under management (AUM), real assets account for 23% of the portfolios of Canadian funds on average but just 10% of the portfolios of non-Canadian funds. In light of this evidence, we ask three questions. Have large Canadian pension funds been able to generate high-risk-adjusted returns in private real estate? Have they been able to combine financial profitability with positive environmental impact? If so, can asset owners around the World successfully implement this strategy moving forward?
Our analysis consists of three parts. In the first part, we evaluate the historical performance of Canadian pension funds’ real estate portfolios. Using data from CEM Benchmarking, a global benchmarking firm, we compare the annual returns of 241 real estate portfolios of Canadian and non-Canadian pension funds from 2005 to 2019. The sample includes 36 funds (eight Canadian) with more than USD 50 billion of AUM. We henceforth refer to these funds as large funds. Importantly, the dataset includes for each fund the proportion of the real estate portfolio that is private, as well as the proportion that is directly managed, either through direct property ownership or through a wholly owned operating subsidiary. There are 27 funds (14 Canadian) that manage more than 50% of their real estate AUM directly. Among them are seven of the eight large Canadian pension funds.
Our performance evaluation methodology specifically addresses the lack of consistent benchmarking across real estate portfolios. Many funds adjust their benchmark by adding an inflation index, a private risk premium, or a lag. Moreover, while some funds use listed REIT indices as benchmarks, such as the FTSE Nareit U.S. Real Estate Index, other funds rely on peer-based benchmarks, such as the National Property Index (NPI). The use of different types of benchmarks is problematic because the returns of REIT benchmarks are marked-to-market whereas the returns of peer-based benchmarks are based on appraisal prices, which are often smoothed and lagged (Geltner, Citation1989). The lack of consistency across benchmarks makes net value-added comparisons across funds open to interpretation.
We address this issue by employing a common benchmarking approach. For each fund, we construct a benchmark that consists of a fund-specific geographic blend of listed equity REITs, appropriately (de-) levered, smoothed, and lagged to match the properties of the real estate portfolio’s reported returns. Our method delivers benchmarks that closely track the reported portfolio returns, with an average correlation of 93%. Using this consistent benchmarking methodology, we measure the performance of a real estate portfolio in terms of its net return in excess of the benchmark. We refer to this net return as net value added (NVA).
Our analysis reveals that portfolios of large Canadian pension funds with a high proportion of direct real estate investments outperform their benchmarks. On average, large Canadian pension funds that directly manage more than 50% of their real estate AUM generated an NVA of 148 basis points (bps) between 2005 and 2019. We verify that this strong performance is not driven by the funds’ exposure to the local real estate market, and it is not just the result of managing assets directly.
In the second part of the analysis, we look into the real estate investment strategy pursued by large Canadian pension funds. We first use deal-level data from Preqin and compare hundreds of real estate deals made by large Canadian and non-Canadian pension funds from 2010 to 2018. The data confirm that large Canadian pension funds are uniquely active in the market of direct real estate investments. Even though they manage ∼6% of global pension assets in our data, they are responsible for 60% of the total value of real estate deals that directly involve a pension fund.
We then combine the information on deals from Preqin with data on green building certification of newly-built and retrofitted projects by Leadership in Energy and Environmental Design (LEED), a widely-used green certification program. We show that large Canadian pension funds systematically pursue an impact strategy that consists of internally developing, managing, and greening urban properties. Specifically, they initiate and complete LEED projects on 27% of their portfolio of direct acquisitions reported in Preqin, whereas non-Canadian funds only do so for 14% of their portfolio. The gap increases once we focus on direct acquisitions of U.S. office properties where LEED certification is most common. Furthermore, Canadian pension funds are more likely to purchase real estate assets, activate and complete the LEED certification process, and then re-sell the assets.
To further investigate the green urban development strategy in large Canadian cities where Canadian pension funds are most involved, we augment the dataset by manually collecting hundreds of local deals made by the top nine Canadian pension funds from their annual reports and news releases. We then combine this information with data on land parcels and buildings and construct 3-D maps of the funds’ LEED value-added activity in Toronto, Montreal, and Vancouver. In each city, we show that the city center has been largely greened by Canadian pension funds. The patterns are most striking in Toronto, which is Canada’s largest city and the home to the head offices of five of the nine largest Canadian pension funds. The area located inside and surrounding Toronto’s financial district is owned and greened predominantly by these funds. Moreover, 17 of the 26 Toronto buildings that obtained LEED Platinum—the highest level of certification—correspond to Canadian pension fund projects.
We find that Canadian pension funds do more than obtain LEED certification on existing buildings. They also undertake large greenfield projects where they purchase the land, develop and green the properties from the ground up. These projects tend to be clustered in up-and-coming districts near the city centers, such as the new Quartier des Gares in Montreal and the South Core district in Toronto. The combined impact of these projects on the cities’ development is large. In Toronto, two of the 10 tallest office towers currently under construction are being developed by Canadian pension funds.
In the third part of the analysis, we discuss the benefits and risks of the Canadian pension funds’ real estate investment strategy. We view green urban development as an impact strategy because (i) it combines financial profitability alongside positive environmental impact and (ii) it is a strategy where the parent investors—Canadian pension funds—have a direct influence on the projects’ execution. The benefits of pursuing this strategy internally include full control of the assets, direct communication between owners and managers, low fees due to the elimination of financial intermediaries, lower cost of project financing, and the ability to extract the full economic profit from the real estate ventures.
Of course, there are legal and operational risks associated with the development and management of real assets. There are also liquidity risks related to the long-term nature of development projects, and risks associated with the real estate industry as evidenced by the covid-19 pandemic (Ling et al., Citation2020). We discuss in the paper several strategies that asset owners can take to mitigate these risks.
One risk-mitigating strategy is the application of green urban development to a specific set of projects that have well-defined clienteles, economies of scale, and a risk profile that naturally matches the long-term bond profile of the funds’ pension liabilities. A good example is the construction of a green office tower in a major city center. Such a tower caters to the need of corporate clientele for sustainable office space. It can also be replicated in multiple cities and provides a stream of rental income that shares similarities with a stream of pension payouts.
A second risk-mitigating strategy is the concentration of development projects in particular cities and neighborhoods. Concentration allows a fund to work in an environment that it knows well and thus better manages the operational risks (Huffman, Citation2002). Concentration also allows the fund to create positive housing externalities (Rossi-Hansberg et al., Citation2010).
A third risk-mitigating strategy is the use of a wholly-owned real estate operating subsidiary, which provides multiple operational advantages including experience in developing and managing green projects, access to a large network of suppliers and retailers that lease the space, protection from legal risks, additional flexibility regarding employee compensation, and the reduction of agency issues.
First, we describe the paper’s contribution to different strands of the research literature. Next, we assess the performance of large Canadian pension funds’ real estate portfolios. Then, we identify green urban development as a key driver of the Canadian funds’ strategy. Finally, we discuss the benefits and risks of this strategy for asset owners and conclude.
Contribution to the Literature
Our paper contributes to several research literature on sustainable investing, impact investing, private investing, and the Canadian pension fund model. In this section, we briefly review these literatures and summarize the paper’s main contributions.
Sustainable Investing
A growing literature in finance shows that sustainable investing leads to low expected returns. For example, Pastor et al. (Citation2020) show that green assets have low expected returns in equilibrium because investors enjoy holding them and because green assets hedge climate risk (see also Zerbib, Citation2022). Consistent with this analysis, Betermier et al. (Citation2022) develop a supply and demand approach to capital markets and confirm that any ESG factor that expands the supply of capital to a productive asset naturally results in a lower expected return for the asset. The size of these effects remains a source of debate (Berk & van Binsbergen, Citation2022).
In this paper, we show that, in spite of the low risk-return trade-off of sustainable investments, it is still possible for investors to create a win-win for high returns on green investments by pursuing an internal development strategy, such as green urban development. The high return comes from the “alpha” side of the investment.Footnote1 By bringing the development function in-house, Canadian pension funds capture the developer’s economic profit associated with the productive investments in green assets. This economic profit results in high risk-adjusted returns for the investors.
Impact Investing
Impact investing is a type of sustainable investing where investors exercise their right of control to change corporate policy to generate both a financial return and additional environmental and social gains. Previous research finds that impact funds tend to generate lower returns than traditional funds (Barber et al., Citation2021), partly because they cater to a clientele of investors who derive nonpecuniary utility from investing and are thus willing to sacrifice returns. By comparison, our analysis shows that the green urban development strategy implemented by Canadian pension funds results in positive risk-adjusted returns. The high returns are consistent with the evidence that green real estate development generates positive economic profits (Eichholtz et al., Citation2010; Fuerst & McAllister, Citation2010; Miller et al., Citation2008).
Private Investing
Our paper also contributes to the growing body of research on the profitability of private investments. Because private assets are less liquid and more complex to operate and value than public assets, it is important to understand whether and how investors can benefit from investing in private markets. Recent research finds that investments in private equity and infrastructure funds may not be as profitable as commonly believed (Andonov et al., Citation2021; Beath & Flynn, Citation2020; Gupta & Van Nieuwerburgh, Citation2021; Phalippou & Gottschalg, Citation2009). Our analysis confirms that private real estate portfolios that are externally managed underperform their benchmarks. However, we show that private real estate portfolios that are internally managed outperform their benchmarks, consistent with Andonov et al. (Citation2015).
Canadian Pension Fund Model
Finally, the paper contributes to the literature on the Canadian pension fund model. Large Canadian pension funds are known to be highly involved in direct investments and in private markets (Ambachtsheer, Citation2016, Citation2021; Bédart-Pagé et al., Citation2016; Lipshitz & Walter, Citation2020). Beath et al. (Citation2021) study the business model of these funds and show that the use of in-house teams allows Canadian pension funds to reduce costs and in turn redeploy resources by (i) growing the funds’ internal capabilities and (ii) allocating more capital to strategic assets, including real estate and infrastructure. These assets not only diversify the portfolio but also align the risk of their liability portfolio to their assets. The study finds that this business model has resulted in a strong performance for the pension funds both in terms of financial performance and liability hedging. Building on this literature, we take the analysis down to the asset level and identify green urban development as a key component of the active strategy that Canadian pension funds internally pursue in real estate.
Performance of the Canadian Pension Funds’ Real Estate Portfolios
We begin the analysis by assessing the performance of Canadian pension funds’ real estate portfolios. The next section introduces a common benchmarking method across funds. The section on Data describes the dataset used for the performance analysis. Finally, the section on Performance of Canadian Pension Funds presents the results.
Benchmarking Method and Performance Metric
The major impediment to comparing the performance of real estate portfolios is a lack of consistent benchmarking. We illustrate this issue in by summarizing the properties of the benchmarks used by the 241 real estate portfolios in our sample (described in the next Section). While some funds use listed REIT indices, fixed hurdle rates, inflation rates, and interest rates-based benchmarks, most funds (around 70%) use peer-based benchmarks which rely on the appraised returns of private real estate reported by asset managers or asset owners (e.g., NPI, IPD Canada, MSCI PREA). Peer-based benchmarks are often customized in a variety of ways through the use of lags, currency adjustments, leverage adjustments, or risk premia. The clear lack of consistency leaves performance comparisons across funds open to interpretation.
Table 1. Properties of real estate benchmark portfolios.
We address this issue by employing a common benchmarking method. For each fund in our sample, we construct a benchmark portfolio of local and foreign REIT indices that is appropriately (de-) levered, smoothed, and lagged to match the properties of the fund’s reported return. We then calculate the net value added (NVA) of the fund’s portfolio in relation to its inferred benchmark.
Let be the real estate return net of fees reported by fund
in year
The fund’s benchmark portfolio
contains a local REIT index, a global REIT index, and a local A-rated corporate bond index. These indices have returns
and
We denote by
the proportion of the REIT portfolio invested in the global REIT index, and by
the proportion of the total benchmark portfolio invested in the bond index. The return of the benchmark portfolio is
The parameter governs the geographic mix of the benchmark and the parameter
determines its leverage. A positive (negative) value of
indicates that the benchmark has lower (higher) leverage than the REIT portfolio.
To estimate the appraisal-based returns of private real estate, we smooth and lag the (de-)levered market returns of listed equity REITs. The smoothed return of the benchmark portfolio is estimated as
where
is the smoothing parameter.Footnote2 A low value of
indicates a high degree of smoothing. Given a lag parameter
(in trading days), we obtain the benchmark return
where
is the number of trading days during the year.
We then solve for the combination of the four parameters that meets two conditions: (i) the fund’s reported return
has a maximal correlation with the benchmark return
and (ii) the fund’s reported return
has a beta of one with respect to
The details of the optimization are provided in Appendix A. The first condition ensures that the benchmark is comparable to the fund’s real estate portfolio in terms of its geographical mix, smoothing, and lag properties. The second condition ensures that the benchmark has the same volatility as the fund’s real estate portfolio.
Under these conditions, the difference between the fund’s reported return and the benchmark return
corresponds to the net value added of the fund’s real estate portfolio in year
We calculate the fund’s average NVA over the sample period as
and use it as our performance metric.
Our method brings several advantages. It is easy to implement, consistently applicable to real estate portfolios around the World and relies on listed benchmarks that are investible and give real-time information about the risks present in these portfolios (Gyourko & Keim, Citation1992). It also provides a reliable way to estimate the average NVA for a group of funds, whereas peer-based benchmarks imply (by definition) an average NVA of zero for the peer group. This feature is important in the context of our study because our purpose is to estimate the NVA for the group of large Canadian pension funds. Another advantage of our method is that it works well even in the absence of information about the geographic mix, leverage, smoothing, and lag properties of a fund’s real estate portfolio.
One possible limitation of our approach is the risk of over-fitting the data due to the multi-dimensional nature of the optimization. To reduce this risk, we restrict the number of values that the parameters and
can take. The proportion of global REITs
is allowed to vary in 0.05 increments from 0 to 1. The smoothing parameter
can take four possible values: 0.5 (maximum smoothing), 0.67, 0.75, and 1 (no smoothing).Footnote3 The lag parameter
varies from 0 to 520 trading days. The weight in the bond portfolio
is set such that the fund’s reported return
has a beta of one with respect to
for a given combination of parameters
and
In the next Section, we verify that the inferred parameter values are consistent with survey results on the funds’ actual investments.
illustrates the ability of a de-levered, smoothed, and lagged REIT index to match the return properties of a private real estate portfolio. We consider the NCREIF National Property Index (NPI), which tracks a portfolio of U.S. properties, and construct the benchmark portfolio from the S&P U.S. REIT index using the methodology described above.
Figure 1. Application of the benchmarking method to the NPI index. This figure displays the evolution of the National Property Index (NPI, solid black) and its REITs-based benchmark (dotted grey) between 2005 and 2019. We construct the benchmark by de-levering, smoothing, and lagging the S&P U.S. REIT index in a way that maximizes the correlation between the benchmark and the NPI. (A) Reports the REIT index unmodified. (B–D) Report the incremental impacts of the leverage, smoothing, and lag adjustments on the benchmark. For leverage, the benchmark corresponds to a mix with a 48% weight in the REIT index and a 52% weight in the AAA-corporate bond index. The smoothing parameter is 2/3. The lag is 272 trading days.
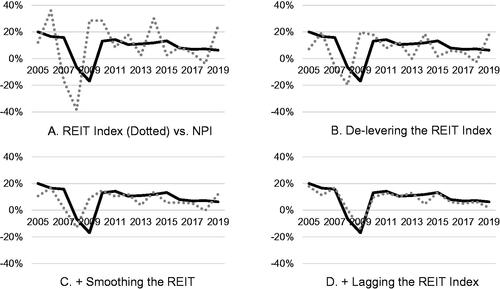
plots the annual return of both indices from 2005 to 2019. The returns of the S&P REIT index (dotted grey) are twice as volatile as those of the NPI in black (19 vs. 9%), and the correlation between both times-series is low (15%). Without adjustments, the REIT index is a poor benchmark for the NPI.
In , we adjust the leverage ratio of the REIT index based on the results of our estimation. The model suggests a value of The result is a significant de-levering of the REIT index, which reduces its volatility to 11%. However, the correlation between the adjusted REIT and the NPI remains low (9%).
In , we smooth the adjusted REIT index. The model suggests a value of which is in the range of estimates by Barkham and Geltner (Citation1995) and Brown and Matysiak (Citation2000). The correlation between the smoothed REIT index and the NPI increases to 41%.
In , we lag the smoothed series by using the model-predicted value of trading days. The returns of the smoothed and lagged benchmark look nearly identical to those of the NPI. Indeed, the correlation between the lagged index and the NPI is equal to 93%, which is large. The lag value predicted by the model is consistent with Gyourko and Keim (Citation1992) who find that fourth-quarter lags of REIT returns work best in predicting the returns of the NPI index.
Altogether, this exercise confirms that using REIT benchmarks and adjusting for their geographical mix, leverage, smoothing, and lag structure makes it possible to evaluate the performance of private real estate portfolios across funds.
Data
We use data from CEM Benchmarking, a Toronto-based global benchmarking company that has collected detailed annual cost and performance data from more than 1000 pension, endowment, and sovereign wealth funds in 18 countries. We retain funds that report a minimum of five years of real estate returns from 2005 to 2019. The choice of 2005 as the starting date comes from the fact that i) we require several years of REIT data to apply the smoothing procedure, and ii) the S&P REIT indices we use become consistently available across countries in the early 2000s. We eliminate the 10% of funds with the lowest return correlation between the benchmark and the funds’ real estate portfolio, as well as funds for which the inferred leverage coefficient is either negative or above 5. All remaining funds have a benchmark correlation above 74%, and the average benchmark correlation is 93%.
We categorize a fund as large if it manages more than $50 bn in 2018.Footnote4 Throughout the paper, dollar values are expressed in USD. reports summary statistics for the full sample and the subset of large funds. In total, there are 241 funds from eight countries (55 Canadian), including 36 large funds (8 Canadian). We group other funds in the category “Rest-of-World” (RoW hereafter). The majority of RoW funds (140) are U.S. funds. We also study the subsets of Canadian and RoW funds that directly manage more than 50% of the real estate portfolio.
Table 2. Summary statistics of pension fund real estate portfolios.
reports the average proportion of assets invested in real estate for Canadian and RoW funds in 2019. Large Canadian pension funds invest significantly more in real estate (14%) than their peers (8.5% for RoW funds). This result is in line with Beath et al. (Citation2021), who find that Canadian pension funds rank first globally in terms of the proportion of AUM invested in real assets.
The table also reports the proportion of real estate assets managed directly. The gap between Canadian and RoW funds is considerable. Large Canadian funds invest 81% of their real estate portfolio directly, whereas RoW funds invest 16% of their real estate directly. Moreover, seven of the eight large Canadian funds invest more than 50% of their real estate portfolio directly, while only four of 28 large RoW funds do so. This significant difference is again consistent with Beath et al. (Citation2021) who find that Canadian pension funds rank first globally in terms of the proportion of total assets managed in-house.
Together, these statistics indicate that Canadian pension funds are significantly more active than their peers in the direct real estate market. For each group of funds, we estimate the proportion of real estate that is directly managed as the product of (i) the average proportion of AUM that is invested in real estate and (ii) the average proportion of real estate that is invested directly. This proportion is for large Canadian pension funds but only 1.2% for large RoW funds. One Canadian pension fund is therefore equivalent to ten RoW funds of the same size in this market.
reports the average inferred values of the
and
parameters of the benchmark portfolios. The values are close to the inferred parameters of the NPI benchmark and are stable across groups of funds, which confirms that the benchmark methodology works well. For example, the average smoothing parameter is
0.62 for Canadian funds and
= 0.63 for RoW funds.
We note that heterogeneity in the bond parameter does not necessarily indicate heterogeneity in the gross asset-to-net asset leverage ratio of the real estate portfolios. The reason for the gap is that the underlying REIT indices have varying leverage ratios. For example, the average Canadian fund has a lower bond weight than the average RoW fund (
0.22 vs. 0.13) but a slightly higher leverage ratio (1.3 vs. 1.24) due to the high leverage of Canadian REITs. The low leverage ratio (1.24) of the seven large Canadian funds with high direct real estate management can be explained by the fact that a subset of them use leverage at the total fund level. The overall leverage is used in part to fund real estate investments at a low cost.
We verify that the leverage ratios inferred from our estimation are consistent with the 2020 CEM Global Leaders survey of 26 of the largest institutional investors in the CEM database. As of 2019, the surveyed leverage ratios ranged from 1.07 to 1.79 with an average value of 1.47. This is in line with the range of leverage ratios reported in Panel B.
In , we report the inferred geographic mix for the real estate portfolios of Canadian, U.S., European, and UK pension funds. The inferred mix takes into account the geographic mix of the underlying REIT indices. According to our estimation, the average exposure to local markets (1-g) was 74% for funds from Europe and UK and 79% for U.S. funds from 2005 to 2019. These values are again close to the results from the 2020 CEM Global Leaders Survey. According to the survey, the average exposure of European and UK funds to local markets was 70% and that of US funds was 82% at the end of 2019.
For Canadian pension funds, the average exposure to the local market (79%) exceeds the average local exposure reported in the CEM Global Leaders survey (57% at the end of 2019). The survey estimate is lower for two reasons. First, funds in the survey are larger than the typical Canadian fund and invest a greater proportion of their assets abroad than smaller funds. Second, the foreign real estate exposure of Canadian pension funds has increased since 2005.Footnote5
Performance of Canadian Pension Funds
We now compare the net value added of Canadian and RoW funds. For each subset of these funds, we report the average, median, and standard deviation of the NVA across funds in .
Table 3. Net value added and expected return.
We generally observe that externally-managed real estate portfolios perform worse than internally-managed portfolios, consistent with the findings of Andonov et al. (Citation2015).Footnote6 This pattern is visible both inside and outside Canada. For example, RoW funds, which mostly include funds that manage the majority of their assets externally, have an average NVA equal to negative 215 bps. A likely explanation is that these funds incur high fees due to the high share of external management.Footnote7 This finding is consistent with the evidence that external investments in private markets tend to underperform (Andonov et al., Citation2021; Beath & Flynn, Citation2020; Gupta & Van Nieuwerburgh, Citation2021; Phalippou & Gottschalg, Citation2009).
Quite strikingly, large Canadian pension funds that invest the majority of their assets directly have the highest NVA among all groups of funds in our sample. Their average NVA of 148bps is statistically significant and economically large. Their median NVA of 295bps is also large, confirming that the large average is not driven by outliers. These results indicate that the real estate strategy pursued by these funds delivers superior performance net of fees.
The strong performance of Canadian pension funds is not restricted to the seven largest funds managing more than $50 bn of real estate investments. The average NVA of the 14 Canadian funds that directly manage a majority of their real estate investments was 138 bps over the sample period. These funds make up 25.5% of Canadian funds and together fully explain the average NVA of Canadian funds (0.255 * 138 = 35 bps).
We emphasize that this strong performance is not driven by the funds’ exposure to the local real estate market. As explained in the previous section, our benchmarking method controls for the parameter that governs the geographic mix of the benchmark. Moreover, we find that the other Canadian funds that manage fewer than $50 billion and a minority of their real estate investments directly have an average NVA that is close to zero.
We also verify that the value added to Canadian pension funds’ real estate portfolios is not just the result of managing assets directly. Using RoW funds as a control group, we find that RoW funds that invest the majority of their real estate portfolio directly outperformed their benchmark by 45bps on average between 2005 and 2019. While this NVA value is positive, it is 100bps lower than that of comparable Canadian funds. Moreover, for the small sample of RoW funds that are both large and invest a high proportion of assets directly, the average NVA was negative 167bps. These statistics confirm that the investment strategy used by large Canadian pension funds is distinct.
Average Return
In , we report the average return of real estate portfolios across the different groups of funds from 2005 to 2019. For each fund, the average annual return is estimated in local currency as the sum of (i) the average return of the corresponding benchmark portfolio over the full period and (ii) the fund’s average NVA. This calculation allows us to make use of the full sample period for each fund and thus avoid a situation in which we compare funds’ average returns over short and different sample periods.
There is a high level of heterogeneity in the funds’ return performance. Part of the performance gap is driven by the performance of local real estate markets. For example, between 2005 and 2019 Canadian pension funds generated an average return of 8.5% while RoW funds generated an average return of 4.3%. This return differential is partly due to the booming real estate sector in Canada, both in the residential and commercial spaces.
The other driver of the heterogeneity in return performance is the funds’ NVA. Consider for example the heterogeneity in the NVA within the group of Canadian pension funds, which all invest heavily in Canada. The average return of the seven large Canadian pension funds with a high share of direct investments was 9.7% from 2005 to 2019. This is 1.2% greater than the average return of all Canadian funds. Such outperformance is significant considering that the return time-series for the seven large funds have a lower implied leverage ratio than that of the average Canadian fund.
Overall, our performance analysis confirms that the real estate strategy implemented by large Canadian pension funds has created significant value in 2005–2019 net of fees.
Green Urban Development
We now take the analysis down to the asset level and investigate the real estate strategy implemented by large Canadian pension funds. The next section reviews data on real estate transactions made by these funds. Then we identify green urban development as a key component of their strategy. The section on Green Urban Development in Large Canadian Cities quantifies and illustrates the size of green urban development in large Canadian cities. Finally, in the section on Beyond LEED-VA Development: Greenfield Projects we describe the funds’ involvement in greenfield projects.
Data
We use data from Preqin, a data provider that collects detailed information on thousands of real estate transactions around the world. The information includes deal size, date, location, sector, asset type, and buyer and seller identification. The dataset goes from 1988 to 2018; however, because 99.9% of reported transactions at the property level took place after 2010, we primarily study the 2010–2018 period. In total, real estate transactions reported in Preqin during this period amounted to USD 2.44 trillion, 61% of which consisted of U.S. properties.
To analyze the deals that directly involve a large pension fund, we restrict the sample to deals where buyers include a fund that manages assets for a pension plan that is worth more than $50bn as of December 31, 2018, according to WillisTower Watson.Footnote8 We include in this list the wholly-owned real estate operating subsidiaries of these funds.
reports statistics of these large pension funds. Six of the 88 pension funds in the list are Canadian. Approximately 50% of RoW funds are U.S. funds. The six Canadian pension funds manage about 6% of total pension fund assets. Their median fund size ($93.35bn) exceeds that of RoW funds ($81.19bn).
Table 4. Summary statistics of real estate deals that directly involve pension funds.
We also report the subset of funds that have made direct real estate deals as reported by Preqin. All six Canadian funds do so but fewer than half of the RoW funds (36) do. Unsurprisingly, funds that directly invest in real estate tend to be larger. The median size of RoW funds is $93.33bn, which is similar to the median size of the large Canadian pension funds.
presents statistics on the real estate transactions made by these funds. There are 139 buy transactions made by Canadian funds and 146 buy transactions made by RoW funds between 2010 and 2018. A typical transaction value ranges between $100 and 110 mn.Footnote9 In total, these transactions amount to 2.4% of all real estate transactions in the sample of Preqin properties. If we also incorporate transactions where sellers include one of these pension funds, then the total value of deals that directly involve a large pension fund corresponds to about 4% of the aggregate value of deals reported in Preqin.
illustrates the extent to which Canadian pension funds are involved in the private real estate market. Between 2010 and 2018, Canadian pension funds directly invested $32.24bn in real estate properties, while RoW funds directly invested $22.38bn. In total, Canadian pension funds were, therefore, responsible for 60% of the total value of real estate acquisitions involving a pension fund. This proportion is 10 times greater than the share of total pension fund assets they manage (6% as reported above). Sell transactions reveal a similar pattern. Canadian pension funds directly sold a total of $20.21bn of real estate properties between 2010 and 2018, whereas RoW pension funds directly sold $13.8bn.
In addition to being more active than their peers in the private real estate market, Canadian pension funds also invest more abroad. We count the total number of foreign countries where pension funds make direct real estate deals that are reported in Preqin. There are 10 foreign countries where deals are made by Canadian pension funds. By contrast, there are on average 2.2 foreign countries where deals are directly made by funds from an RoW country.
In terms of industry sectors, Canadian pension funds invest in a balanced mix of assets. About 41% of their real estate portfolio is invested in office space, 31% is invested in mixed-use properties, and 19% is invested in residential properties. In comparison, RoW funds invest the majority of their portfolio in office properties (46%).
LEED Value-Added Activity
The greenness of a real estate investment can be measured according to a variety of certification programs, including LEED, BREEAM, Energy Star, and others. In this study, we use data from the LEED certification program that is available on the USGBC and CAGBC websites. The LEED certification brings several advantages to our analysis. It is global, widely used in Canada and North America, and covers a wide range of properties, including office, residential, mixed-used, and industrial. Moreover, the LEED certification focuses on environmental initiatives that add value to an asset, as confirmed by Eichholtz et al. (Citation2010), Fuerst and McAllister (Citation2010), and Miller et al. (2008). According to the U.S. Green Building Council (USGBC) website, LEED certification provides: (i) instant recognition for the building; (ii) faster lease-up rates; (iii) higher resale value; (iv) healthier indoor space; (v) lower use of energy, water, and other resources; and (vi) brand enhancement.Footnote10 The capital investment that is required to obtain a LEED certification usually ranges from 2.5 to 9.4% of the property’s value depending on the certification level (Kats, Citation2003; Matthiessen and Morris, Citation2004; Nyikos et al., Citation2012), which is significant.
Another advantage of working with the LEED certification is that the information made available by USGBC and CAGBC includes the street address, level of certification achieved (Platinum, Gold, Silver, Certified), and the dates at which the certification was requested and approved for every certified building. We can therefore track the greenness of every building in a pension fund’s real estate portfolio and tease apart whether a pension fund purchases buildings that are already LEED-certified or actively seeks to obtain the LEED certification after the acquisition.
To this end, we introduce the following terminology. A “LEED value-added (VA)” investment corresponds to a real estate investment where the fund actively seeks some form of LEED certification after having acquired the property and before selling it.Footnote11 This action could either be the registration of a new project, the certification of an existing project, or both. A “premium” investment is one where the fund purchases an asset already LEED-certified and does not make LEED upgrades to it. A “basic” investment is one that does not have any LEED certification throughout the sample.Footnote12
In the first set of rows of , we report the portfolio allocation in basic, premium, and LEED value-added properties.Footnote13 Canadian funds invest 27% of their assets in LEED-VA strategies. In comparison, RoW funds invest only 14% of their assets in LEED-VA strategies. The majority of assets held by RoW funds are invested in basic strategies (74%). The evidence thus reveals that Canadian pension funds are significantly more involved in green urban development than RoW funds as measured by LEED activity.
Table 5. Comparison of green value-added activity across pension funds.
Once we account for the fact that LEED certification is most common in U.S. office space, the gap between Canadian funds and RoW funds’ involvement in LEED-VA strategies increases. In the second set of rows of , we report the composition of basic, premium, and LEED-VA assets within the portfolio of U.S. office properties. Canadian funds invest approximately half (48%) of their portfolio of direct U.S. office acquisitions into LEED-VA assets, whereas RoW funds only invest 20% of their portfolio in these assets.
provides additional insights into the nature of these LEED-VA assets. We zoom in on the 39 properties that were bought by the pension funds and then sold again between 2010 and 2018. The table confirms the dominance of Canadian pension funds in this market, which are responsible for 24 of the 39 transactions.
further shows that Canadian pension funds are more likely to directly purchase properties, increase their value through LEED-certification, and then re-sell the properties afterward. Buy-and-sell transactions indeed represent a greater fraction of total transaction volume for Canadian funds (17%) than for RoW funds (5%), which indicates greater turnover. Moreover, these transactions are mostly LEED-VA transactions for the Canadian funds (61%) whereas virtually all transactions made by RoW funds are either basic or premium.
In the final part of our analysis based on Preqin data, we focus on the geographical breakdown of basic, premium, and LEED-VA assets for all buy deals made by Canadian funds. shows that LEED-VA assets amount to 41% of their investments in Canadian properties, 35% of their investments in U.S. properties, and 0% of their investments in other foreign properties. Therefore, Canadian funds are much more likely to conduct the internal green value-added activity for real assets close to home.
Green Urban Development in Large Canadian Cities
To further investigate the green urban development strategy implemented by Canadian pension funds in large Canadian cities where the funds are most involved, we augment the dataset by manually collecting hundreds of real estate transactions from the funds’ annual reports and press releases for the nine largest Canadian pension funds. These funds consist of Alberta Investment Management Corporation (AIMCo), British Columbia Investment Management Corporation (BCI), La Caisse des Dépots et Placements du Quebec (CDPQ), Canada Pension Plan Investment Board (CPPIB), Healthcare of Ontario Pension Plan (HOOPP), Investment Management Corporation of Ontario (IMCO), Ontario Municipal Employees’ Retirement System (OMERS), Ontario Teachers Pension Plan (OTPP), and Public Sector Pension Investment (PSP). The information we collect includes the street address, building use, and the date of the development or acquisition of the property.
To capture building size, we obtain mapping data on land parcels and buildings. This information is available online for Toronto, Vancouver, and Montreal—Canada’s three largest cities.Footnote14 We convert addresses into geocodes, geocodes into land parcels, and then land parcels into buildings. The use of land parcels as an intermediary step allows us to address cases where the geocode does not directly intersect with building data. These cases arise for buildings that only take up a fraction of the land parcel and buildings with varying sections of elevation.Footnote15 Our spatial matching procedure ensures that all buildings owned by Canadian pension funds are properly captured.
Using our data on deals and LEED certification, we construct 3-D maps of the properties developed and/or acquired by the top nine Canadian pension funds in Toronto, Montreal, and Vancouver. presents a map of the Toronto downtown area where the pension fund activity is most pronounced. The blue and green colors, respectively indicate basic and LEED-VA investments. The red boundaries delineate Toronto’s financial district.
Figure 2. Canadian pension fund ownership and green development of Toronto. This figure displays the real estate properties directly owned and greened by the top nine Canadian pension funds in Toronto’s downtown area. Blue properties are not LEED certified (“basic”). Green properties have obtained LEED certification by the pension funds (“value-added”). The red boundary delineates Toronto’s financial district. The orange boundary delineates Toronto’s South Core district.
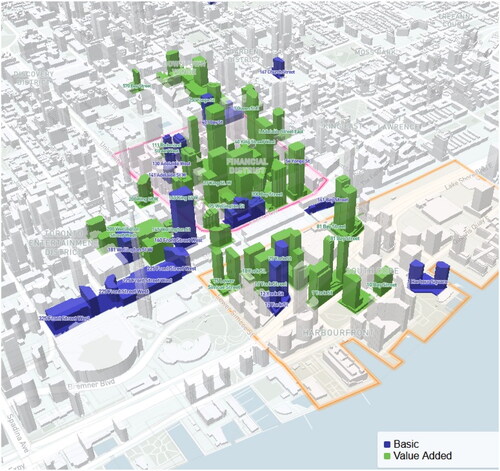
The map illustrates the magnitude of green urban development by the nine large Canadian pension funds. Almost all buildings in Toronto’s financial district are directly owned by these funds.Footnote16 The vast majority of these buildings have obtained some form of LEED certification under the funds’ ownership, as evidenced by the dominance of green-colored buildings. Once we move away from the city center, the proportion of buildings owned by pension funds rapidly declines.
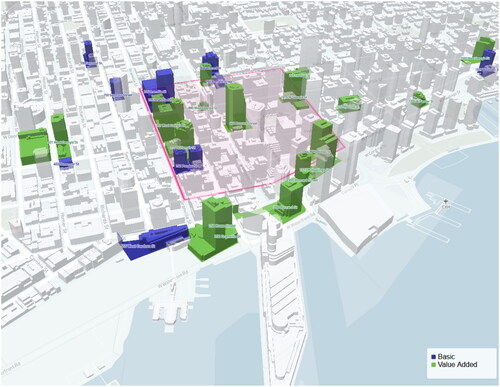
and present equivalent 3-D maps for Montreal and Vancouver. The dark green color on the Montreal map indicates a premium investment. Both maps show the same pattern. Canadian pension funds own and green a large proportion of properties in the downtown areas, and their activity rapidly declines outside these areas.Footnote17 Altogether, these figures reveal a systematic pattern of LEED-VA activity.
Figure 3. Canadian pension fund ownership and green development of Montreal. This figure displays the real estate properties directly owned and greened by the top nine Canadian pension funds in Montreal’s downtown area. Blue properties are not LEED certified (“basic”). Green properties have obtained LEED certification by the pension funds (“value-added”). The dark green property obtained LEED certification before being acquired by pension funds (“premium”). The red boundary delineates Montreal’s financial district. The orange boundary delineates Montreal’s Quartier des Gares.

Figure 4. Canadian pension fund ownership and green development of Vancouver. This figure displays the real estate properties directly owned and greened by the top nine Canadian pension funds in Vancouver’s downtown area. Blue properties are not LEED certified (“basic”). Green properties have obtained LEED certification by the pension funds (“value-added”). The red boundary delineates Vancouver’s financial district.
The maps likely understate the true level of LEED-VA activity by Canadian pension funds for several reasons. It may be that we have not identified the full list of properties owned by the top nine pension funds, as only the largest deals are made publicly available. It may also be that some of the remaining downtown properties are owned by Canadian pension funds outside the top nine. Additionally, several of the non-LEED-certified buildings in blue correspond to buildings under construction that are expected to obtain LEED certification in the future. Finally, the building maps for Montreal and Vancouver are from 2016 and 2009, respectively, so any building developed after these dates is missing from the maps.
An additional statistic of interest is the proportion of buildings that obtained LEED Platinum, the highest level of LEED certification. Only 4% of all Canadian projects have obtained Platinum certification according to the CAGBC database. In Toronto, 26 buildings have obtained it. Seventeen of these buildings (65%) correspond to LEED-VA projects by five of the top nine Canadian pension funds. These results show that Canadian pension funds have played a significant role in bringing Toronto’s properties to the highest LEED standards.
Beyond LEED-VA Development: Greenfield Projects
LEED-VA activity on existing buildings only represents a fraction of the Canadian pension funds’ real estate strategy. We also find that these funds undertake large greenfield projects where they purchase the land and develop the green properties themselves.
The maps in show that Canadian pension funds are highly active in developing up-and-coming districts near the city centers. In Toronto, Canadian pension funds developed the majority of towers in Toronto’s emerging South Core district near the waterfront, as delineated by the orange boundaries on the map. These towers include the Telus Tower (HOOPP), RBC WaterPark place (OMERS), and CIBC Square (CDPQ). In Montreal, pension fund activity is highest in the Quartier des Gares which was established in 2015 (again delineated by the orange boundaries). Examples of development projects in this district include the Deloitte Tower and Tours des Canadiens (OTPP).
To quantify local greenfield activity by Canadian pension funds, we use data from the Council on Tall Buildings and Urban Habitat (CTBUH) which provides information on the developers of skyscrapers for each major city.Footnote18 We focus on Toronto because the information available is the most complete. Toronto ranks among the world’s top cities in terms of the number of skyscrapers taller than 150 m that are completed (#19 with 80 buildings as of July 2022) and under construction (#8 with 27 buildings as of February 2022).Footnote19
We find that the proportion of buildings developed by Canadian pension funds is large. Two of the tallest 10 towers in Toronto that are under construction (CIBC Square II and 160 Front St West) are Canadian pension fund projects. Moreover, the towers developed by these funds are more likely to obtain Platinum certification. For example, if we focus on the 50 tallest towers in Toronto that are either completed or under construction, two of the five towers already developed by Canadian pension funds have obtained LEED Platinum. In contrast, only one of the 11 towers developed by non-pension funds has obtained it. That tower, Scotia Plaza, obtained LEED Platinum in 2020 after the Canadian pension fund AIMCo became a major shareholder in 2016.
Discussion
Our findings highlight a possible investment strategy for other large asset owners to follow. In this Section, we discuss the benefits and risks of this strategy and conclude with several questions for future analysis.
Distinct Features of the Green Urban Development Strategy
The green urban development strategy pursued by Canadian funds has several distinct features. First, it is done mainly in-house. The benefits of internal management are low fees due to the elimination of financial intermediaries. As a result, Canadian funds have the ability to extract the full economic profit from the real estate ventures. In comparison, most institutional investors outsource the majority of their private investments to external fund managers and consequently incur large fees that frequently offset the active gains on the portfolio. Additional benefits of pursuing the green urban development internally include full control of the assets, direct communication between owners and managers, and a lower cost of project financing since any debt issuance can be done at the total portfolio level instead of the project level.
The green urban development strategy is also distinct in the way it departs from the well-known forms of pension fund activism (Barber, Citation2020; Del Guercio & Hawkins, Citation1998; Wahal, Citation1996). Pension funds typically aim to engage with large public firms where they own a sizeable ownership stake. By contrast, Canadian pension funds share the ownership of real estate projects with few investors and focus on project execution, by concentrating their efforts on developing and greening urban properties.
Risk-Mitigation
Developing and managing real assets involves several legal and operational risks. There are also liquidity risks related to the long-term nature of development projects, and risks associated with the real estate industry (Ling et al., Citation2020).
We discuss several strategies asset owners can use to mitigate these risks. One risk-mitigating strategy is the application of green urban development to a specific set of projects which are well defined (i.e. construction of a downtown tower), can be replicated in multiple cities, and have a risk profile that naturally matches the long-term bond profile of the funds’ liabilities. Our analysis indeed confirms that the green buildings developed by large Canadian pension funds are mostly limited to standard multi-use properties located in prime downtown locations of major cities with diversified industries.
A second risk-mitigating strategy is the concentration of projects. Focusing on a set of projects in a particular neighborhood brings multiple advantages. It allows the fund to work in an environment that it knows well and thus better manages the operational risks (Huffman, Citation2002). In other words, concentration acts as a risk mitigant from an operational perspective. Working on local projects also allows the fund to align the risk of its pension liabilities to its assets since local properties correlate more with the fund’s liabilities than foreign properties do. Finally, developing a complete neighborhood allows the fund to generate housing externalities (Rossi-Hansberg et al., Citation2010).
In line with this logic, we find that Canadian pension funds do the majority of green urban development in highly localized markets. If we define Montreal as the home market of CDPQ and PSP and Toronto as the home market of CPPIB, OTPP, OMERS, and HOOPP, we find that, for each fund, the home market represents at least 75% of its LEED-VA projects that we have collected across all three cities.
We further find that, inside a particular city, Canadian pension funds tend to concentrate their investments in a few locations. A good example is OTPP’s recent investments in Montreal’s Quartier des Gares (Windsor Station, Deloitte Tower, and the multiple Tours des Canadiens) which are all located within a few steps of the central train station. Another example is OMERS’s large investment in Quartier DIX30, a 2.3 million square feet multi-use complex in Brossard, which is a municipality part of the Greater Montreal area that will soon serve as a station for the Réseau express métropolitain (REM) network.
A third risk-mitigating strategy is the use of a wholly-owned real estate operating subsidiary. Examples of subsidiaries in Canada include Ivanhoe Cambridge (CDPQ), Cadillac Fairview (OTPP), Oxford Properties (OMERS), QuadReal (BCI), HOOPP Realty (HOOPP), and AIMCo Realty (AIMCo). The use of a subsidiary provides several advantages. One advantage is experience. Subsidiaries, such as Cadillac Fairview, which was purchased by OTPP in 2000, have acquired decades of experience in developing and managing hundreds of real estate projects. Experience not only helps to identify valuable development opportunities and manage operational risks but also to establish long-term relationships with suppliers and retailers that lease the space.
Another advantage of using a subsidiary has to do with protection from legal risks. Because subsidiaries are limited-liability entities, they do not engage the funds’ investments outside the subsidiary. Additionally, a subsidiary provides flexibility regarding employee compensation. Compensation contracts in limited partnership funds tend to be long, complex, and different from contracts of buy-side institutional funds (Phalippou, Citation2009). Having a subsidiary can make it easier for pension funds to set up these types of contracts while keeping the investments in-house.
Finally, by fully owning the subsidiary, asset owners can mitigate agency conflicts that arise when ownership is fragmented. Typical conflicts include expropriation or inefficient use of funds by managers when investors have limited ability to control the firm’s assets. Having large shareholders can mitigate these problems because they have both a general interest in profit maximization and sufficient control over the assets of the firm (Shleifer & Vishny, Citation1997).
Expanding Green Urban Development?
Our analysis shows that green urban development can be a successful investment strategy for asset owners that can carefully manage the risks and generate economies of scale. The asset owners we have studied in this paper are large pension funds with sizable in-house teams.
Several questions arise from our analysis. Is LEED-VA the only form of green urban development? We have used the LEED certification for the purpose of our analysis, but it may be that other certification programs provide similar benefits to investors in terms of value-added gains and environmental benefits.
Has the existing market for green urban development reached a point of saturation? On the one hand, the 3-D map of Toronto shows that the majority of downtown buildings have already been retrofitted to existing LEED standards. On the other hand, the growing integration of ESG into corporate business models may encourage demand for green urban development outside city centers. For example, condominium units or office buildings that are located either in smaller cities or outside the major city centers could become prime targets for green retrofitting moving forward. A notable example is Downsview Airport in Toronto, which was purchased by PSP in 2018 and is currently being converted into a mixed-use urban community.
Finally, can smaller pension funds successfully implement green urban development? The strategy we have uncovered requires scale and the ability to conduct operations in-house. A scaled-down version could potentially be achieved either through co-investments or through direct investments in smaller buildings. Here again, the current ESG wave could make such a strategy possible for smaller pension funds. We leave these questions for future research.
Acknowledgments
Omar Mohsen, Oriane Pacic, and Frederic Sfeir provided outstanding research assistance. We thank Jonathan Critchley for help with the 3D-mapping and Chris Flynn, Eric Fontaine, Mario Lefebvre, Luc McSween, Mark Staley, Eduard van Gelderen, and seminar participants at the Bank of Canada, KPMG, and the 2021 National Pension Hub Insight Series for insightful comments. The views and opinions expressed in this paper are solely those of the authors. They do not necessarily reflect the views or opinions of the Public Sector Pension Investment Board. All errors are our own.
Additional information
Funding
Notes
1 This form of alpha resulting from value-added improvement is also referred to as the gamma of the expected return of a real estate portfolio (Kaiser, Citation2005).
2 Because time-series of S&P REIT indices we use only become consistently available across countries in the early 2000s, we use three return values of the indices to estimate the smoothed return of the benchmark portfolios (i.e. RB,i,t, RB,i,t-1, RB,i,t-2). Their weights are then re-scaled so that they sum up to 100%, and earlier index returns are assigned a weight of zero.
3 We set a lower bound of 0.5 for the smoothing parameter s, consistent with the estimates of Barkham and Geltner (Citation1995). If we use values of s below 0.5, the volatility of the smoothed benchmark portfolio becomes so small that it is no longer possible to match the volatility of the fund’s reported return unless we apply an unreasonably high degree of leverage.
4 For a small proportion of funds the information on 2018 is unavailable. So their AUM value corresponds to the latest available year.
5 According to the annual reports published by large Canadian pension funds, the proportion of their real estate assets invested in Canada has generally decreased from 2009 to 2017. For example, Public Sector Pension Investment (PSP Investments)’s share decreased from 51 to 21%, La Caisse des Dépots et Placements du Quebec (CDPQ)’s share decreased from 43 to 32%, Alberta Investment Management Corporation (AIMCo)’s share decreased from 97 to 71%, Canada Pension Plan Investment Board (CPPIB)’s share decreased from 56 to 15%, and Healthcare of Ontario Pension Plan (HOOPP)’s share decreased from 99 to 69%.
6 The performance analysis in Andonov et al. (Citation2015) uses benchmark returns from the funds’ reported real estate benchmarks. Using our common benchmarking approach, we also find that direct real estate management generally leads to superior performance.
7 Another possible explanation is that several large U.S. funds suffered large losses during the 2008 Great Financial crisis due to highly leveraged positions and subsequently de-levered their portfolio as part of the re-structuring. For example, California Public Employees’ Retirement System (CalPERS) posted a negative total return of −48.7% in the first nine months of 2009 according to “CalPERS considers real estate clearout” by Richard Lowe, IPE Real Assets, December 14, 2009. However, we note that the median NVA of RoW funds is also significantly negative, which confirms that the negative average NVA of these funds is not driven by the actions of a few funds.
8 WillisTower Watson Thinking Ahead Institute, Pensions & Investments, World 300. In total there are 90 funds that manage more than USD 50 billion. Two of these funds, however, are managed by CDPQ. We exclude Norway’s Government Pension Fund as it mainly represents the country’s sovereign wealth fund. This leaves a total of 88 funds.
9 In many cases, transactions consist of portfolios involving multiple properties. We approximate the value of each property as the total value of the deal divided by the number of properties mentioned in the deal.
10 The information is available at https://new.usgbc.org/leed and at www.cagbc.org.
11 For deals where we only observe the year of acquisition instead of the exact date, we assume that a LEED action that takes place in the same year counts as a value-added activity.
12 A “basic” investment should not interpreted as being not green. Even though the building has no LEED certification, it may have another green certification.
13 In the Appendix, we break down the different types of LEED value-added activity: LEED registration only, LEED certification only, and the combination of registration and certification. Across all types of funds, the bulk of value-added projects involves the full LEED certification process.
14 This information is available at https://open.toronto.ca, https://opendata.vancouver.ca and http://donnees.ville.montreal.qc.ca.
15 Buildings with varying elevation are categorized as a collection of sub-buildings. Therefore, without the use of land parcels as an intermediary step, we would only capture the part of the building that intersects with the geocode data.
16 We use the boundaries provided by the Wikipedia page https://en.wikipedia.org/wiki/Financial_District,_Toronto. The boundaries are Queen St W to the north, Yonge St to the east, Front St to the south, and University Ave to the west.
17 For Montreal’s and Vancouver’s financial districts, we set approximate boundaries based on publically available information.
18 The data is available at www.skyscrapercenter.com.
19 This information is available at https://open.toronto.ca. Statistics on the number of buildings come from www.skyscrapercenter.com.
References
- Ambachtsheer, K. (2016). The future of pension fund management. Wiley Finance Editions.
- Ambachtsheer, K. (2021). The Canadian pension model: Past, present, and future. The Journal of Portfolio Management, 47(5), 150–158. https://doi.org/10.3905/jpm.2021.1.216
- Andonov, A., Eichholtz, P., & Kok, N. (2015). Intermediated investment management in private markets: Evidence from pension fund investments in real estate. Journal of Financial Markets, 22, 77–103. https://doi.org/10.1016/j.finmar.2014.11.002
- Andonov, A., Kräussl, R., & Raugh, J. (2021). Institutional investors and infrastructure investing. The Review of Financial Studies, 34, 3880–3934. https://doi.org/10.1093/rfs/hhab048
- Barber, B. (2020). Chapter 15: Pension fund activism: A double-edged sword. In O. Mitchell and G. Anderson (Eds.), The future of public employee retirement systems. Oxford University Press.
- Barber, B., Morse, A., & Yasuda, A. (2021). Impact investing. Journal of Financial Economics, 139(1), 162–185. https://doi.org/10.1016/j.jfineco.2020.07.008
- Barkham, R., & Geltner, D. (1995). Price discovery in American and British property markets. Real Estate Economics, 23(1), 21–44.
- Beath, A., Betermier, S., & Spehner, Q. (2021). The Canadian pension fund model: A quantitative portrait. The Journal of Portfolio Management, 47(5), 159–177. https://doi.org/10.3905/jpm.2021.1.226
- Beath, A., & Flynn, C. (2020). Benchmarking the performance of private equity porfolios of the world’s largest institutional investors: A view from CEM benchmarking. The Journal of Investing, 30(1), 67–87. https://doi.org/10.3905/joi.2020.1.155
- Bédart-Pagé, G., Demers, A., Tuer, E., & Tremblay, M. (2016). Large Canadian public pension funds: A financial system perspective. In Financial system review (pp. 33–38). Bank of Canada.
- Berk, J., & van Binsbergen, J. H. (2022). The impact of impact investing. Working paper.
- Betermier, S., Calvet, L., & Jo, E. (2022). A supply and demand approach to capital markets. Working paper.
- Brown, G. R., & Matysiak, G. A. (2000). Sticky valuations, aggregation effects, and property indices. Journal of Real Estate Finance and Economics, 20(1), 49–66.
- Del Guercio, D., & Hawkins, J. (1998). The motivation and impact of pension fund activism. Journal of Financial Economics, 52, 293–340. https://doi.org/10.1016/S0304-405X(99)00011-2
- Eichholtz, P., Kok, N., & Quigley, J. (2010). Doing well by doing good? Green office buildings. American Economic Review, 100(5), 2492–2509. https://doi.org/10.1257/aer.100.5.2492
- Fuerst, F., & McAllister, P. (2010). Green noise or green value? Measuring the effects of environmental certification on office values. Real Estate Economics, 39(1), 45–69. https://doi.org/10.1111/j.1540-6229.2010.00286.x
- Geltner, D. (1989). Estimating real estate’s systematic risk from aggregate level appraisal-based returns. Real Estate Economics, 17(4), 463–481. https://doi.org/10.1111/1540-6229.00504
- Gyourko, J., & Keim, D. B. (1992). What does the stock market tell us about real estate returns? Journal of the American Real Estate and Urban Economics Association, 20(3), 457–485.
- Gupta, A., & Van Nieuwerburgh, S. (2021). Valuing private equity investments strip by strip. The Journal of Finance, 76(6), 3255–3307. https://doi.org/10.1111/jofi.13073
- Huffman, F. (2002). Corporate real estate risk management and assessment. Journal of Corporate Real Estate, 5(1), 31–41. https://doi.org/10.1108/14630010310811984
- Kaiser, R. W. (2005). Analyzing real estate portfolio returns. The Journal of Portfolio Management, 31(5), 134–142. https://doi.org/10.3905/jpm.2005.593896
- Kats, G. H. (2003). Green building costs and financial benefits. Massachusetts Technology Cooperative.
- Ling, D., Wang, C., & Zhou, T. (2020). A first look at the impact of COVID-19 on commercial real estate prices: Asset-level evidence. The Review of Asset Pricing Studies, 10, 669–704. https://doi.org/10.1093/rapstu/raaa014
- Lipshitz, C., & Walter, I. (2020). Public pension reform and the 49th parallel: Lessons from Canada for the U.S. Financial Markets, Institutions & Instruments, 29(4), 121–162. https://doi.org/10.1111/fmii.12133
- Matthiessen, L. F., Morris, P. (2004). Costing green: A comprehensive cost database and budgeting methodology. https://www.usgbc.org/resources/costing-green-comprehensive-cost-database-and-budgeting-methodology
- Miller, M., Spivey, J., & Florance, A. (2008). Does green pay off? Journal of Real Estate Portfolio Management, 14(4), 385–400. https://doi.org/10.1080/10835547.2008.12089822
- Nyikos, D., Thal, A., Hicks, M., & Leach, S. (2012). To LEED or not to LEED: Analysis of cost premiums associated with sustainable facility design. Engineering Management Journal, 24(4), 50–62. https://doi.org/10.1080/10429247.2012.11431955
- Phalippou, L. (2009). Beware of venturing into private equity. Journal of Economic Perspectives, 23(1), 147–166. https://doi.org/10.1257/jep.23.1.147
- Phalippou, L., & Gottschalg, O. (2009). The performance of private equity funds. Review of Financial Studies, 22(4), 1747–1776. https://doi.org/10.1093/rfs/hhn014
- Rossi-Hansberg, E., Sarte, P., & Owens, R. (2010). Housing externalities. Journal of Political Economy, 118(3), 485–535. https://doi.org/10.1086/653138
- Shleifer, A., & Vishny, R. (1997). A survey of corporate governance. The Journal of Finance, 52(2), 737–783. https://doi.org/10.1111/j.1540-6261.1997.tb04820.x
- Stambaugh, R. F., & Taylor, L. A. (2020). Sustainable investing in equilibrium. Journal of Financial Economics, 142(2), 550–571. https://doi.org/10.1016/j.jfineco.2020.12.011
- Wahal, S. (1996). Pension fund activism and firm performance. The Journal of Financial and Quantitative Analysis, 31(1), 1–23. https://doi.org/10.2307/2331384
- Zerbib, O. (2022). A sustainable capital asset pricing model (S-CAPM): Evidence from green investing and sin stock exclusion. Review of Finance. https://doi.org/10.1093/rof/rfac045
Appendix A
This Appendix presents additional empirical results and provides more details about the benchmark estimation method.
Estimation of Benchmarking Method
In the estimation of our benchmarking methodology, the weight in the bond portfolio is set such that the fund’s reported return
has a beta of one with respect to the benchmark return
for a given combination of parameters
and
We define as the univariate beta of the fund’s real estate portfolio with respect to the benchmark. By definition,
satisfies
where N corresponds to the number of annual observations of the return
and
is the expectation operator.
Solving for implies
For a given combination of parameters and
solving for the remaining parameter
amounts to solving the quadratic equation above. If no solutions are found, there is no benchmark such that the fund has a beta of one for the combination of parameters
and
When one or more solutions are found, we select the values of the parameters
that maximize the correlation between the fund return
and the benchmark return
LEED Activity around the World
In the main text, we use LEED certification activity as a proxy for green value-added investments. We now show that LEED certification varies by sector and geography in our sample of Preqin deals involving a pension fund.
reports statistics about LEED green building certification on Preqin deals made by all large pension funds between 2010 and 2018. For each industry sector and geography, we report the percentages of properties that are not LEED certified (“basic”), properties that were already LEED-certified prior to the acquisition by pension funds and did not receive additional certification afterwards (“premium”), and properties where pension funds actively sought some form of LEED certification after having acquired the property and before disposing it (“LEED-VA”). We see that mixed-use and office-space properties in Canada and the U.S. are the most likely to qualify as premium or LEED-VA.
Table A.1. Green value-added activity by pension funds.
reports the geography distribution of all LEED projects reported in the USGBC database. The distribution is weighted either by the number of projects or their square footage. We see that LEED projects are predominantly based in the U.S.
In , we break down the different types of LEED value-added activity: LEED registration only, LEED certification only, and the combination of registration and certification. For both Canadian and RoW funds, the bulk of value-added projects goes beyond registration and generally involves the full LEED certification process.
Table A.2. Types of value-added activity.