
 ?Mathematical formulae have been encoded as MathML and are displayed in this HTML version using MathJax in order to improve their display. Uncheck the box to turn MathJax off. This feature requires Javascript. Click on a formula to zoom.
Abstract
Several studies have investigated the relationship between the energy performance of buildings and housing prices. First, this paper identifies a price premium for energy efficiency within the German rental market. Then, the indexed price differences and associated marginal benefits are compared with the marginal costs of energy retrofits. An extensive database of Germany’s largest online platform for housing over a time span from 2016 to 2020 is used in a hedonic regression approach. In addition, to extract the marginal costs of energy consumption abatement, a dataset of 1048 rental units regarding green-retrofit measures is utilized. Although a significant green premium is identified in the rental market, the findings suggest that it is not high enough to compensate landlords for the money they have to spend to retrofit. The marginal costs exceed the marginal benefits by far. Furthermore, it is found that the German government’s recent plans to split the carbon tax between landlords and tenants do not change this because the price per metric ton of carbon is insufficiently high. Limitations with respect to the data basis and consequently to the interpretation of the results exist. Nevertheless, the findings can help both tenants and landlords in their decision-making, as well as policy makers in the implementation of decarbonization efforts.
Introduction
The most recent Assessment Report of the Intergovernmental Panel on Climate Change (IPCC) made it clear once again that the world’s climate is in danger and that drastic steps will be necessary to stem the tide of global warming (Masson-Delmotte et al., Citation2021). The building sector plays a particularly important role in this. After all, 27% of total global energy-related CO2 emissions come from the operation of buildings, and a further 10% from the construction industry as of 2020 (United Nations Environment Programme, Citation2021). To achieve the goal of the Paris Agreement (UNFCCC, Citation2015), to limit the global temperature rise to well below 2°Ccompared with pre-industrial times (and to make efforts to limit the temperature rise to 1.5 degrees), the European Union (EU) submitted a Nationally Determined Contribution (NDC) which states that the European economy should reach net zero by the year 2050 (European Commission). This goes hand-in-hand with the widespread decarbonization of the building sector. To meet this challenge, the European Commission presented its strategy for a so-called “Renovation Wave” for climate neutrality and market recovery on October 14, 2020, as part of the European “Green Deal” (European Commission, Citation2020). Accordingly, the annual building renovation rate is to be at least doubled by 2030. Currently, about 75% of buildings in the EU are not energy efficient, but 85–95% of today’s existing buildings will still be in use in 2050. Tools like the Carbon Risk Real Estate Monitor (CRREM) (see Hirsch et al., Citation2019), and the wide availability of Energy Performance Certificates (EPCs) have increased both transparency and the ability to identify buildings in need of an energetic update. At the same time, the rate of annual energy retrofits in the residential building stock in both Europe and Germany is at only about 1% of the total stock (European Commission, Citation2019). The Revised Energy Performance of Buildings Directive mandates that the worst performing 15% of the residential building stock have to be upgraded until 2030 from the current EPC label G to at least label F (European Commission, Citation2021).
For Germany, the rented residential building stock plays an outstandingly important role for climate impact reduction in comparison to other European countries, as the homeownership rate is below 50% and thus the lowest in the Eurozone (Andrews & Caldera-Sánchez, Citation2011; Eurostat, Citation2019). In contrast to owner-occupied dwellings, there is a problem with the energy efficient renovation of rented buildings that is frequently mentioned in the literature: The Split Incentive Problem or Landlord-Tenant Dilemma (Schleich & Gruber, Citation2008). This dilemma is indeed an obstacle to the renovation of many rented buildings. However, one party, the landlord, must invest the costs of a retrofit, he cannot benefit directly from the advantages this investment brings. The tenant, on the other hand, benefits directly from the energy renovation, as he faces lower heating costs and enjoys improved thermal comfort after a retrofit. But he, the tenant, has no influence on the investment to achieve energy efficiency. Consequently, there must be another channel to compensate the landlord for the investment or he would not retrofit his property in the first place. Although there are tools that could be used to reduce the split incentive problem, such as green leases that include a cost-benefit sharing mechanism, they require a certain amount of expertise and are not very common in Germany (Cajias et al., Citation2019). At the beginning of 2021, a uniform CO2 tax was introduced on fuels for heat generation, which is levied on the heating costs. The costs for the CO2 tax were intended to be shared equally between tenants and landlords, but this ruling was overturned. For the time being, 100% of the tax burden is borne by the tenant. Thus, a rent increase remains the most effective way for landlords to recover the investment costs for green retrofits. In this regard, the question of whether higher rents can be achieved by improving the energy efficiency of a property is important for landlords to ask themselves before commissioning any measures (Fuerst et al., Citation2020). In an existing lease, it is possible to increase the rent within a narrow framework. Another aspect that increases the benefit of lower energy consumption of an apartment in the future from the landlord’s perspective is tax savings. This is the case because the new German government that is made up of three parties, namely Social Democrats (SPD), Green party and Liberals (FDP) recently announced that the carbon tax burden will be split between landlords and tenants on a consumption-independent basis (SPD et al., Citation2021).
This paper analyses how energy performance is transferred to the rent of an apartment and tests if green premia are present. To do so, an extensive dataset of rental listings in Germany is examined, wherein the energetic conditions from Energy Performance Certificates (EPC) are utilized as central exogenic variables. In addition, a dataset with energy modernization data of multi-family houses in Germany is used to calculate marginal costs for energetic improvements in the context of building renovation. The central research question of the present study is threefold. The first part explores the question of whether, in the German market for rented apartments in multi-family buildings, there is a price premium for energy efficiency (green premium). Provided that a price premium is indeed found, the subsequent research-focus is on whether the rent increase potential from an improvement in energy efficiency is sufficient to offset the costs of a retrofit, over the expected useful life of the asset. If this is rejected, it is necessary to investigate whether the regulatory framework that is currently in place in Germany provides sufficient incentives for the implementation of energy efficiency measures. In this respect, it will be examined whether the current level and design of the CO2 tax on fossil fuels for residential heating in Germany provide a sufficiently strong incentive for owners of energetically poor multi-family houses to retrofit their properties for energy efficiency.
The paper is organized as follows. The next section introduces the theoretical background and reviews literature on the topic. Then, the two datasets are described, whereas in the subsequent section, the methodology of both the statistical model estimation and derivation of marginal benefit and marginal cost curves is presented. The results of the hedonic pricing model as well as the derived curves are placed in relation to each other and supplemented by the influence of the assumed future course of the CO2 taxation in the penultimate section. The last section concludes the paper.
Literature Review
In the field of research on the influence of energy efficiency on the price of buildings and the achievable rents, a multitude of studies have emerged which can generally be divided into two main strands. One refers to green labels which are based on certain characteristics, and the other focuses on absolute energy consumption to proxy for energy efficiency. Early examples of both date back to the 80s (Gilmer, Citation1989; Johnson & Kaserman, Citation1983). Since then, the price effect of green labels in commercial real estate has been investigated in many studies (Addae-Dapaah & Wilkinson, Citation2020; Fuerst & McAllister, Citation2011; Kok et al., Citation2012; Robinson & McAllister, Citation2015; Simons et al., Citation2014; Wiley et al., Citation2010). Also, in an extensive body of literature, EPCs have been utilized to implement energy efficiency in hedonic modeling, and test its price effect. The first to demonstrate that higher energy efficiency, as measured by EPC ratings, is capitalized into purchase prices, was Brounen and Kok (Citation2011) who studied transactions of about 32,000 residential properties that occurred between 2008 and 2009 in the Netherlands. They found that properties with a green label rated A, B, or C had a premium of 10%, 5.5%, and 2.2%, respectively, relative to properties rated D.Footnote1 In subsequent studies, this fundamental relationship of a significant price premium for green buildings has been confirmed several times for different housing markets, but with varying premium levels (Cadena & Thomson, Citation2021; Cajias & Piazolo, Citation2013; Copiello & Donati, Citation2021; Dell’Anna et al., Citation2019; Fuerst et al., Citation2016; Kholodilin, Mense, & Michelsen, Citation2017; Taltavull de La Paz et al., Citation2019). A few studies, however, indicate that there is no significant, a negligibly small or even a negative relationship. The findings of Cerin et al. (Citation2014), for example, suggest that energy efficiency causes a price premium only for certain age and property-price classes in the Swedish residential market. Interestingly, Yoshida and Sugiura (Citation2010) identified a price discount in the Tokyo market for newly constructed green condominiums of 5.5%, while green condominiums on average are traded at a premium. Also, meta-analyses, such as that of Cespedes-Lopez et al. (Citation2019), have emphasized that the effects are not unambiguous and their strength depends strongly on the way the EPC rating is included in the analysis and on the region considered. By meta-regression, they aggregated the results of 66 prior studies and find that EPCs entail an overall price premium of 4.2%. However, this varies when broken down by continent. Average premiums of 5.36% are observed in North America, 4.8% in Asia, and the lowest in Europe, on average 2.3%. Similarly, Wilkinson and Sayce (Citation2020) in another meta-analysis examined, in a European context, the relationship between EPCs and capital (or rental) values. They once more verify that the majority of research shows there is a positive relationship between observed market price and energetic performance, but also that EPC ratings are not a strong value driver compared with other variables. In addition, they also confirm that energy upgrades can increase value, but point out that this does not go so far that the costs outweigh the increase in value. By contrast, Copiello and Donati (Citation2021) conclude that investing in building energy efficiency can be economically viable up to a certain extent, when comparing the marginal benefit of a retrofit with the marginal cost to save 1 kWh. Their analysis is based on housing price data for the town of Padua in Italy. Specifically, they point out that housing in the worst energy rating bands can be profitably, meaning that marginal benefit exceeds marginal costs, refurbished up to an energy performance index of about 50 kWh/m2a to 40 kWh/m2a, depending on whether or not tax incentives are provided. It is important to note that this finding is based on substantial premiums of up to 61.7% from the lowest to the best EPC rating bands.
Most of the aforementioned studies have focused primarily on purchase transactions and one cannot assume that the energy efficiency effects identified on the residential sales market can be simply applied to the rental market, as these markets differ both in the degree of formalization of disclosure of rights (e.g. involvement of real estate agents and notaries) and in the prevalence of compliance controls (Dressler & Cornago, Citation2017). However, the influence of EPC ratings has also been investigated, albeit to a lesser extent, in the context of rental apartments: Cajias and Piazolo (Citation2013) identify a green premium in the German rental market for the energy classes “B,” “C,” and “D” of 13.3% (which is on average €0.47/m2), 13.5% (€0.59/m2), and 16.3% (€0.74/m2) higher rent as the reference class, the lowest energy efficiency. Hyland et al. (Citation2013) find a significant lower premium for rental apartments than for property sales. Their research, for which they used rental advertisement data from Ireland, also suggests a significantly lower premium than that found by Cajias and Piazolo (Citation2013). For A-rated dwellings, Hyland et al. (Citation2013) find a gain of 1.8% green premium relative to otherwise similar D-rated dwellings. Dressler and Cornago (Citation2017) find, with data for rentals in the city of Brussels, that highly energy-efficient dwellings are associated with a 4.8% rent premium when compared with low-energy-efficient dwellings, which amounts to €50 per month for the average apartment in their dataset, which has 107 m2 of living space. In addition, they point out that disclosing energy-efficiency information for dwellings with intermediate energy-efficiency results in a discount, which they interpret as a strategic motivation not to disclose a dwelling’s energy performance when it is not in the top classes. Cajias et al. (Citation2019) with a big dataset of nearly 760 thousand observations across over 400 local markets in Germany, estimated that rents for A+, A, B, and C-rated rental apartments are on average 0.9%, 1.4%, 0.1%, and 0.2% higher than the reference category D, whereas dwellings in the categories below E, F, G, and H are subject to rent discounts of up to −0.5%. By analyzing different subsamples, Cajias et al. (Citation2019) also demonstrate that the Top 7 real estate markets show less sensitivity to energy-efficiency, while in secondary markets, the premium is enhanced by up to 1.4% points (for A+), while discounts are also increased by up to 1.8% points. In addition, the premiums for the A category increased over time from 0% in 2013 to 1.4% in 2017 and the brown discounts for G and H-rated apartments decreased over time. Furthermore, and in line with Fuerst et al. (Citation2020), evidence for a negative coherence of time on the market and energy-efficiency of rental units is provided. In a more recent published scientific work for Germany, some of the earlier findings were confirmed by Pommeranz and Steininger (Citation2021), who once more demonstrate that rents are lower for apartments with higher energy consumption on average. Furthermore, they suggest that in neighborhoods with higher green awareness and higher purchasing power, lower rents for energy-inefficient apartments are paid, while the effects of purchasing power are higher than for green awareness. Another recent study of Taruttis and Weber (Citation2022) suggests a significant but very small premium for energy efficient apartments by using data for the German state of North Rhine-Westphalia. They then compare the identified premium to the energy cost savings associated with the increased energy efficiency and find that the savings exceed the premium by a factor of six, reflecting an inefficient market in terms of the energy efficiency of buildings.
Overall, the majority of studies suggest that a green premium also exists in the rental market, but that the level of this premium differs according to various factors. This present paper is part of the existing debate and aims to broaden it by comparing the efficiency gains from a retrofit with the associated marginal costs and analyzing whether the monetary benefits justify the implementation of retrofit measures from the landlord’s perspective.
Data
Data on Asking Rents
The original dataset comprises more than two million observations of rental listings from the leading online platform in Germany for housing, ImmobilienScout24, for the time span 2016 to year 2020 and in cities with a population of more than 100,000. Data access was provided by the Research Data Centre Ruhr at the RWI – Leibniz-Institute for Economic Research (FDZ Ruhr). The dataset is identified at DOI: “10.7807/immo:red:hm:suf:v3.”
Since it is not transaction data or data from rent agreements, but from offerings on an online platform, the information was entered by the platform users. This means that it is subject to data entry bias. To deal with this issue, we cleared the data of implausible values such as zero or negative area, and of missing values that are required for the estimation such as energy demand per square meter. After data-clearing processes, we are left with 533,780 observations with full hedonic characteristics. The dataset contains information on unit characteristics which is needed for a Hedonic Pricing Model according to Sirmans et al. (Citation2005). Namely rent, apartment size, energy demand per square meter, number of rooms, quality and if the features Elevator, Balcony, Guest WC, Built-in Kitchen, Garden, and Cellar are applicable. The categorical variable for quality has the classifications simple, normal, sophisticated and luxury, which we include as binary variables as well as equipment features (see e.g. Cajias et al., Citation2019; Pommeranz & Steininger, Citation2021). We also add two socioeconomic variables to the dataset by including the number of households in a city and the average household income to control for unobserved market-specific heterogeneity (Cajias et al., Citation2019). The socioeconomic data were retrieved from GfK (http://www.gfk.com). depicts the descriptive statistics. In addition, depicts the corresponding Pearson correlation coefficients.
Table 1. Descriptive statistics.
Table 2. Pearson correlation matrix of variables.
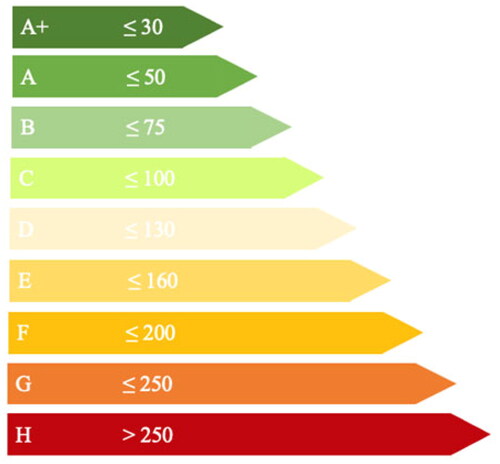
As indicated in , one indicator for an expected green premium is that energy consumption and rent per square meter have a negative correlation. To examine the relationship between energy demand and rental potential, the energy efficiency ratings, which are also called EPC bands or EPC classes, are used in addition to the absolute value per square meter. The EPC classes are not included in the data from the outset, but are calculated on the basis of the energy demand values according to German legislation. shows the EPC rating bands from H (the worst) to A+ (the best) like they are defined in the German Building Energy Act (GEG). For example, for a building to be assigned to energy efficiency class A, its annual energy demand in kilowatt-hours per square meter per year (kWh/m2a) has to be in the range between 31 and 50 kWh/m2a.
Figure 1. German energy efficiency classes of residential buildings according to German Building Energy Act. (Source: Own depiction).
Accordingly, we construct a binary variable for each EPC-rating band. The summary statistics and Pearson Correlation Coefficients for the EPC-variables generated in this way can be found in .
Table 3. Summary statistics and Pearson correlation coefficients for EPC classes.
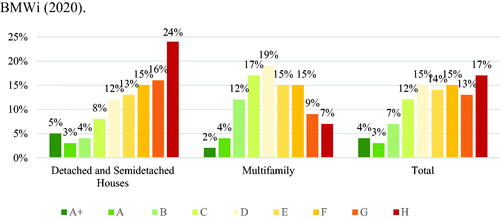
As can be seen from , most apartments are in EPC class D (24%), followed by E (18%) and C (16%) but only very small proportions of the buildings are assigned to the very upper and very lower rating bands. Although the shares of the classes A + and A are close to the share in the German building stock at 2% (A+) and 5% (A), the very lowest groups G and H are massively underrepresented. In the multi-family housing stock in Germany, their shares are around 7% (H) and 9% (G) as depicted in , while in the data sample, they comprise only 2% (H) or 5% (G). A possible reason for this low percentage of the lower rating bands in the data may be that owners who advertise these apartments for rent are aware that mediocre and low-energy efficiency potentially reduce the rentability or results in a price discount, and therefore do not include energy performance in the advertisement Dressler and Cornago (Citation2017).Footnote2
Figure 2. Frequency distribution of building efficiency classes according to the final energy demand in the German building stock (Source: Own depiction according to BMWi, Citation2020).
also indicates that rent and energy consumption show a negative correlation coefficient of −0.26, while the correlation coefficients of the different EPC classes and the rent per square meter have changing signs. For classes A + to C, the sign is positive and from class D downwards it is negative. The range of correlations is between 0.23 and −0.09. Surprisingly, the highest or lowest correlations are not at the extreme points of the energy-efficiency classes, i.e. at A + and H, but at B with 0.23 and at D with −0.09. Due to the correlations, one would expect the presence of a green premium in the classes A + to C.
Green Retrofit Data
The data used for this study regarding the cost of green retrofits and corresponding efficiency gains were collected by the General Association of the German Housing Industry (Bundesverband deutscher Wohnungs- und Immobilienunternehmen e. V.; GdW) from some housing companies and partners and kindly made available to us. The sample comprises exclusively multifamily buildings in Germany and includes observations on 1,048 residential units in 27 properties with a total of 64,519 m2 of living space before and after retrofit measures. The data contain a description of the measures carried out, the year of the retrofit, renovation costs, the energy demand before and after refurbishment, and the energy consumption before and after refurbishment, whereas energy demand and consumption are included in relation to the living space. The term energy demand refers the amount of energy per square meter that is required to provide heat to the unit. It is calculated based on normative standard conditions which are defined in the GEG. The energy consumption, on the other hand, is based on values measured over a 3-year period, before and after each retrofit, and in the dataset are only adjusted for temperature differences. Since the EPC classes according to the GEG do not refer to the living space but to the usable space, the energy consumption and demand must be converted to this. Here, we apply the simplified conversion according to GEG § 82 para. 2, which for this purpose specifies a conversion factor of 1.2 for multi-family houses. In addition, because the year in which the retrofit measures were carried out varies, we extrapolate the retrofit to 2018, using the construction cost index for Germany provided by the German statistical office (Destatis, Citation2022a). We choose 2018, as this is the average year of the green premium data with which the retrofit costs are compared later. shows descriptive statistics of the data sample.
Table 4. Descriptive statistics for green retrofit data.
shows the Pearson correlation coefficients for the retrofit data. It can be noted here that the cost of retrofit per square meter correlates negatively with both the number of housing units and the total usable space in the building, implying that the average cost of retrofit decreases with the size of the building and that economies of scale may be achieved accordingly. However, the positive correlation coefficients of the costs with the initial state before renovation in kWh/m2a and the additional state afterwards are particularly noteworthy. This already indicates rising marginal costs of retrofitting with increasing energetic performance.
Table 5. Pearson correlation coefficients for green retrofit data.
Methods
Hedonic Pricing and Generalized Additive Model
The econometric approach to examining whether higher or lower energy consumption in rental multifamily housing is associated with a significant price premium involves two steps. Our first step is to estimate a hedonic pricing model (HPM), as empirically justified by Sirmans et al. (Citation2005), which is the standard methodology for examining value determinants in housing. The baseline model is specified as follows:
(1)
(1)
With apartment unit factors (i), energy consumption [EC] proxies (j), socioeco- nomicindicators (k), binary locational variables[L] on ZIP code level(l) and binary time dummy controls [K] by listing year (t):
(2)
(2)
In doing so, we apply the ordinary least squares estimation method on the fully linear form and thus use the log of price per square meter as the response variable, and the log of energy consumption per square meter as the energy proxy. Some studies argue that the standard HPM approach overestimates the influence of energy consumption and that using different alternatives such as including spatial dependencies (e.g. Bisello et al., Citation2020; Conway et al., Citation2010; Copiello & Donati, Citation2021) or applying nonlinear estimation techniques like Generalized Additive Models (GAM) (Cajias, Citation2018; Cajias & Ertl, Citation2018) produces better results than the standard approach. Spatial Models could not be applied to our data, as the dataset was cleared from addresses or granular location information by the provider for privacy reasons. Accordingly, in a second step to apply a GAM approach, we use partial residual plots on our HPM estimates to identify possible nonlinear relationships between predictor and response variables (Brunauer et al., Citation2010). A visual inspection reveals that all non-categorical covariates suggest nonlinear modeling to some degree. Consequently, these are modeled non-linearly within an additive mixed approach with mixed covariates of parametric estimates and nonlinear functions. We estimated four different model specifications of which two are solely linear. Two more are mixed linear and nonlinear covariates, whereas non-linearity is accounted for by modeling the nonlinear covariates with penalized splines. For each HPM and by means of the GAM approach, a further model is estimated in which the energy consumption is represented by the EPC rating bands. Since we are interested in the rent difference of the better classes compared with the worst performing buildings, we set the classes G and H as the reference category. Due to the negative correlation between energy consumption and price per square meter, this approach leads to the expectation that the regression coefficients of the binary variables for the classes A + to F have a positive sign, and that an increase in the strength of the effect can be observed with increasing energy efficiency.
Marginal Benefit and Marginal Cost Curves
Following Copiello and Donati (Citation2021), MB for energetic improvements in buildings can be calculated as follows:
(3)
(3)
where ΔTB is the change in total benefit (TB), and hence, the price premium due to an increase in energy efficiency after a green retrofit. And ΔEpi is the change in the energy performance index Epi which is measured in kWh/m2a. To apply this calculation procedure to the coefficients resulting from the estimation of the HPM for each energy efficiency class and then estimate a marginal benefit curve (MBC), we use the average savings between two classes resulting from the data set, and the associated rent premium at the point of means for the reference category (EPC G & H).
Analogous to the calculation of the MB, the marginal costs can be calculated as the quotient of total costs (ΔTC) per square meter to undertake the green retrofit measures and the resulting change in the energy performance index (ΔEpi):
(4)
(4)
To derive the appropriate slope of the marginal cost curve, we relate the MC determined for each observation i to the respective intervention level which is defined as average of energy performance index before (
) and energy performance index after (
) retrofit:
(5)
(5)
To make the curve determined, that is shifted towards a lower degree of energy efficiency comparable with the MBC, it has to be shifted back toward a higher level of energy efficiency by factor S. S being defined as:
(6)
(6)
The two curves derived in this way can be used to graphically analyze the extent to which the implementation of the measures pays off economically. The intersection of the MBC and MCC (if one is observed) indicates the optimal level of energy reduction.
Results and Implications
The econometric analysis consists of three parts. We first estimate the price impact of energy efficiency ratings and then proceed to translate the results into the MBC. We then use the methodology described above to determine the MBC, which we subsequently compare with the MCC to assess the profitability of retrofit measures. As a final subsection, we address caveats with regard to interpreting the results.
Hedonic Pricing Model Regression Results
shows the regression results for energy-related variables. Full regression results with coefficients for all included covariates can be found in the appendix in Table A1. Model (1) is the standard linear model with the numeric energy index parameter log(energy/m2) as exogenic variable, model (2) is the otherwise similar OLS model but with energy efficiency bands as exogenic variables, while model (3) is the counterpart to (1), but estimated in a GAM framework and likewise model (4) showing the corresponding GAM model estimates to model (2) with EPC rating bands. Spatial fixed effects on ZIP Code level and year time dummies have been included in all model estimations.
Table 6. Regression results for energy-related exogenic variables on log rent €/m2.
For all estimates, a significant influence of the energy quality of the buildings on the rent was found, confirming the results of previous studies. As expected, the positive impact of really high energy quality is much greater than for slightly better apartments according to the results of the linear regression. Surprisingly, the signs of the small but significant coefficients for EPC classes D, E and F in model (2) are negative. However, this result in the linear regression appears plausible when the correlation coefficients of the EPC classes with the rent per square meter from are included, because the negative correlation for the classes G and H is weaker than for E, F, and G. This relationship, which is difficult to explain economically, is not found in the analogous GAM model (4), which suggests that the non-linear inclusion of several variables has improved the model estimation. This is also supported by the higher adjusted R2. From the estimated coefficients of binary variables in a semi-logarithmic regression, the percentage effect is calculated by applying the formula 100× as stated explicitly for hedonic pricing models by Halvorsen and Palmquist (Citation1980). Accordingly, in model (4), which is the basis for the following analysis, the highest green premium for energy efficiency class A + is 3.98%, compared with the reference category. The following categories A, B, C, show a green premium of 2.43%, 2.12% and 0.80%, while for D, E and F, only very small differences of 0.3%, 0.1% and 0.2% were identified in comparison with worst performing classes G and H.
Derivation of Marginal Benefit Curve and Marginal Cost Curve
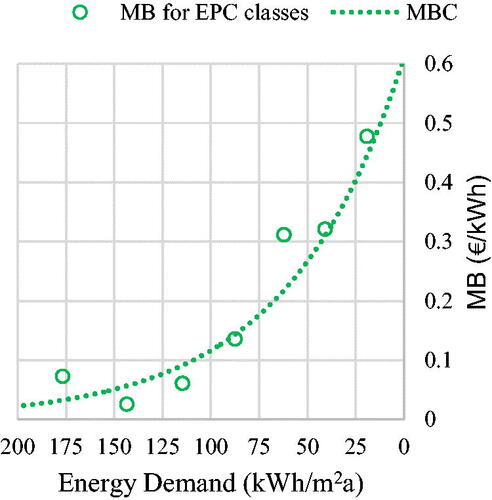
To derive the marginal benefit of avoiding another unit of energy per square meter from the previously identified green premium, we proceed with the average square meter rent within the reference category, which is at €9.09/m2. This is increased by the respective percentage of the green premium for the higher energy classes. The resulting increases in future cash flows are discounted to a net present value (NPV) using a yearly discount rate of 3% and assuming a 50-year useful life for the facility components. The discount rate reflects the investor’s capital return requirement and would, in practice, vary according to the location or risk profile of the property. The assumption regarding the useful life of the building is based on the legal requirements of German tax law, which provides for straight-line depreciation at 2% per year, corresponding to a period of 50 years until the building is fully depreciated. This NPV is finally divided by the absolute change in the energy performance index from each EPC class to the reference category, as stated in Equationequation (3)(3)
(3) . This procedure yields the plot which is presented in reversal scale in . The step-by-step calculation can be derived from Table A2 in the appendix.
Figure 3. Derivation of the marginal benefit curve. (Source: Own depiction).
Following the procedure outlined in Section “Marginal Benefit and Marginal Cost Curves” and defined by Equations (4) and Equation(5)(5)
(5) , the marginal costs of energy demand adjustment are plotted against the intervention level (IL), as depicted by the blue circles in , where contains the values for the energy demand and contains the values for the actual consumption. The result suggests increasing marginal costs for retrofits on higher levels of energy efficiency for both cases, which has also been observed in earlier studies on energetic retrofits for different measures and materials (Gustavsson & Piccardo, Citation2022; Timmons et al., Citation2016). To adjust the MCC (IL) that was plotted on the intervention level to the target level to obtain the final MCC, it is shifted to the right by S (=83.46 kWh/m2a for forecasted energy demand and =40.94 kWh/m2a for actual measured consumption).
Figure 4. Derivation of the marginal cost curve for energy demand (a) and energy consumption (b). (Source: Own depiction).
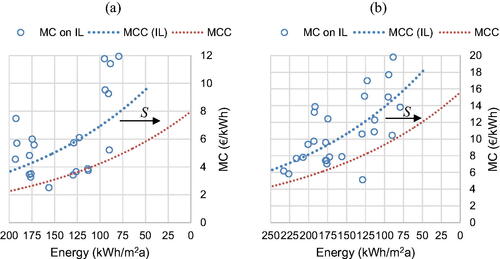
The comparison of the value range of the MBC and MCC already clearly shows that the costs exceed the expected benefits by far for both demand and consumption. Since the actual measured savings are on average far below the forecasted levels, the marginal costs related to consumption are at a higher level. In the following section, the analysis of the generated curves will be continued and extended by different approaches. We focus here on energy demand. Knowledge of a possible discrepancy between forecasted and realized saving should be considered in investment decisions, but since data on the actual consumption are not available up front, and are therefore not part of an investor’s decision-making.
Synthesis and Economic Evaluation of the CO2 Tax
The joint depiction of MBC and MCC in one plot yields the conclusion that the MB from possible rent increases is not sufficient to offset the retrofit costs from the owner’s point of view. The MBC runs under the MCC and does not intersect it. At this point, it should be noted that the preceding cost analysis is based on the full costs of the renovation measures, because only for 12 observations in the data set the costs eligible for subsidies for energy-efficient buildings (“förderfähige Kosten”) are known. These costs are defined as costs for measures that explicitly increase the energetic quality of a building. For these 12 observations, the average share of energy-related costs is at 45% of full costs. Even assuming this percentage for all retrofits in the dataset and shifting the MCC downward by 55%, the observation of the irretrievability of the measures from the owner perspective does not change. Also, the assumption-based Marginal Cost Curve for energy-related costs (MCCer; grey dotted line in ) does not intersect the MBC (green dotted line at bottom of ).
Figure 5. Marginal cost curves, marginal benefit curve and energy cost saving. (Source: Own depiction).
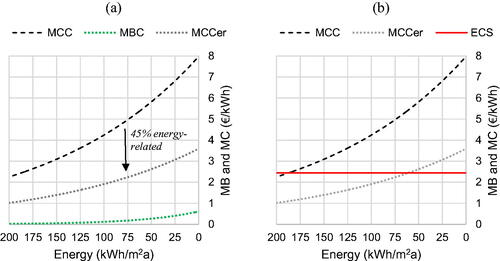
The observation that energy-efficient refurbishment does not pay off in monetary terms applies in particular to rented housing, because of the split incentive problem. This is illustrated with a calculation example: To approximate the NPV of the reduction in energy consumption by one kWh/a, we assume the natural gas price per kWh of the year 2020 of 6.2 Cent/kWh (Destatis, Citation2022b), before the CO2 tax on fuels was introduced in Germany. Based on that we calculate the total cost benefit over a 50-year useful life, applying the discount rate mentioned above and an energy cost progression of 2% which reflects the average annual increase for the years 2005 to 2020 (Destatis, Citation2022b). We assume the price and price progression for natural gas, because in the private household sector, natural gas is the most important energy source on the heating market, with a current share of around 44% (BMWK, 2022). This results in an NPV of €2.44 in terms of energy cost saving for 1 kWh/m2. The corresponding line (ECS) intersects the MCC at an energy performance of about 185 kWh/m2a, meaning that a retrofit would be expected to be economically advantageous up to this point (). This consideration assumes that owner-occupiers can retrofit at the same cost per square meter as the real estate companies that provided the data for the analysis. However, this might in many instances not be the case, as these companies are able to benefit from economies of scale and bargaining power. The intersection with the MCCer, however, is reached at a much higher energetic level at about 60 kWh/m2a, due to the lower marginal costs. The example does not claim to provide an exact estimation regarding the de facto profitability of retrofit measures in practice, as it is based on averaged data and various assumptions. Nevertheless, the insight is quite clear that undertaking modernization efforts to increase building energy efficiency is much more attractive, due to the inclusion of energy cost savings in the owner-occupied sector.
With the potential to solve the landlord-tenant dilemma to some extent, a proposal of splitting the CO2 tax between tenant and landlord was included as a declaration of intent in the coalition agreement of the newly voted-in German federal government in 2021 (SPD et al., Citation2021). The agreement states that a percentage allocation of the tax will be implemented, that will depend on the EPC class of a building. If this law has not been passed by June 1, 2022, the distribution will be made on a parity basis and regardless of the energy performance. Below, we analyse these two cases and again calculate a marginal benefit for saving 1 kWh of energy, but with inclusion of the carbon tax. One challenge hereby is that the CO2 price, which is regulated in the BEHG (“Brennstoffemissionshandelsgesetz”), is only defined until 2026. In 2021, it was introduced at €25 per metric ton (t) of CO2 and will gradually increase to €30 (2022), €35 (2023), €45 (2024), €55 (2025) and a range from €55 to €65/tCO2 in 2026. Subsequently, free pricing is to be established on the market, unless it is decided in 2025 that defined price corridors will be continued. The German Federal Ministry for the Environment, Nature Conservation and Nuclear Safety (BMU) uses values from the BMU-funded project “Politik-Szenarien IX” (“Policy Scenarios IX”) in its current model calculations (Repenning et al., Citation2021). The “Policy Scenarios IX” project assumes a CO2 price of €65/tCO2 in 2026 and an annual increase of €15/t to €125/t in 2030, €200/t in 2035 and up to €275/t in 2040. We adopt this assumption and add the expectation that the price will not increase further from 2045, when Germany is expected to have already achieved net carbon neutrality. To calculate this tax on a kWh of energy, we include the CO2 emission factor for natural gas of 0.20431 kg/kWh (Department for Business & Energy & Industrial Strategy, Citation2022). This conversion results in a kWh of natural gas being taxed, for example, with 0.73 Cents in 2022, with 3.0 Cents in 2030 or with 8.5 Cents in 2045 and after. The sum of the tax savings thus achieved for 1 kWh over a 50-year period results in an NPV of €1.10/kWh. In the case of parity distribution of the tax, simply 50% of the calculated NPV, i.e. 55 Cent, are added to the MB for each EPC class, which shifts it upwards. In April 2022, the parties comprising the German government agreed on how the gradual allocation of the CO2 tax for residential buildings should be structured. A 10-stage model is proposed, which provides that a poor energy performance of the unit or building leads to a higher cost burden for the landlord. This is based on the energy consumption converted into CO2 emissions, not purely on the classes of the energy certificate. The CO2 costs to be borne by the parties per residential unit are determined via the heating cost statement. For apartments with a particularly poor energy balance (52 kg CO2/m2a), landlords bear 90% and tenants 10% of the CO2 costs. However, if the building meets the very efficient standard, landlords do not have to bear CO2 costs at all. To apply this information to our calculation methodology, we use the just introduced CO2 emissions factor and multiply it with the average energy demand of each EPC class in our data (see ).
Table 7. Distribution of the CO2-tax burden by EPC classes on tenant and landlord.
Based on the input parameters just presented, the modified MBCs for the two different cases of imposing the carbon tax on the landlord are derived. These are shown in . The course of the MBC is increased significantly in both cases. However, the taxation is still insufficient to raise the marginal benefit of saving 1 kWh in the rental sector to such an extent that it offsets the cost of the renovation for any level of energy efficiency. Both MBCs that include CO2 taxation also run strictly below the MCCer.
Figure 6. Marginal cost curves, marginal benefit curve and energy cost saving. (Source: Own depiction).
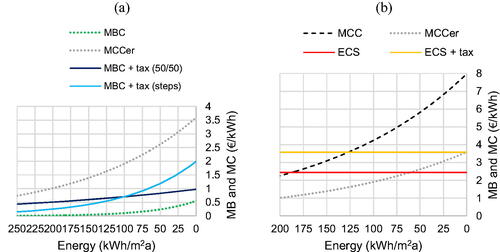
In the owner-occupied sector, on the other hand, the tax would be fully added to the energy cost savings and thus further increase the economically reasonable depth of renovation (). In general, it is highly questionable whether both investors and private users would apply such assumptions in their decision making. The fact that the tax is only defined until 2026 and, as a consequence it is unclear how high it will be in subsequent years, creates planning uncertainty which limits the incentive effect of the carbon tax.
Limitations and Possible Model Extension
Some limitations to the analysis, which mainly concern the data used, should be considered when interpreting the results. For the analysis of the green premium in the rental market, it is important to note that the rent data reflect asking prices which implies that there is no guarantee that a contract was actually concluded at this price. Nevertheless, as practice shows, leases in the residential sector are rarely negotiated and mostly conclude at the asking rent. Moreover, the data only extend to 2020. Accordingly, both the CO2 tax and the recent tremendous price increases in the energy market in Germany of up to 30% (Destatis, Citation2022d) that might induce adjustments on the demand side, i.e. tenants being more sensitive to the energetic performance, are not reflected in this data.
Regarding the cost side of the analysis, due to the lack of information in the available data, it was only possible to make a rough approximation of the actual energy-related costs of renovation. It is important to note that with massively increasing renovation rates, which are a necessary requirement for reaching both the EUs’ and Germany’s climate targets, the typical occasion for energy-related renovation cannot always be “normal” maintenance, but rather intervention in the building substance outside of the usual maintenance cycles, in order to specifically implement the necessary measures for climate protection. For this reason, the application of energy related cost components alone in economic profitability studies can be criticized. A further limitation is that public subsidies from the federal programs for energy-efficient building renovation could not be considered, as they are not part of the provided data either. The observation of financially unviable retrofits from the landlord’s point of view demonstrates that there is a substantial need for providing subsidies.
Another drawback is related to the potential bias that can result from omitting unobserved housing characteristics that correlate with measures of energy efficiency. The presence of such determinants can produce either a downward or an upward bias, which depends on the direction of the correlation between unobserved factors and prices, and between the unobserved factors and energy efficiency levels (Aydin et al., Citation2020).
Finally, the analysis was based on used energy per square meter, although the actual target value of the goals does not refer to this, but to CO2 or CO2-equivalent emissions. Although an approximation of the influence of CO2 taxation could be achieved by means of a conversion using the emission factor for natural gas, the quantitative analysis would gain in substance if it could be based on actual CO2 emissions per square meter. The current federal government has already expressed its intention to digitize the EPC and focus increasingly on CO2, from which further research could benefit. But more importantly these steps would enable a more targeted implementation of retrofit measures in the future.
Conclusion
This study empirically investigated whether a green premium is paid for energy efficiency in the German rental market. The results show that this is indeed the case for the very high-performance EPC classes, while there is only a very small, almost negligible premium for mediocre- and lower-performance classes. In addition, a marginal cost curve for the abatement of an additional kilowatt-hour of final energy was derived from a dataset of green-retrofits of multi-family homes in Germany.
A comparison of the marginal cost with the marginal benefit derived from the identified green premium shows that the monetary advantage resulting from possible rent increases is far from sufficient to compensate for the costs of retrofit measures (if there are no public subsidies). Although the finding of a green premium implies that the landlord-tenant dilemma is not absolute, but that landlords can also benefit to some extent from efficiency gains in relation to rent, a comparison shows that the net present value from energy cost savings is many times larger than that of additional rent. An inclusion of the planned split of the CO2 tax between both landlord and tenant in the analysis has shown that at the time of the study, this split is on average not capable of providing a sufficient incentive for the landlord to carry out green retrofits. The price per ton of CO2 appears to be too low for this purpose. Regarding this finding, it is important to note that the tax payments to be made in the future were discounted to 2021. The incentive effect of the tax therefore increases in influence, as the price rises over time. However, this is also partly countered by rising construction costs.Footnote3 It is likely that when higher renovation rates are achieved, costs will also increase further, due to increased demand for construction services during the next decade.
The findings do not imply that the taxation completely fails to achieve its purpose, but they suggest that this form of taxation is not sufficient in the short term, to bring about a substantial increase in the renovation rate and that further measures are therefore necessary. An excessive increase in the tax to correct this and to increase the renovation rate in the short term is not an advisable measure, because this would drive up the housing costs of all households including those of owner-occupiers for which the incentive is already stronger than for owners of rental stock. However, from today’s point of view, the inclusion of the tax in calculations is associated with considerable planning uncertainty, as the price per ton is only defined until 2026. It should in fact be specified until 2030 and even beyond to take full advantage of realizable potentials that could be activated by CO2 taxation. To increase the renovation rate in the short term and to focus on the worst performing buildings where the greatest efficiency gains are achievable, binding minimum standards as already proposed in the last update of the Energy Performance of Buildings Directive (EPBD) appears to be a good alternative.
Limitations with regard to the interpretability and practical applicability of the results of the present study arise from the data basis. On the one hand, a higher quality of input data regarding the retrofits performed would be desirable, but is not available. On the other hand, the regulatory framework for the future, especially with regard to CO2 taxation, is partly unclear. Therefore, in the context of future research, particular emphasis must be placed on accurate data collection. In addition, policy-makers also have a responsibility in this area to ensure uniform standards in the area of standardization, digitization and accessibility of data relating to the energy performance of buildings. This is an important part of decarbonizing the building sector.
Furthermore, in the context of sharply increasing energy prices, it is essential to re-evaluate the behavior of tenants in the near future. Due to a possible short-term decline in demand for apartments with poor EPC ratings, the green premium is likely to increase as the benefits of low energy consumption and the awareness amongst the tenants grows. If data availability on both sides (housing costs and retrofits costs) allows for it, future research should further investigate the incentive effects for building retrofits.
The study results, even if imperfect and subject to limitations, appear to be valuable for both tenants and investors in their decision-making, as well as for policy makers in the implementation of decarbonization efforts in the residential real estate sector.
Disclosure statement
No potential conflict of interest was reported by the author(s).
Notes
1 Note that EPC classes are not defined in the same way in all jurisdictions, but differ both in terms of their number and the respective range of values. For example, the EU defines classes A to G while Germany is using a differentiation of A + to H.
2 According to German law, an apartment may be advertised with the inclusion of the EPC whereas it is mandatory to present the EPC to the prospective tenant at the latest at the time of the apartment tour.
3 From 2020-Q4 to 2021-Q4, construction costs for the maintenance of residential properties rose by over 14% (Destatis, Citation2022c).
References
- Addae-Dapaah, K., & Wilkinson, J. (2020). Green premium: What is the implied prognosis for sustainability? Journal of Sustainable Real Estate, 12(1), 16–33. https://doi.org/10.1080/19498276.2021.1915663
- Andrews, D., & Caldera-Sánchez, A. (2011). The evolution of homeownership rates in selected OECD countries: Demographic and public policy influences. OECD Journal: Economic Studies, 2011(1), 207–243. http://dx.doi.org/10.1787/eco_studies-2011-5kg0vswqpmg2
- Aydin, E., Brounen, D., & Kok, N. (2020). The capitalization of energy efficiency: Evidence from the housing market. Journal of Urban Economics, 117, 103243. https://doi.org/10.1016/j.jue.2020.103243
- Bisello, A., Antoniucci, V., & Marella, G. (2020). Measuring the price premium of energy efficiency: A two-step analysis in the Italian housing market. Energy and Buildings, 208, 109670. https://doi.org/10.1016/j.enbuild.2019.109670
- BMWi – Bundesministerium für Wirtschaft und Energie (2020). Langfristige Renovierungsstrategie der Bundesregierung. https://www.bmwi.de/Redaktion/DE/Publikationen/Energie/langfristige-renovierungsstrategie-der-bundesregierung.pdf?__blob=publicationFile&v=6
- BMWK Bundesministerium für Wirtschaft und Klimaschutz (2022). Erdgasversorgung in Deutschland. https://www.bmwi.de/Redaktion/DE/Artikel/Energie/gas-erdgasversorgung-in-deutschland.html#:∼:text=Im%20Sektor%20der%20privaten%20Haushalte,diesem%20Bereich%20zur%20W%C3%A4rmeversorgung%20eingesetzt
- Brounen, D., & Kok, N. (2011). On the economics of energy labels in the housing market. Journal of Environmental Economics and Management, 62(2), 166–179. https://doi.org/10.1016/j.jeem.2010.11.006
- Brunauer, W. A., Lang, S., Wechselberger, P., & Bienert, S. (2010). Additive hedonic regression models with spatial scaling factors: An application for rents in Vienna. The Journal of Real Estate Finance and Economics, 41(4), 390–411. https://doi.org/10.1007/s11146-009-9177-z
- Cadena, A., & Thomson, T. A. (2021). The value of “Green” in resale residential real estate: Premium by neighborhood value quintile, homestead status and year. Journal of Sustainable Real Estate, 13(1), 12–29. https://doi.org/10.1080/19498276.2021.2010388
- Cajias, M. (2018). Is there room for another hedonic model? The advantages of the GAMLSS approach in real estate research. Journal of European Real Estate Research, 11(2), 204–245. https://doi.org/10.1108/JERER-07-2017-0025
- Cajias, M., & Ertl, S. (2018). Spatial effects and non-linearity in hedonic modeling: Will large data sets change our assumptions? Journal of Property Investment & Finance, 36(1), 32–49. https://doi.org/10.1108/JPIF-10-2016-0080
- Cajias, M., & Piazolo, D. (2013). Green performs better: Energy efficiency and financial return of buildings. Journal of Corporate Real Estate, 15(1), 53–72. https://doi.org/10.1108/JCRE-12-2012-0031
- Cajias, M., Fuerst, F., & Bienert, S. (2019). Tearing down the information barrier: The price impacts of energy efficiency ratings for buildings in the German rental market. Energy Research & Social Science, 47, 177–191. https://doi.org/10.1016/j.erss.2018.08.014
- Cerin, P., Hassel, L. G., & Semenova, N. (2014). Energy performance and housing prices. Sustainable Development, 22(6), 404–419. https://doi.org/10.1002/sd.1566
- Cespedes-Lopez, M. F., Mora-Garcia, R. T., Perez-Sanchez, V. R., & Perez-Sanchez, J. C. (2019). Meta-analysis of price premiums in housing with energy performance certificates (EPC). Sustainability, 11(22), 6303. https://doi.org/10.3390/su11226303
- Conway, D., Li, C. Q., Wolch, J., et al. (2010). A spatial autocorrelation approach for examining the effects of urban greenspace on residential property values. The Journal of Real Estate Finance and Economics, 41, 150–169. https://doi.org/10.1007/s11146-008-9159-6
- Copiello, S., & Donati, E. (2021). Is investing in energy efficiency worth it? Evidence for substantial price premiums but limited profitability in the housing sector. Energy and Buildings, 251, 111371. https://doi.org/10.1016/j.enbuild.2021.111371
- Dell’Anna, F., Bravi, M., Marmolejo-Duarte, C., Bottero, M. C., & Chen, A. (2019). EPC green premium in two different European climate zones: A comparative study between Barcelona and Turin. Sustainability, 11(20), 5605. https://doi.org/10.3390/su11205605
- Department for Business, Energy & Industrial Strategy (2022). Government conversion factors for company reporting of greenhouse gas emissions. https://www.gov.uk/government/collections/government-conversion-factors-for-company-reporting
- Destatis (2022a). Bau- und Immobilienpreisindex. https://www.destatis.de/DE/Themen/Wirtschaft/Preise/Baupreise-Immobilienpreisindex/_inhalt.html
- Destatis. (2022b). Preise Daten zur Energiepreisentwicklung. https://www.destatis.de/DE/Themen/Wirtschaft/Preise/Publikationen/Energiepreise/energiepreisentwicklung-pdf-5619001.pdf?__blob=publicationFile
- Destatis (2022c). Preisindizes für Bauwerke, Ingenieurbau, Instandhaltung. https://www.destatis.de/DE/Themen/Wirtschaft/Konjunkturindikatoren/Preise/bpr210.html;jsessionid=000018CB38453C1BA1B7DB47E2543DBF.live732
- Destatis (2022d). Daten zur Energiepreisentwicklung - Lange Reihen bis Januar 2022. https://www.destatis.de/DE/Themen/Wirtschaft/Preise/Publikationen/Energiepreise/energiepreisentwicklung-pdf-5619001.html
- Dressler, L., & Cornago, E. (2017). The rent impact of disclosing energy performance certificates: Energy efficiency and information effects. ECARES Working Paper, 2017–16. Universite Libre de Bruxelles.
- European Commission (2019). Energy performance of buildings directive (Brussels). https://ec.europa.eu/energy/topics/energy-efficiency/energy-efficient-buildings/energy-performance-buildings-directive_en
- European Commission (2020). Communication from the commission to the European Parliament, the council, the european economic and social committee and the committee of th regions A Renovation Wave for Europe – greening our buildings, creating jobs, improving lives (Brussels). https://eur-lex.europa.eu/resource.html?uri=cellar:0638aa1d-0f02-11eb-bc07-01aa75ed71a1.0002.02/DOC_1&format=PDF
- European Commission (2021). Proposal for a Directive of the European Parliament and of the council on the energy performance of buildings (recast) (Brussels). https://ec.europa.eu/energy/sites/default/files/proposal-recast-energy-performance-buildings-directive.pdf
- Eurostat (2019). House or flat – owning or renting, more than two thirds of the EU population own their home. https://ec.europa.eu/eurostat/cache/digpub/housing/bloc-1a.html
- Fuerst, F., & McAllister, P. (2011). Green noise or green value? Measuring the effects of environmental certification on office values. Real Estate Economics, 39(1), 45–69. https://doi.org/10.1111/j.1540-6229.2010.00286.x
- Fuerst, F., Haddad, M. F. C., & Adan, H. (2020). Is there an economic case for energy efficient dwellings in the UK private rental market? Journal of Cleaner Production, 245(3), 118642. https://doi.org/10.1016/j.jclepro.2019.118642
- Fuerst, F., McAllister, P., Nanda, A., & Wyatt, P. (2016). Energy performance ratings and house prices in Wales: An empirical study. Energy Policy, 92, 20–33. https://doi.org/10.1016/j.enpol.2016.01.024
- Gilmer, R. W. (1989). Energy labels and economic search. Energy Economics, 11(3), 213–218. https://doi.org/10.1016/0140-9883(89)90026-1
- Gustavsson, L., & Piccardo, C. (2022). Cost optimized building energy retrofit measures and primary energy savings under different retrofitting materials. Energies, 15(3), 1009. https://doi.org/10.3390/en15031009
- Halvorsen, R., & Palmquist, R. (1980). The interpretation of dummy variables in semilogarithmic equations. American Economic Review, 70(3), 474–475.
- Hirsch, J., Spanner, M., & Bienert, S. (2019). The carbon risk real estate monitor—developing a framework for science-based decarbonizing and reducing stranding risks within the commercial real estate sector. Journal of Sustainable Real Estate, 11(1), 174–190. https://doi.org/10.22300/1949-8276.11.1.174
- Hyland, M., Lyons, R. C., & Lyons, S. (2013). The value of domestic building energy efficiency - Evidence from Ireland. Energy Economics, 40/C, 943–952.
- Johnson, R. C., & Kaserman, D. L. (1983). Housing market capitalization of energy-saving durable good investments. Economic Inquiry, 21(3), 374–386. https://doi.org/10.1111/j.1465-7295.1983.tb00639.x
- Kholodilin, K. A., Mense, A., & Michelsen, C. (2017). The market value of energy efficiency in buildings and the mode of tenure. Urban Studies, 54(14), 3218–3238.
- Kok, N., Miller, N., & Morris, P. (2012). The economics of green retrofits. Journal of Sustainable Real Estate, 4(1), 4–22. https://doi.org/10.1080/10835547.2012.12091838
- Masson-Delmotte, V., Zhai, P., Pirani, A., Connors, S. L., Péan, C., Berger, S., Caud, N., Chen, Y., Goldfarb, L., Gomis, M. I., Huang, M., Leitzell, K., Lonnoy, E., Matthews, J. B. R., Maycock, T. K., Waterfield, T., & Yelekçi, O. (2021). Summary for policymakers. In R. Yu & B. Zhou (Eds.), Climate change 2021: The physical science basis. Contribution of working group I to the sixth assessment report of the intergovernmental panel on climate change. Cambridge University Press.
- Pommeranz, C., & Steininger, B. I. (2021). What drives the premium for energy-efficient apartments–green awareness or purchasing power? The Journal of Real Estate Finance and Economics, 62(2), 220–241. https://doi.org/10.1007/s11146-020-09755-8
- Repenning, J., Harthan, R.O, R., Blanck, R., Böttcher, H., Braungardt, S., Bürger, V., Emele, L., Görz, W. K., Hennenberg, K., Jörß, W., … & Laggner, S. A. (2021). Projektionsbericht 2021 für Deutschland. https://www.isi.fraunhofer.de/content/dam/isi/dokumente/ccx/2021/projektionsbericht_2021_bf.pdf
- Robinson, S., & McAllister, P. (2015). Heterogeneous price premiums in sustainable real estate? An investigation of the relation between value and price premiums. Journal of Sustainable Real Estate, 7(1), 1–20. https://doi.org/10.1080/10835547.2015.12091868
- Schleich, J., & Gruber, E. (2008). Beyond case studies: Barriers to energy efficiency in commerce and the services sector. Energy Economics, 30(2), 449–464. https://doi.org/10.1016/j.eneco.2006.08.004
- Simons, R., Robinson, S., & Lee, E. (2014). Green office buildings: A qualitative exploration of green office building attributes. Journal of Sustainable Real Estate, 6(1), 211–232. https://doi.org/10.1080/10835547.2014.12091866
- Sirmans, S. G., MacPherson, D. A., & Zietz, E. N. (2005). The composition of hedonic pricing models. Journal of Real Estate Literature, 13(1), 1–44. https://doi.org/10.1080/10835547.2005.12090154
- SPD, BÜNDNIS90/Die Grünen, & FDP (2021). Sozialdemokratische Partei Deutschlands, Bündnis 90/Die Grünen and Freie Demokratische Partei 2021. „Mehr Fortschritt wagen“ - Koalitionsvertrag zwischen SPD, Bündnis 90/Die Grünen und FDP.
- Taltavull de La Paz, P., Perez-Sanchez, V., Mora-Garcia, R.-T., & Perez-Sanchez, J.-C. (2019). Green premium evidence from climatic areas: A case in Southern Europe, Alicante. Sustainability, 11, 686. https://doi.org/10.3390/su11030686
- Timmons, D., Konstantinidis, C., Shapiro, A. M., & Wilson, A. (2016). Decarbonizing residential building energy: A cost-effective approach. Energy Policy, 92, 382–392. https://doi.org/10.1016/j.enpol.2016.02.030
- Taruttis, L., & Weber, C. (2022). Inefficient markets for energy efficiency-empirical evidence from the German Rental Housing Market. EWL Working Papers 2202, University of Duisburg-Essen, Chair for Management Science and Energy Economics, revised Feb 2022 http://dx.doi.org/10.2139/ssrn.4047715
- UNFCCC (2015). Paris agreement. https://unfccc.int/sites/default/files/english_paris_agreement.pdf
- United Nations Environment Programme (2021). 2021 Global status report for buildings and construction: Towards a zero-emission, efficient and resilient buildings and construction sector. United Nations Environment Programme.
- Wiley, J. A., Benefield, J. D., & Johnson, K. H. (2010). Green design and the market for commercial office space. The Journal of Real Estate Finance and Economics, 41(2), 228–243. https://doi.org/10.1007/s11146-008-9142-2
- Wilkinson, S. J., & Sayce, S. (2020). Decarbonising real estate: The evolving relationship between energy efficiency and housing in Europe. Journal of European Real Estate Research, 13(3), 387–408. https://doi.org/10.1108/JERER-11-2019-0045
- Yoshida, J., & Sugiura, A. (2010). Which “greenness” is valued? Evidence from green condominiums in Tokyo. MPRA.
Appendix
Table A1. Full regression results for response variable: log rent €/m2.
Table A2. Calculation of marginal benefit for each EPC class.