
ABSTRACT
This study proposes a method for mitigating the flow-induced vibration of a radial sluice gate to ensure operational safety and long-term stability. To this end, a supplementary plate was attached to the lower rear surface of the gate and its effect on vibration reduction is investigated using a fluid–structure interaction (FSI) analysis. Specifically, a three-dimensional finite-element method (FEM) model of the gate partially submerged in water was constructed and then validated by comparing the numerical responses of the gate with experimental results under the conditions of steady-state discharge. The FSI analysis showed that the vertical vibration acceleration of the gate diminished by 70% after the supplementary plate was attached, thereby reducing the swirling strength calculated from the vortex shedding behind the gate. The Strouhal number describing the intensity of the gate vibration in the flowing fluid was also reduced by 57% after the supplementary plate was attached. The results of this study can be used to inform the design and development of radial gates, as well as maintenance plans for their economical operation.
Introduction
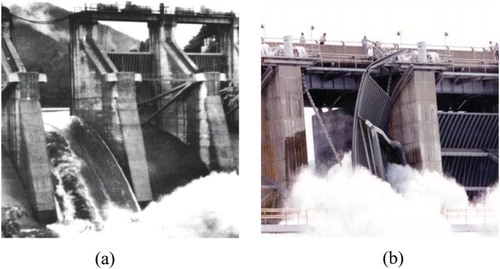
Radial gates are a type of radial arm floodgate used in dams and canal locks to control water flow. They are the most common type of spillway gate in use today and consist of a curved skin plate supported by a structural steel frame. They play an important role in mitigating flooding, utilizing water, and maintaining river environments. Although radial gates are manufactured to have sufficient stiffness for the design water pressure, large vibrations can be produced due to the vortices generated by water pressure fluctuation during discharge. Excessive vibration can cause fatigue failure in radial-gate connectors; therefore, it is necessary to both investigate vibration-reduction methods for the gate during operation and confirm safe operation with respect to the design water pressure. The radial gates of Wachi Dam in Japan and the Folsom Dam in the United States (US) were destroyed due to the vortex-induced vibrations generated when the gates were partially opened in 1967 and 1995, respectively (Figure ).
Figure 1. Examples of sluice gate collapse due to excessive vibration: (a) Wachi Dam on the Yura River in Japan, July 1967; (b) Folsom Dam, California, USA, July 1995.
Kolkman (Citation1974) and Thang and Naudascher (Citation1986) showed that radial-gate vibration is caused by the separation and reattachment of the water flow around the radial gate and the resulting unstable flow below the gate. Based on these two studies, many similar studies have been conducted on radial-gate vibration. Abelev (Citation1979) used the Strouhal number to predict the vibration frequency of the vertical gates of a spillway during discharge. Thang and Naudascher (Citation1986) confirmed that radial-gate vibration can be amplified by the pressure changes caused by different upstream and downstream water levels, which can adversely affect opening and closing operations. Jongeling (Citation1988) investigated flow-induced vibrations when the opening height of a rectangular-shaped gate was small. Boldyrev, Lupuleac, and Zhelezhyakova (Citation2004) and Petukhov (Citation2008) used turbulence models to show that radial-gate vibration can result from vortices generated at the lower edge of the gate.
Most of the previous studies on radial-gate vibration were carried out using hydraulic experiments on full-scale or model gates. Although hydraulic experiments can provide practical results when investigating radial-gate vibration, a lot of time and money is required to construct and calibrate the specimen; moreover, there are limitations in terms of considering various design parameters under different scenarios. In recent years there have been considerable efforts to formulate initial designs for radial gates using numerical analysis in order to reduce the time and cost of the design process. Compared to hydraulic experiments, designs based on numerical analysis can be used to evaluate gate performance in relation to a wider range of design variables. Existing methods for numerically analyzing radial-gate vibration use the results of fluid domain analyses as the initial and boundary conditions for the structural domain analysis, and the fluid and structural domains are simulated separately (Hyun, Lee, & Koo, Citation2014; S. H. Kim et al., Citation2012). This single-domain analysis approach is based on the assumption that the interaction between the fluid and the structure does not have a large effect on the overall result, and that the deformation of the fluid due to the vibration of the structure is not important. However, the radial-gate vibration should reflect the vibration of the fluid, the deformation of the structure due to the fluid vibration, and changes in the fluid domain; thus, advanced analytical methods which take into account the fluid–structure interaction (FSI) and can simultaneously consider the interaction between the fluid and the structure should be used.
Recent advances in the fields of computational fluid dynamics (CFD) and computational structural mechanics (CSM) have resulted in the formulation of numerical solutions for the FSI problem, which is often too complex to solve analytically. In general, numerical analytical methods for solving the FSI problem can be broadly classified into two approaches: the monolithic approach and the partitioned approach. In the monolithic approach (Hübner, Walhorn, & Dinkler, Citation2004; Michler, Hulshoff, van Brummelen, & de Borst, Citation2004; Ryzhakov, Rossi, Idelsohn, & Oñate, Citation2010), the governing equations of the fluid and the structure are solved simultaneously with a single solver, and the interfacial conditions between the fluid and structural domains are implicit in the solution procedure. This approach can attain good solution accuracy for multiphysics problems, but requires the development of specialized code for the combination of fluid and structure that is under examination. In the partitioned approach (Matthies, Niekamp, & Steindorf, Citation2006; Matthies & Steindorf, Citation2003), the governing equations of the fluid and the structure are solved separately with their own mesh discretization and distinct solvers, and the interfacial conditions are explicitly used to couple the solutions for the fluid and structural domains. This approach facilitates the solving of flow equations and structural equations using different techniques which have been specifically developed for each type of equation, although the simulations require a stable and accurate coupling algorithm to formulate the end result (Felippa, Park, & Farhat, Citation2001; Piperno & Farhat, Citation2001).
FSI analysis methods can also be classified according to two methods for the treatment of meshes (Bungartz & Schäfer, Citation2006): the conforming mesh method and the non-conforming mesh method. The conforming mesh method uses meshes that conform to the interface between the fluid and structural domains. To deal with fluid dynamic load transfer and elastic deformation update at the interface, the point match method (Brown, Citation1997; Onish, Kimura, Guo, & Iwamiya, Citation1998; Samareh, Citation1999) and the artificial interface structure method (Hou & Satyanarayana, Citation2000; Kapania, Bhardwaj, Reichenbach, & Guruswamy, Citation1996) have been developed. On the other hand, the non-conforming mesh method imposes the interface conditions as constraints to the model equations such that the mesh conforming to the interface does not have to be used. The non-conforming mesh method has been extensively developed based on the framework of immersed methods (Blake, Citation1999; D. Kim & Choi, Citation2006; D. Kim & Peskin, Citation2007; Liu, Kim, & Tang, Citation2006; Peskin, Citation1977; J. Wang & Layton, Citation2009; X. S. Wang & Liu, Citation2004; L. T. Zhang & Gay, Citation2007), a class of FSI methods that add equivalent force terms to the fluid equations in order to reflect the FSI.
The FSI methods presented above have been applied to a variety of engineering problems. Benra, Dohmen, Pei, Schuster, and Wan (Citation2011) demonstrated the advantages of FSI by using it to predict the deflection behavior of a cantilever beam which could not be predicted using single-domain analysis. Siba, Wanmahmood, Zakinuawi, Rasani, and Nassir (Citation2016) investigated the damage caused to orifice and pipe structures by fluid-induced vibrations and showed that FSI analysis captures drastically changing vorticity and swirling activities more accurately than conventional methods. Other FSI applications include, but are not limited to, aerodynamics (Hasse, Citation2001; W. Zhang, Jiang, & Ye, Citation2007), complex flows in irregular domains (Fadlun, Verzicco, Orlandi, & Mohd-Yusof, Citation2000; Udaykumar, Mittal, Rampunggoon, & Khanna, Citation2001), and turbulence (Kaligzin & Iaccarino, Citation2003; Yang & Balaras, Citation2006). Furthermore, hydraulic modeling case studies such as the diffusion prediction of pollutants (Chau & Jiang, Citation2002, Citation2004), asymmetric orifice design in a surge tank (Gabl & Righetti, Citation2018), turbulence simulation in fluvial applications (Farhadi, Mayrhofer, Tritthart, Glas, & Habersack, Citation2018), and the mathematical modeling of water quality rehabilitation (Wu & Chau, Citation2006) have all been conducted using advanced CFD methods.
In this study, an FSI analysis of radial-gate vibration is conducted on a model of the Saemangeum tide embankment radial gate in South Korea. The numerical analysis methods used to solve the FSI problem are the partitioned approach and the non-conforming mesh method. Among the various types of gate, the radial gate is a complex structure that is rotated around a gate arm with a constant radius of gyration and lifted by a lifting lug. When lifted, the radial gate is more likely to experience vibrations due to flowing fluid than a rectangular gate. Because the magnitude of the gate vibration due to the flowing fluid varies depending on the shape of the lower part of gate, it is necessary to investigate the fluid flow and gate vibration as a function of the gate opening level. As the aim is to reduce radial-gate vibration, the dynamic response of the gate was calculated at discharge using FSI analysis and the accuracy of the numerical results was verified through comparison with experimental results. A supplementary plate for reducing vortex generation was attached to the lower rear surface of the gate in order to evaluate its effectiveness at reducing the vibration in the gate.
The Saemangeum tide embankment radial gate
The Saemangeum tide embankment was constructed as part of a reclamation project that transformed mudflat and ocean into land along the west coast of South Korea. It is 33.9 km long, linking Gunsan City, Gogunsan Islands, and Buan-gun in Jeonlabuk-do. As part of the tide embankment, 36 radial gates were installed for flood prevention and the efficient management of a freshwater lake.
In 1995, the Korea Rural Community Corporation conducted a hydraulic experiment on a model of the Saemangeum tide embankment radial gates to measure the gate vibrations for several opening levels. The model used in this experiment was 1.2 m wide and 0.5 m high, with a scale of 1:25 (Figure ). The gate body was made from acrylic, and the gate arm and lifting lug were made from steel. Changes in vibration due to flowing water were measured at various gate opening heights using an accelerometer installed at the center of the gate’s bottom in a waterway that was 30 m in length, 1.2 m in width, and 0.5 m in height. As shown in Table , a gate acceleration of 0.07 m/s2 was measured at an opening height of 0.01 m and the largest vibration was observed at an opening height of 0.08 m. The vortex shedding occurred at the lower back part of the radial gate when it was opened. The assessment showed that the vortex suddenly increased when the opening height was 0.08 m, causing large vibrations. To reduce the sudden increase in vortices, the shape of the gate was changed by attaching a supplementary plate to its lower rear surface. It was confirmed that the vortex shedding was significantly reduced at an opening height of 0.08 m, thereby also reducing the large amount of vibration.
Figure 2. Hydraulic experiment to measure the vibration in the Saemangeum tide embankment radial gates: (a) the discharge experiment; (b) the radial-gate model.
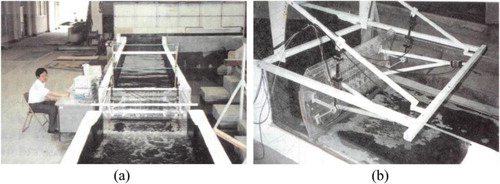
Table 1. Absolute maximum vertical acceleration measured at the bottom center of the model of the Saemangeum tide embankment radial gate.
FSI analysis of the Saemangeum radial gate
FSI analysis can provide more accurate results than conventional analysis methods because it considers the interactions between the fluid and the structure as functions of both space and time (Benra et al., Citation2011; Siba et al., Citation2016). To analyze the vibrations of and flow properties around the radial gate, FSI analysis was performed by utilizing the commercial computational fluid analysis program ANSYS CFX (Perng, Citation2011). The results of the FSI analysis are compared with the hydraulic experiments to validate the numerical model, after which the effects of reducing the radial-gate vibration by attaching a supplementary plate to the gate’s lower rear surface are examined, as this changes the flow properties that are hypothesized to be the main cause of the vibration.
Analysis procedure
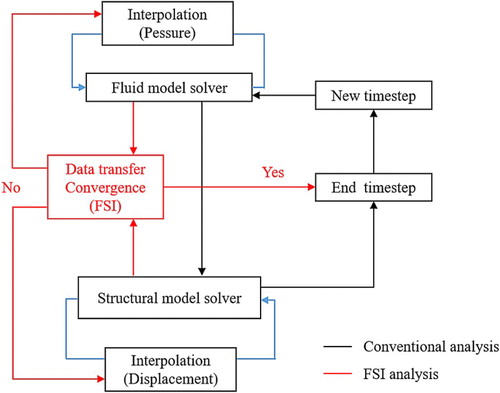
In the past, both the fluid and the structure have been examined using a single-domain analysis, based on the assumption that the interactions between the fluid and the structure are not important. In recent years however, the modeling of FSI has been required in order to more accurately predict the responses of large structures that are subject to fluid flow. In FSI analysis, the fluid motion is analyzed by utilizing the initial and boundary conditions of the fluid and the structure, and the deformation of the structure is calculated based on the effects of the fluid on the structure (Figure ). The result is then reflected in the fluid–structure interface and the flow field analysis is performed again. By repeating these flow and structural analyses, the flow field and structural responses over time are calculated together.
Figure 3. Flow chart of the FSI analysis process for investigating radial-gate vibration.
Governing equations
A solution to a system domain that consists of a fluid domain (
) and a structural domain (
) with the external boundary
can be obtained by solving d’Alembert's formula:
(1) where
is the density,
is the velocity,
is the time,
is the stress,
is the body forces 0such as gravity, and the subscripts i and j are the coordinate directions. The equilibrium equation for the structural domain is given as:
(2) where the superscript s denotes the structural domain. The equilibrium equation for the structural domain is generally represented by the Lagrangian description. In Eq. (2), the first and second terms represent the inertia forces and the internal stresses per unit volume of the structure, respectively.
The equation for the fluid domain is represented as follows (in general, the Eulerian description is used for the equation):
(3) where the superscript f denotes the fluid domain. Therefore, the acceleration of the fluid can be expressed by Eq. (4) and the stress
for an incompressible Newtonian fluid can be described by Eq. (5):
(4)
(5) where
is the hydrostatic stress,
is the shear stress, and
is the Kronecker delta. When using Eqs. (2) and (3) to describe the behavior of the fluid and the structure, Dirichlet and Neumann boundary conditions – such as Eqs. (6) and (7) below – can be used to satisfy the continuity condition along the interface
. Eq. (6) represents the displacement continuity condition, by which the fluid and the structure share the same boundary, and Eq. (7) represents the traction continuity condition, which should be satisfied for the stress field to be continuous at the interface:
(6)
(7) where
denotes the normal vector component in the ith direction.
Load approximation
Most FSI analysis methods use a generalized Gauss–Seidel iterative approach (Hou, Wang, & Layton, Citation2012; Newman, Newman, Taylor, & Hou, Citation1999) for the coupled analysis wherein the fluidic and structural computations are performed in a sequential manner. During the FSI analysis procedure, the load and displacement data should be transferred between the fluid and structural domains. Among the data transfer methods proposed to date, the mortar method is an artificial-interface structural method which introduces an artificial thin shell structure to cover the interface between the structural model and the fluid dynamic model (Hou & Satyanarayana, Citation2000; Kapania et al., Citation1996). To construct the mesh of the artificial shell structure, the fluid dynamic surface mesh can be updated by dividing the surface mesh elements to create a new mesh that includes the structural surface nodes. As a result, the interface shell structure includes the structural nodes as part of its surface mesh. To find the corresponding nodal forces to apply to the structural surface, the forces at the fluid surface nodes are calculated by solving the following linear system of equations:
(8) where
is the stiffness matrix associated with the new surface mesh that consists of the fluid and structural boundaries, the subscripts f and s represent the fluid and the structure, respectively, and
denotes the displacement vector at the structural surface nodes and is assumed to be zero at the beginning of the FSI analysis. The reaction force vector
applied at the constrained structural domain nodes is given by Eq. (9), and the displacement
at the fluid surface nodes is given by Eq. (10). The fluid dynamic load to be applied to the structural surface node for structural analysis is calculated as
The equations are as follows:
(9)
(10)
Deformation tracking
Updating the fluid domain mesh by computing the structural displacements is an important step in FSI analysis, and the corresponding surface deformation of the fluid domain can be obtained by using the following equation:
(11) At this point, the external force on the structural region is not considered, but the displacement of the structural surface
is known a priori from previous calculations, so the displacement of the fluid surface nodes can be calculated. The displacement of the fluid surface nodes
can be calculated by solving Eq. (12), in which the calculated displacement
for the structural surface can be referred to as an interface condition for the fluid and structural domains, based on the assumption that the interface nodes can be taken as both fluid and structural surface nodes:
(12)
Modeling of the radial gate
To perform the FSI analysis of the gate–water system, the radial gate is modeled with a width of 1.2 m and a height of 0.5 m (Figure ), which is the same size as the physical model of the Saemangeum tide embankment radial gate used in the aforementioned experiment. The material properties of the numerical model are also the same as the physical model (Table ). Figure shows a discretized fluid–structural domain for the gate–water system. The Fluid 142 hexahedron element of ANSYS CFX is used for modeling the fluid domain, and the Solid 72 tetrahedron element of ANSYS Mechanical is used for modeling the solid gate. Fluid 142 is from the FLOTRAN CFD element library and can be used for modeling steady-state or transient-state fluid/thermal systems in order to calculate the flow field and the heat distribution. The Solid 72 element is characterized by four nodes with six degrees of freedom and is capable of modeling an anisotropic medium. Figures (a) and 6(b) show the geometric features of the Fluid 142 and Solid 72 elements, respectively. The average size of the elements in the fluid domain is 0.03 m, while dense elements with a minimum size of 0.002 m are used around the radial gate, where the vortex is created during the water discharge.
Figure 4. Three-dimensional models of the Saemangeum tide embankment radial gates: (a) FEM model; (b) rear view of the geometric model.
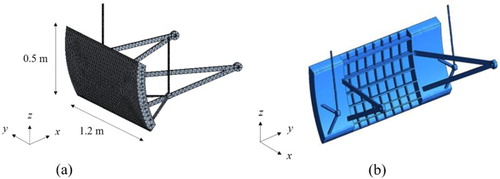
Figure 5. Discretization of the fluid–structural domain for the discharge simulation of the Saemangeum tide embankment radial gate: (a) the domain and the boundary conditions; (b) the mesh.
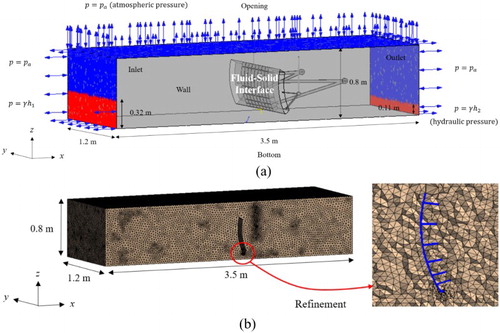
Figure 6. The geometric features of (a) the Fluid142 element; (b) the Solid72 element.
Table 2. Material properties of the models of the radial gate.
To simulate the fluid flow due to the upstream and downstream water levels, the pressure boundary conditions of the inlet and outlet are defined below using water density and atmospheric pressure at room temperature (25°C):
(13)
(14)
(15)
(16)
(17) where
is the pressure,
is the atmospheric pressure which is set to 0 Pa,
is the density of the water,
is the gravitational acceleration, and
and
are the upstream and downstream water levels, respectively, with the values of
and
.
Figure shows a schematic description of the displacement boundary conditions for the radial-gate structure, and Table summarizes the boundary conditions on Surfaces R1 and C1 of the connection members of the gate. R1 is the upper surface of the lifting lug for the radial gate and is fixed in the height (z) and width (y) directions, whereas the displacement in the stream (x) direction in which the water flows is not constrained. C1 is part of the end surface of the gate arm (Figure (c)), for which the tangential displacement is not constrained in order to model the rotation of the gate arm.
Figure 7. FSI analysis of the radial gate: (a) the boundary conditions; (b) Surface R1; (c) Surface C1.
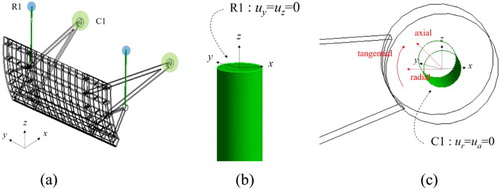
Table 3. Boundary conditions for the FSI analysis of the radial gate.
For the water and gate structure models created above, the dynamic response of the gate–water system for 10 s of water discharge was calculated by FSI analysis for gate openings of 0.01 m, 0.02 m, 0.04 m, 0.06 m, 0.08 m, and 0.10 m. The water level difference between upstream and downstream was set to 0.21 m, which is identical to the experimental condition. The experimental results show that the water flow through the gate reached a steady state during the discharge (Korea Rural Community Corporation, Citation1995). For validation of the domain discretization, the effect on the numerical solution of varying the mesh size was investigated. Table shows the absolute maximum vertical acceleration of the gate at an opening height of 0.04 m for different fluid domain mesh sizes. The maximum acceleration value of the gate does not change significantly with a mesh size of 0.03 m or less; therefore, an average element size of 0.03 m for the fluid domain mesh is feasible for this simulation. In the next section, the results of the FSI analysis and the hydraulic experiment are compared in order to validate the water and gate structure models. The effect of attaching a supplementary plate to the lower rear surface of the radial gate on reducing water vortices and gate vibration is also examined.
Table 4. Variation of the absolute maximum vertical acceleration of the radial gate with changes in the mesh size used for the fluid domain at a gate opening height of 0.04 m.
Results of the FSI analysis
Modal analysis
To calibrate the finite-element method (FEM) model of the radial gate, a modal analysis of the gate structure was performed and the natural frequency obtained from the analysis was compared with that obtained from the hydraulic experiment. Table and Figure present the natural frequencies of the first three modes of the radial-gate vibration, and it can be seen that they are similar to the natural frequencies obtained from the experiment. When a rectangular supplementary plate was attached to the lower rear surface of the radial gate, the natural frequencies were slightly increased by 0.3% and 1.8% for the first and second modes, respectively, which are negligible. Figure shows the mode shapes of the radial-gate structure for the first, second, and third modes.
Figure 8. The natural frequencies of the radial-gate structure obtained from the experiment and the modal analysis.
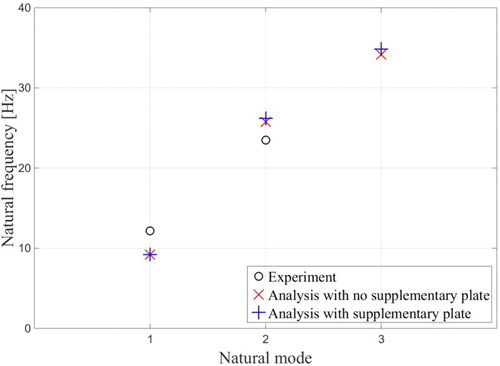
Figure 9. Modal analysis results of the radial gate structure for: (a) the first mode; (b) the second mode; (c) the third mode.
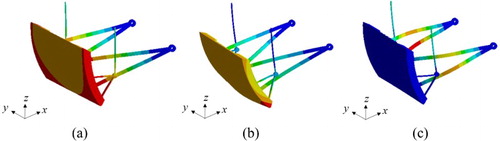
Table 5. Natural frequencies of the radial-gate structure obtained from the experiment and modal analysis.
Figure 10. FEM model of the reduced-scale radial gate with a rectangular supplementary plate at the lower back surface: (a) rear view of the FEM model; (b) location (red box) and size of the supplementary plate.
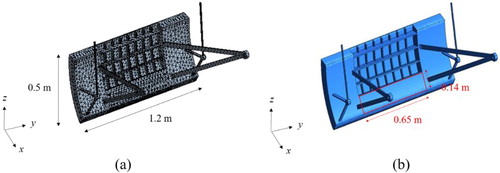
Figure 11. The angle between the supplementary plate and the horizontal axis.
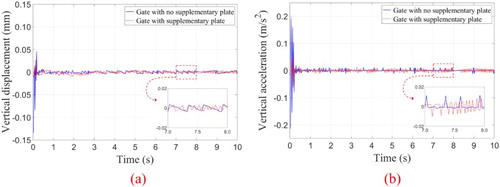
Figure 12. Time histories at the lower center of the radial gate for: (a) the vertical displacement; (b) the vertical acceleration.
FSI analysis
In the radial-gate vibration experiment, the vertical acceleration of the gate during water discharge was diminished when a rectangular plate was attached to the lower rear surface of the gate (Korea Rural Community Corporation, Citation1995). To confirm this result, a 0.65 m × 0.14 m plate with a thickness of 3 mm was additionally added to the lower rear surface of the radial-gate model (Figure ). The size of the supplementary plate is the same as in the experiment. The plate is attached to the center of the lower rear surface of the gate. As the gate is lifted up for water discharge, the angle between the supplementary plate and the horizontal line described in Figure changes. Table shows how the angle varies with the gate opening height. An FSI analysis was performed with the modified gate model during water discharge. Figure shows the time history of the vertical displacement and acceleration calculated at the center of the radial gate’s bottom when the opening height is 0.08 m. Both responses decreased significantly after the back plate was attached; specifically, the absolute maximum displacement decreased from 0.13 mm to 0.03 mm and the absolute maximum acceleration decreased from 0.21 m/s2 to 0.06 m/s2 (Figure ).
Table 6. Variation of the angle between the supplementary plate and the horizontal axis with the gate opening height.
Table and Figure show the relation between the absolute maximum vertical acceleration of the radial gate and the gate opening height during water discharge. Among the various opening heights, the absolute maximum acceleration is highest at a gate opening height of 0.08 m. Table also shows the error between the numerical and experimental results and the reduction rate of the acceleration when the supplementary plate is added. From these results, it can be seen that the experiment and the FSI analysis show similar values of the maximum vertical acceleration of the radial gate. For gate opening heights over 0.01 m, the acceleration was reduced by more than 28% after the supplementary plate was attached. In particular, the absolute maximum acceleration of the gate at an opening height of 0.08 m was reduced to about 75% of the original maximum acceleration by the addition of the plate.
Figure 13. The absolute maximum vertical acceleration at the rear lower center of the radial gate.
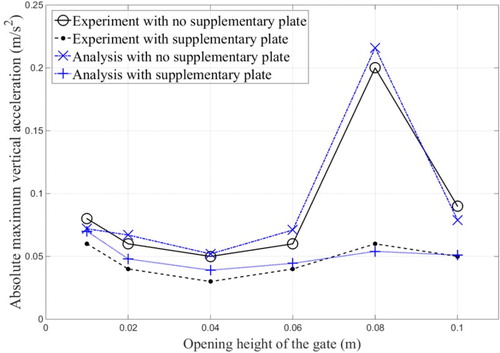
Table 7. Numerical and experimental results for the absolute maximum vertical acceleration of the radial gate at various opening heights.
To validate the FSI effect in the water discharge simulation, the results of the FSI analysis were compared with those of a single-domain analysis (Table ). According to the results, the FSI analysis shows a larger vibration of the gate due to water discharge than the single-domain analysis, which does not consider the FSI effects. Moreover, the FSI analysis results are closer to the experimental results.
Table 8. Comparison of the results of the FSI analysis with those of a single-domain analysis.
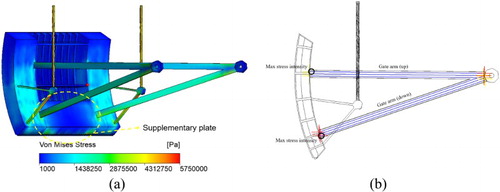
Figure (a) presents a contour plot of the von Mises stress of the radial-gate system, including the gate arms, which shows that the maximum von Mises stress of the gate system is 5.64 MPa, which occurs at the vertical lifting bars. The stress value is less than 2% of the yield strength of the steel. The elastic buckling strength of the gate arms is calculated as 560 MPa using the critical stress equation , where the value of Young's modulus
is 200,000 MPa for the steel gate arm, the length
is 0.738 m, and the width and height of the rectangular cross-section of the gate arm are 0.010 m and 0.030 m, respectively. For the fixed-pin support condition of the gate arm (Figure (b)), the effective length factor
is 0.7, and the maximum axial stresses of the upper and lower gate arms are 1.86 MPa and 2.65 MPa, respectively, which are less than the buckling strength. Therefore, the gate arms can be considered as being stable during water discharge.
Figure 14. The radial-gate system during water discharge: (a) contour plot of the von Mises stress (the dotted circle indicates the supplementary plate); (b) the upper and lower gate arms (the circles indicate the points of maximum axial stress).
Swirling strength
When water discharges due to the radial gate being opened, the flow velocity under the gate drastically accelerates due to the decrease in the cross-sectional area of the water passage, and the pressure field varies locally due to the various sizes of the vortices on the lower rear side of the gate. To examine the vortex intensity at the bottom of the radial gate, the swirling strength of the fluid flow is investigated numerically. The swirling strength can be defined as the imaginary part of the complex eigenvalue of the velocity gradient tensor, which quantitatively represents the intensity of the vortex. The velocity gradient tensor can generally be decomposed as follows:
(18) where
is an eigenvalue corresponding to the eigenvector
and
are complex eigenvalues corresponding to the eigenvectors
and are expressed as complex conjugates. By expressing the local streamlines in the coordinate system as the three vectors
, the local flow separation or reattachment in the direction of
can be identified and the swirling strength in the plane of
and
can be calculated. Specifically, the component
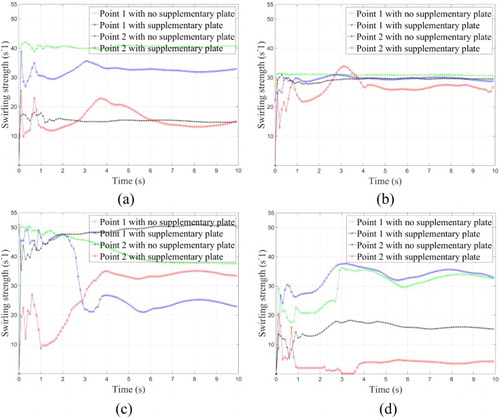
of the center matrix of the decomposed velocity gradient tensor given in Eq. (18) is the swirling strength of the fluid. If the swirling strength is large then the strength of the eddy current is also large, and fluid separation and reattachment to the structure occurs frequently. Figure presents the velocity field and swirling strength contours around the lower rear side of the radial gate for different opening heights, and it can be seen that the intensity of the local vortex in this area is reduced after the supplementary plate is attached. Figure shows a time history of the swirling strength at Points 1 and 2 near the bottom of the gate (as defined in Figure ) both with and without the supplementary plate. According to the results, the swirling strength of the water at Point 1 near the bottom center of the gate is reduced by 10% to 22% for gate opening heights of 0.01 m, 0.04 m, 0.08 m, and 0.10 m after the supplementary plate is attached. The swirling strength of the water at Point 2 near the end of the bottom surface of the gate in the direction of the flow shows a reduction of 11% to 58% after the supplementary plate is attached. The greatest reduction in swirling strength is achieved at gate opening heights of 0.01 m and 0.08 m for Points 1 and 2, respectively. The swirling strength around Point 2 increases sharply at a gate opening height of 0.08 m compared to the other opening heights; however, it decreases significantly after the supplementary plate is attached (Figure ).
Figure 15. The velocity field and swirling strength of the water flow around the bottom of the radial gate during water discharge for the original gate (left) and the gate with the supplementary plate installed (right) for opening heights of: (a) 0.04 m; (b) 0.08 m.
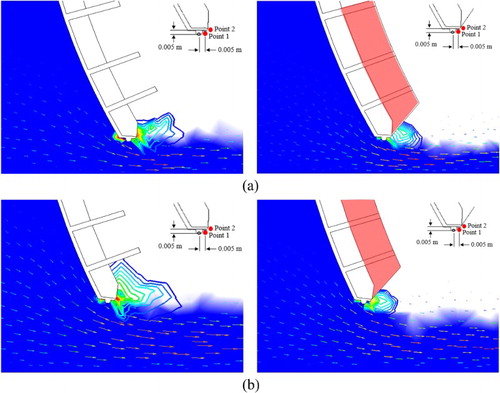
Figure 16. Time histories of the swirling strength around the bottom of the radial gate at Points 1 and 2 (as defined in Figure ) during water discharge for gate opening heights of: (a) 0.01 m; (b) 0.04 m; (c) 0.08 m; (d) 0.10 m.
Figures and show how the numerically calculated swirling strengths change over time with the radial-gate opening height for Point 1 and Point 2 (as defined in Figure ), respectively. For Point 2, the swirling strength is greatest at an opening height of 0.08 m, and the effect of the supplementary plate on swirling strength reduction is also greatest at this height. Similarly, for Point 1 the effect of the supplementary plate on swirling strength reduction is greatest at an opening height of 0.08 m, after 4 s. The reduction in swirling strength can be explained by the decrease in the velocity gradient around the lower rear surface of the gate, which in turn reduces the eigenvalue of the velocity gradient tensor presented in Eq. (18). Since the swirling strength is defined as the imaginary part of the complex eigenvalue of the velocity gradient tensor, the smoother flow that results from the attachment of the supplementary plate has the effect of reducing the swirling strength. Figure shows the power spectral densities for the gate acceleration and the swirling strength of the water at an opening height of 0.08 m. The spectral densities indicate that the dominant frequency of the gate acceleration is higher than that of the swirling strength change. The figure also shows a decrease in the power spectral density of the gate acceleration and the swirling strength of the water after the supplementary plate is attached.
Figure 17. The variation of the swirling strength at Point 1 (as defined in Figure ) with the gate opening height for: (a) t = 2 s; (b) t = 4 s; (c) t = 6 s; (d) t = 8 s.
Figure 18. The variation of the swirling strength at Point 2 (as defined in Figure ) with the gate opening height for: (a) t = 2 s; (b) t = 4 s; (c) t = 6 s; (d) t = 8 s.
Figure 19. Spectral densities at a gate opening height of 0.08 m for: (a) the gate acceleration; (b) the swirling strength of the water.
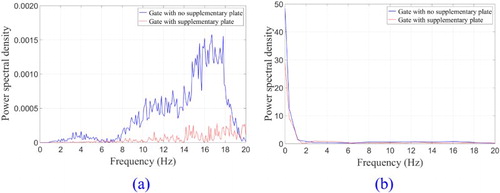
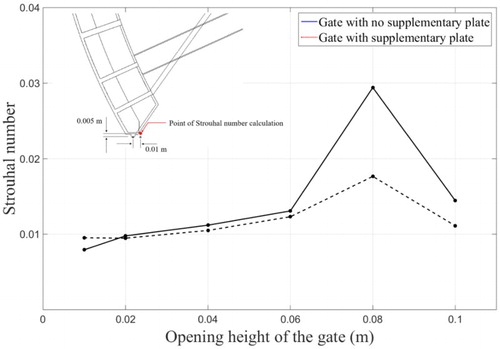
Figure 20. The variation of the Strouhal number with the gate opening height both with and without the supplementary plate.
Strouhal number
To quantitatively evaluate the effect that attaching the supplementary plate has on reducing the gate vibration, the Strouhal number is introduced, which can represent the intensity of the vibration generated in the structure due to vortex shedding. For a steady flow with a Reynolds number (Re) of less than , streamlines around the structure tend to be symmetrical and only drag is present. However, lift and vortices are likely to occur for asymmetric flows with large values of Re, which can result in fluid being separated from the surface of the structure by a reverse pressure gradient. This can cause vortices to be periodically generated and eliminated, resulting in forces being applied to the structure in the direction perpendicular to the fluid movement. The Strouhal number is an effective non-dimensional parameter for evaluating the effects of such vortices on structures; if it is greater than 1 then the viscosity of the fluid greatly affects the vibration of the structure, and if it is less than
then high-speed, quasi-steady-state fluid flow greatly affects the vibration of the structure. For Strouhal numbers between
and 1, structural vibration is mainly affected by suddenly changing eddy currents (Sobey, Citation1982). The Strouhal number is represented as:
(19) where
denotes the Strouhal number at a particular point,
is the frequency of the fluid oscillation,
is the characteristic length (e.g. the hydraulic diameter), and
is the flow velocity near to the particular point. The Strouhal number can be calculated with Eq. (19) by using the dominant frequency of fluid oscillation obtained by the fast Fourier transform of the transient local velocity of the fluid. Figure shows the point at which the Strouhal number is calculated at the lower rear center of the radial gate. The characteristic length was set to 0.02 m as the bottom thickness of the gate. Figure also shows the variation of the Strouhal number with the gate opening height both before and after the supplementary plate is attached; it can be seen that the Strouhal number is reduced after the supplementary plate is attached – especially when the opening height is 0.08 m, which is when the greatest vibration occurs.
Conclusions
To evaluate the intensity of the vibration in a radial gate during water discharge, FSI analysis of the dynamic response of the radial gate was performed for various opening heights during water discharge. The error between the acceleration responses of the gate obtained from the experiment and the FSI analysis is about 10% to 15%. It was found that the local vortices at the bottom of the gate greatly increase at an opening height of 0.08 m, at which time the greatest gate acceleration occurred. However, the absolute maximum vertical acceleration was found to decrease by about 75% after a supplementary plate was attached to the lower rear surface of the radial gate. The following observations are noted:
The vertical acceleration resulting from the dynamic response in the modelled radial gate at various opening heights is similar to that of the radial gate in the experiment (Korea Rural Community Corporation, Citation1995).
The absolute maximum vertical acceleration of 0.216 m/s2 occurred at an opening height of 0.08 m, at which point the swirling strength and Strouhal number suddenly increased.
The analyses of the flow characteristics show that local vortices near the rear bottom of the radial gate were the main cause of the vibration. The absolute maximum vertical acceleration decreased by about 75% at an opening height of 0.08 m after a rectangular supplementary plate was attached to the rear lower surface of the gate, resulting from a reduction in the water vortices near the bottom of the gate.
The Strouhal number was calculated to quantitatively evaluate the strength of the gate vibration. The absolute maximum vertical acceleration and Strouhal number decreased after attaching the plate. In the case of the height opening of 0.08 m, for which the largest vibration was observed, the Strouhal number decreased by 42%, from 0.029 to 0.017.
Disclosure statement
No potential conflict of interest was reported by the authors.
ORCID
Jun Won Kang http://orcid.org/0000-0001-9630-3898
Additional information
Funding
Related Research Data
References
- Abelev, A. S. (1979). Investigation of the total pulsating hydrodynamic load acting on bottom outlet sliding gates and its scale modelling. Proceedings of 8th IAHR congress ( 10A, pp. 1–29). Montreal, CAN.
- Benra, F.-K., Dohmen, H. J., Pei, J., Schuster, S., & Wan, B. (2011). A comparison of one-way and two-way coupling methods for numerical analysis of fluid–structure interactions. Journal of Applied Mathematics, 2011, 1–16. (Article ID 853560). doi: 10.1155/2011/853560
- Blake, J. (1999). Fluid mechanics of ciliary propulsion: Computational modeling in biological fluid dynamics: Fluid mechanics of ciliary propulsion. New York, NY: Springer.
- Boldyrev, Y., Lupuleac, S., & Zhelezhyakova, O. (2004). Numerical simulation of the turbulent flow in the dam ship passing channel. Paper presented at the proceedings of the conference innovations and technical policy. St. Petersburg, RUS.
- Brown, S. A. (1997). Displacement extrapolations for CFD+CSM aeroelastic analysis. 38th structures, structural dynamics and materials conference (pp. 291–300). Kissimmee, FL, USA.
- Bungartz, H. J., & Schäfer, M. (2006). Fluid–structure interaction: Modelling, simulation, optimization. New York, NY: Springer.
- Chau, K. W., & Jiang, Y. W. (2002). Three-dimensional pollutant transport model for the pearl river estuary. Water Research, 36(8), 2029–2039. doi: 10.1016/S0043-1354(01)00400-6
- Chau, K. W., & Jiang, Y. W. (2004). A three-dimensional pollutant transport model in orthogonal curvilinear and sigma coordinate system for Pearl river estuary. International Journal of Environment and Pollution, 21(2), 188–198. doi: 10.1504/IJEP.2004.004185
- Fadlun, E. A., Verzicco, R., Orlandi, P., & Mohd-Yusof, J. (2000). Combined immersed-boundary finite-difference methods for three-dimensional complex flow simulations. Journal of Computational Physics, 161, 35–60. doi: 10.1006/jcph.2000.6484
- Farhadi, A., Mayrhofer, A., Tritthart, M., Glas, M., & Habersack, H. (2018). Accuracy and comparison of standard k–ϵ with two variants of k–ω turbulence models in fluvial applications. Engineering Applications of Computational Fluid Mechanics, 12(1), 216–235. doi: 10.1080/19942060.2017.1393006
- Felippa, C. A., Park, K. C., & Farhat, C. (2001). Partitioned analysis of coupled mechanical systems. Computer Methods in Applied Mechanics and Engineering, 190, 3247–3270. doi: 10.1016/S0045-7825(00)00391-1
- Gabl, R., & Righetti, M. (2018). Design criteria for a type of asymmetric orifice in a surge tank using CFD. Engineering Applications of Computational Fluid Mechanics, 12(1), 397–410. doi: 10.1080/19942060.2018.1443837
- Hasse, W. (2001). Unsteady aerodynamics including fluid/ structure interaction. Air and Space Europe, 3, 83–86. doi: 10.1016/S1290-0958(01)90063-2
- Hou, G., & Satyanarayana, A. (2000). Analytical sensitivity analysis of a static aeroelastic wing. 8th symposium on multidisciplinary analysis and optimization, multidisciplinary analysis optimization conferences (pp. 2000–4824). Long Beach, CA, USA.
- Hou, G., Wang, J., & Layton, A. (2012). Numerical methods for fluid–structure interaction — a review. Communications in Computational Physics, 12(2), 337–377. doi: 10.4208/cicp.291210.290411s
- Hübner, B., Walhorn, E., & Dinkler, D. (2004). A monolithic approach to fluid–structure interaction using space–time finite elements. Computer Methods in Applied Mechanics and Engineering, 193, 2087–2104. doi: 10.1016/j.cma.2004.01.024
- Hyun, J. J., Lee, G. S., & Koo, M. C. (2014). Study on computer based vibration analysis method of hydraulic steel gates. Proceedings of the 2014 Korean society of mechanical engineers spring conference (pp. 99–100). Seoul, KOR (in Korean).
- Jongeling, T. H. G. (1988). Flow-induced self-excited in-flow vibration of gate plates. Journal of Fluids and Structures, 2(6), 541–566. doi: 10.1016/S0889-9746(88)80022-7
- Kaligzin, G., & Iaccarino, G. (2003). Toward immersed boundary simulation of high Reynolds number flows. Stanford, CA: Center for Turbulence Research, Stanford University.
- Kapania, R. K., Bhardwaj, M. K, Reichenbach, E., & Guruswamy, G. P. (1996). Aeroelastic analysis of modern complex wings. 6th symposium on multidisciplinary analysis and optimization (pp. 258–265). Bellevue, WA, USA.
- Kim, S. H., Ahn, H. T, Ryue, J. S., Shin, H. K., Kwon, O. J, & Seo, H. S. (2012). Fluid–structure interaction analysis for vortex-induced vibration of circular cylinder. Journal of Computational Fluids Engineering, 17(1), 29–35 (in Korean). doi: 10.6112/kscfe.2012.17.1.029
- Kim, D., & Choi, H. (2006). Immersed boundary method for flow around an arbitrarily moving body. Journal of Computational Physics, 212, 662–680. doi: 10.1016/j.jcp.2005.07.010
- Kim, D., & Peskin, C. S. (2007). Penalty immersed boundary method for an elastic boundary with mass. Physics and Fluids, 19(053103), 1–18.
- Kolkman, P. A. (1974). Flow-induced gate vibrations: Prevention of self-excitation computation of dynamic gate behaviour and the use of models (Doctoral dissertation). Delft University of Technology, NED.
- Korea Rural Corporation. (1995). Hydraulic experiment and wave observation in Saemangeum district. Ansan: Author (in Korean).
- Liu, W. K., Kim, D. W., & Tang, S. (2006). Mathematical foundations of the immersed finite element method. Computational Mechanics, 39, 211–222. doi: 10.1007/s00466-005-0018-5
- Matthies, H. G., Niekamp, R., & Steindorf, J. (2006). Algorithms for strong coupling procedures. Computer Methods in Applied Mechanics and Engineering, 195, 2028–2049. doi: 10.1016/j.cma.2004.11.032
- Matthies, H. G., & Steindorf, J. (2003). Partitioned strong coupling algorithms for fluid–structure interaction. Computers and Structures, 81, 805–812. doi: 10.1016/S0045-7949(02)00409-1
- Michler, C., Hulshoff, S. J., van Brummelen, E. H., & de Borst, R. (2004). A monolithic approach to fluid–structure interaction. Computers & Fluids, 33(5–6), 839–848. doi: 10.1016/j.compfluid.2003.06.006
- Newman, J. C., III, Newman, P. A., Taylor, A. C., III, & Hou, G. J.-W. (1999). Efficient non-linear static aeroelastic wing analysis. International Journal of Computers and Fluids, 28, 615–628. doi: 10.1016/S0045-7930(98)00047-4
- Onish, R., Kimura, T., Guo, Z., & Iwamiya, T. (1998). Coupled aero-structural model: Approach and application to high aspect-ratio wing-Box structures. 7th symposium on multidisciplinary analysis and optimization (pp. 1004–1010). St. Louis, MO, USA.
- Perng, Y. Y. (2011). Modeling fluid structure interactions. Unpublished manuscript, ANSYS Inc., Pittsburgh, PA, USA.
- Peskin, C. S. (1977). Numerical analysis of blood flow in the heart. Journal of Computational Physics, 25, 220–252. doi: 10.1016/0021-9991(77)90100-0
- Petukhov, E. (2008). The simulation of the Saint Petersburg flood defense system gate vibration under the loads from the moving water. Joint Advanced Student School (JASS), Saint Petersburg, RUS.
- Piperno, S., & Farhat, C. (2001). Partitioned procedures for the transient solution of coupled aeroelastic problems – part II: Energy transfer analysis and three-dimensional applications. Computer Methods in Applied Mechanics and Engineering, 190, 3147–3170. doi: 10.1016/S0045-7825(00)00386-8
- Ryzhakov, P. B., Rossi, R., Idelsohn, S. R., & Oñate, E. (2010). A monolithic Lagrangian approach for fluid–structure interaction problems. Computational Mechanics, 46(6), 883–899. doi: 10.1007/s00466-010-0522-0
- Samareh, J. A. (1999). A novel shape parameterization approach (NASA Contract No. TM-1999-209116). Hampton, VA: NASA Langley Research Center.
- Siba, M., Wanmahmood, W., Zakinuawi, M., Rasani, R., & Nassir, M. (2016). Flow-induced vibration in pipes: Challenges and solution – a review. Journal of Engineering Science and Technology, 11(3), 362–382.
- Sobey, I. J. (1982). Oscillatory flows at intermediate Strouhal number in asymmetric channels. Journal of Fluid Mechanics, 125, 359–373. doi: 10.1017/S0022112082003371
- Thang, N. D., & Naudascher, E. (1986). Vortex-excited vibrations of underflow gates. Journal of Hydraulic Research, 24(2), 133–151. doi: 10.1080/00221688609499327
- Udaykumar, H. S., Mittal, R., Rampunggoon, P., & Khanna, A. (2001). A sharp interface Cartesian grid method for simulating flows with complex moving boundaries. Journal of Computational Physics, 174, 345–380. doi: 10.1006/jcph.2001.6916
- Wang, J., & Layton, A. (2009). Numerical simulations of fiber sedimentation in Navier–Stokes flows. Communications in Computational Physics, 5(1), 61–83.
- Wang, X. S., & Liu, W. K. (2004). Extended immersed boundary method using FEM and RKPM. Computer Methods in Applied Mechanics and Engineering, 193, 1305–1321. doi: 10.1016/j.cma.2003.12.024
- Wu, C. L., & Chau, K. W. (2006). Mathematical model of water quality rehabilitation with rainwater utilization — a case study at Haigang. International Journal of Environment and Pollution, 28(3–4), 534–545. doi: 10.1504/IJEP.2006.011227
- Yang, J., & Balaras, E. (2006). An embedded-boundary formulation for large-eddy simulation of turbulent flows interacting with moving boundaries. Journal of Computational Physics, 215, 12–40. doi: 10.1016/j.jcp.2005.10.035
- Zhang, L. T., & Gay, M. (2007). Immersed finite element method for fluid–structure interactions. Journal of Fluids and Structures, 23(6), 839–857. doi: 10.1016/j.jfluidstructs.2007.01.001
- Zhang, W., Jiang, Y., & Ye, Z. (2007). Two better loosely coupled solution algorithms of CFD based aeroelastic simulation. Engineering Applications of Computational Fluid Mechanics, 1(4), 253–262. doi: 10.1080/19942060.2007.11015197