
ABSTRACT
DNA-based characterisation of microbial communities can enable those interested in bone diagenesis to address questions relating to the complexity and diversity of said microbial communities. We explored whether biases could be introduced due to differences in the DNA extraction methods used. We investigated the effect of four alternative approaches on the extraction of DNA from bone, in order to examine the resulting effect on the bacterial and fungal OTUs recovered using metabarcoding. We found that the different extraction methods resulted in differences in the microbial OTU profiles generated, both when looking at the fungal and the bacterial communities within the bone. Our results emphasise the need for consistency when working with DNA extraction if comparison of results between different research groups are to be valid. Furthermore, it is clear that future efforts will be needed to determine which methods may provide the most accurate representation of the microbial community in bones.
Introduction
There can be many reasons for wanting to study microbes in bones. In fields such as paleo-pathology (Barnes and Thomas Citation2006; Grif et al. Citation2012; Kajiya et al. Citation2010), archaeology (Hollund et al. Citation2012; Lopez-Costas, Lantes-Suarez, and Cortizas Citation2016), conservation science (Child Citation1995), palaeontology (Keenan and Engel Citation2017; Morales et al. Citation2017; Morales and Holben Citation2014) or forensic science (Damann, Williams, and Layton Citation2015; Handke et al. Citation2017; Metcalf et al. Citation2015), knowledge of the microbial composition in bone can be important for answering specific research questions. Furthermore during bone diagenesis (the processes that cause bone alteration during burial (Hedges Citation2002)), microbes play an important role in the deterioration of the bone structure. Traditionally, bacteria (Hackett Citation1981; Turner-Walker Citation2012), fungi (Wedl Citation1864) or aquatic microorganisms such as cyanobacteria (Bell, Skinner, and Jones Citation1996; Pesquero, Bell, and Fernandez-Jalvo Citation2017), have been argued to be responsible for bone destruction.
Characterisation of the microbial diversity associated with mineralised tissue diagenesis has to date mainly been accomplished through histological analysis with light, electron or confocal microscopy (Bell Citation1990; Garcia-Donas et al. Citation2017; Le Garff et al. Citation2017; Morales et al. Citation2017; Tjelldén Citation2016; Turner-Walker Citation2012). The characterisation is based on visual assessment of the tunnelling system. Wedl was the first to describe any form of mineralised tissue bioerosion in 1864, when he noticed alterations on tooth material that had been soaked in well water, and described the changes as being caused by a fungus. These types of tunnels are therefore called Wedl-tunnel after this discovery. Later Hackett (Citation1981) described how bacteria are responsible for microscopic focal destruction (MFD) and identified three types: “linear longitudinal”, “lamellate” and “budded” MFD, based on visual analysis through the microscope. More recently it has been suggested that the tunnels Wedl saw might have been derived from cyanobacteria rather than fungi (Kendall et al. Citation2018; Turner-Walker Citation2019). Despite the large amount of research done on microbial bioerosion, there is still a gap in the knowledge about the composition and function of the microbial community in degrading bone (Damann and Jans Citation2017).
Within the last decade the related fields of metabarcoding and metagenomics have rapidly evolved, and today it is possible to characterise whole microbial communities using DNA based analyses centred around the power of high-throughput sequencing platforms (Caporaso et al. Citation2011; Siles et al. Citation2018). DNA metabarcoding in particular, is an efficient and cost-effective approach for profiling the taxonomic composition of multiple microbial species in a single bulk sample (Taberlet et al. Citation2012). In particular, the 16S rRNA gene is often the phylogenetic marker of choice for profiling bacterial communities (Sinclair et al. Citation2014; Tringe and Hugenholtz Citation2008; Ziesemer et al. Citation2015), while fungal communities are often targeted across the internal transcribed spacer (ITS) regions of the ribosome encoding genes (Begerow et al. Citation2010; Ihrmark et al. Citation2012; Schoch et al. Citation2012). However, while these PCR based methods are incredibly powerful, the quality of the information recovered will always be contingent on one key assumption – that the DNA initially extracted from the samples under study is an optimal representation of the microbial community within the specimen. Whether this is the case has recently been challenged on several grounds. On the one hand, it has been questioned as to whether PCR based methods can provide truly unbiased insights into the microbial community, in comparison to, for example, shotgun metagenomic approaches (Ziesemer et al. Citation2015). This phenomenon can be driven by both biases inherent in the primer sets themselves, as well as in the context of ancient DNA studies, the differential rates of degradation of different microbial taxa. On the other hand, and of more direct relevance to this study, is the even more basic challenge of recovering unbiased DNA from the samples themselves. This is of particular relevance to samples that might contain both hard to lyse cells – such as those of many fungal and bacterial species – as well as samples such as archaeological bones that are recovered from an archaeological environment, that may contain chemical and mineral components that could inhibit the metabarcoding process (e.g. (Kuske et al. Citation1998; Lever et al. Citation2015; Wunderlin et al. Citation2013; Zhou, Bruns, and Tiedje Citation1996)).
Although numerous methods have been developed for the extraction of DNA from bone, these are predominantly developed to account for the fact that the majority of DNA within most ancient bones is microbial (Der Sarkissian et al. Citation2014; Poinar et al. Citation2006) and not of interest to the goals of most palaeogenomic studies. Thus efforts to improve protocols for extracting endogenous DNA (DNA originating from the bone itself) have been taken to make sure the microbial part is down scaled (Barta, Monroe, and Kemp Citation2013; Damgaard et al. Citation2015; Yang et al. Citation1998). Recently however, some studies have begun to focus on the environmental or pathogenic microbial DNA component in bone, and thus provide suggestions of how the microbial DNA should be extracted to enable community profiling (Margaryan et al. Citation2018). For example, Der Sarkissian and colleagues (Citation2014) used a shotgun sequencing approach to characterise the microbial community in seven ca. 200 - 13.000 year-old horse bones, after initially digesting their samples in EDTA (Ethylenediaminetetraacetic acid) overnight twice (the pellet obtained after a first EDTA digestion was subjected to an additional overnight EDTA digestion), then applying a silica-based method as described by Rohland and Hofreiter (Citation2007) then modified by Orlando and colleagues (Citation2009) to purify the DNA. EDTA has long been incorporated into protocols for the extraction of DNA from bone, due to its ability to dissolve the hydroxyapatite matrix (Rohland and Hofreiter Citation2007). For example, Prado et al. (Citation2002) showed that using EDTA as a pre-digestion agent prior to extractions gave up to 50% more endogenous DNA. Given that as with host DNA (Campos et al. Citation2012) one might expect bacterial cells to be incorporated within the hydroxyapatite matrix, it follows that EDTA pre-digestion may also be critical when targeting nucleic acids from microbes important in the bone degradation process.
As for silica-based nucleic acid purification methods, their appeal lies in that they can improve the purity of DNA recovered from ancient samples by removing inhibitors (e.g. collagen type-I or Maillard products) that may interfere with the DNA extraction and also other downstream processes such as PCR (Kalmar et al. Citation2000; Rohland and Hofreiter Citation2007). One further consideration relates to the findings of studies targeting microbial DNA in general, that have argued how incorporation of a bead-beating step during the extraction captures more diversity by mechanically disrupting otherwise difficult to lyse bacterial cells (Santos et al. Citation2015). However this step can also lead to chimeric products in the sequencing results, due to fragmentation of the DNA molecule (Salonen et al. Citation2010; Teng et al. Citation2018; Wintzingerode, Göbel, and Stackebrandt Citation1997). In light of the above, and a growing academic interest in the microbial communities within degrading bone, we set out to perform an initial exploration on how combinations of the above pre-extraction methods might affect the yield and community composition of microbial DNA in such materials. Given that our intention was to characterise the differences incurred by the different methods, as opposed to the biological relevance of the microbes recovered, and in light of the much more extensive reference databases available to use, we elected to use metabarcoding as opposed to shotgun metagenomics sequencing to generate our insights. Ultimately in doing so, we hoped to provide insights into the potential magnitude of the effect on recovered OTUs caused by different DNA extraction approaches, and thus potentially help facilitate cross-comparisons of metabarcoding studies of ancient bones.
Materials & methods
Sampling
The left fully fused humerus from a female domestic cow (Bos taurus) dated to the eighteenth century was used for the analysis (Collection ID: NHMD-ZMK-226558). It has been stored at room temperature at the Quaternary Collections at the Natural History Museum of Denmark since its excavation from an archaeological site in Copenhagen, Denmark.
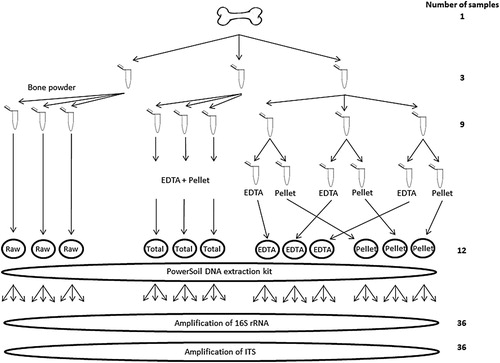
Approx. 1000 mg of bone was drilled from the lateral proximal diaphysis close to metaphysis using a Dremel handheld drill. To avoid contamination, the table, surface of the Dremel tool, and the drill head were cleaned with a 5% dilution of commercial bleach (sodium hypochlorite) solution, then rinsed in 96% ethanol before the sample was collected. A new drill bit was used which had been treated with DNA AwayTM (Thermo Fisher Scientific) before use. The bone powder was collected on aluminium foil and carefully transferred to a 1.5 mL Eppendorf® Lobind microcentrifuge tube (VWR). Twelve 50 mg subsamples were made from the powder sample ().
Figure 1. Flow diagram illustrating the four different methods tested during extraction of microbial DNA from bone, and the two different amplicon primer sets used. The different methods tested were one without predigestion (termed “raw”), and three treatments incorporating EDTA pre-digestion and filtering through Amicon tubes. These latter 3 methods differed in whether the undigested pellet, and EDTA supernatent were either mixed back together (termed “total”) or kept separately (termed “EDTA” and “pellet”) prior to final purification.
Experimental setup
We explored the effect of four different methods on the performance of extracting nucleic acids from entire microbial communities in bone (). For each method, subsequent DNA extractions were done in triplicates to test for consistency. All laboratory work was conducted at the ancient DNA facilities at the Centre for GeoGenetics, University of Copenhagen.
In the first method we extracted DNA from three subsamples (ZM1-3) taken directly from the raw bone powder, which excluded the EDTA predigestion, and are herein referred to as the “raw” method (). The inclusion of this approach was to investigate whether the EDTA predigestion was necessary for microbial DNA extraction in bones, or if it was only useful for extracting endogenous nucleic acids.
In the second method, three subsamples (ZM4-6) were initially predigested in 2 mL EDTA at room temperature with rotation for 19 h. The EDTA fraction was subsequently separated from the remaining solids by centrifugation at 13,000 g for three minutes, after which the EDTA supernatant was pipetted out of the tube. This supernatant was subsequently concentrated and purified by centrifugation through an Amicon 4 mL YM-30 filter. After the initial concentration step, the remaining concentrate was further purified using a subsequent wash with 2 mL ddH2O. This purified supernatant fraction was then returned to the undigested pellet, after which both were extracted together using the PowerSoil® DNA Isolation Kit (MoBio). This method is referred to as the “total” method.
Two additional variations were explored, to better explore the microbial DNA composition of the bone fraction targeted by the EDTA step. Specifically three additional subsamples (ZM7-9) were also initially treated with EDTA as in the second method, however the Amicon purified EDTA fraction was not returned to the pellet. Rather the pellet (ZM7.1, ZM8.1, ZM9.1, referred to as “pellet” method) and purified EDTA fractions (ZM7.2, ZM8.2, ZM9.2, referred to as the “EDTA” method) were processed in separate PowerSoil® DNA Isolations ().
DNA extraction
DNA extractions were performed using the PowerSoil® DNA Isolation Kit following the manufacturer's protocol, with minor modifications as follows. After adding solution C1 the samples were incubated at 60°C for 10 min and all centrifuging were done at 13,000 g instead of 10,000 g. Furthermore a Tissue Lyser (Qiagen) was used for 5 min at 30 Hz instead of a MO BIO Vortex Adaptor as originally suggested in the protocol. The PowerSoil® DNA Isolation Kit was chosen principally due to its incorporation of a bead beating step. An extraction blank only containing the solutions from the extraction kit was run parallel with the extraction of the samples. Post extraction, the concentration was measured by QubitTM (dsDNA high sensitivity DNA assay, Thermo Fisher Scientific) and Tape Station (2200 TapeStation, Agilent Technologies, HS Assay) but showed DNA concentrations under the detection limit (<2 ng). The bacterial communities were then PCR metabarcoded using primers that target the V4 region on the bacterial 16S rRNA gene, and the fungal ITS1 region (details next section).
Metabarcoding
Metabarcoding was performed on each DNA extract in triplicate reactions, and with PCR triplicates resulting in a total of 36 amplicons (3 × 3x4) for each primer set used (). Extraction and PCR negatives were also run with both primer sets using the same conditions as for the samples.
Bacterial metabarcoding was performed using the 515F and 806R primers to amplify the V4 region of the bacterial 16S ribosomal RNA (rRNA) gene (S1 Table) (Gilbert, Jansson, and Knight Citation2014; Ziesemer et al. Citation2015). The primers were 5’ nucleotide tagged (Binladen et al. Citation2007). Tags were 6 nucleotides long, differed by at least 3 nucleotides, and had 1 or 2 nucleotides added to their 5’ ends to increase complexity on the Illumina flowcell. For fungal metabarcording the universal genetic barcode, ITS1 (199 / 260) was used to amplify the ITS region (Ihrmark et al. Citation2012). These primers amplify a ca. 350 bp long fragment and the tags used are shown in S2 Table. Prior to metabarcoding, a subset of the DNA extracts were screened using qPCR to check for PCR inhibition. Subsequent metabarcoding PCRs were performed in 25 µL reactions, with each reaction containing 2 µL of template DNA, 2.5 U AmpliTaq Gold polymerase (Applied Biosystems, Foster City, CA), 1× AmpliTaq Gold buffer, 2.5 mM MgCl2, 0.25 mM of each dNTP, 0.4 mg/mL bovine serum albumin, 0.4 µM tagged forward primer and 0.4 µM tagged reverse primer. Thermocycling conditions were as follows (16SV4): initial denaturation at 94◦C for 3 min, followed by 33 cycles of denaturation at 94◦C for 45s, annealing at 50◦C for 60s and elongation at 72◦C for 30s, followed by a final elongation at 72◦C for 10 min. The PCR conditions for ITS were as follows: initial denaturation at 95◦C for 5 min, followed by 38 cycles of denaturation at 95◦C for 30s, annealing at 55◦C for 30s and elongation at 72◦C for 60s, followed by a final elongation at 72◦C for 5 min.
Illumina library preparation
After visualisation on a 2% agarose gel, amplicons were mixed at equimolar concentrations in either pools of 13 (for 16SV4) or 19–23 (for ITS1) samples. Concentration was measured using a 2200 TapeStation. PCR negative controls were also added to each of the pooled libraries. As the gel electrophoresis showed no sign of DNA in the extraction negatives, no further work was conducted on them. Amplicon pools were purified using Agencourt AMPure XP (Beckman Coulter, Inc, Brea, California) bead purification, following the manufacturer’s protocol, prior to being converted into Illumina compatible libraries using NEBNext library kit E6070L (New England Biolabs, Ipswich, Massachusetts) and the blunt-ended library adapters originally described by Meyer and Kircher (Citation2010). Each library was PCR indexed with Illumina single index primers, after an initial qPCR to determine the appropriate optimal number of PCR cycles required. The libraries were amplified in 100 μL reactions, with each reaction containing 20 μL of template DNA, 10 U AmpliTaq Gold polymerase (Applied Biosystems, Foster City, CA), 1× AmpliTaq Gold buffer, 2.5 mM MgCl2, 0.2 mM of each dNTP, 0.2 µM IS4 forward primer and 0.2 µM reverse primer with sample specific 6 bp index. The PCR conditions were as follows: initial denaturation at 95°C for 12 min, followed by 12–16 cycles of denaturation at 95°C for 20s, annealing at 60°C for 30s, and elongation at 72°C for 40s, followed by a final elongation at 72°C for 5 min. Following amplification, libraries were purified using Agencourt AMPure XP bead purification, following the manufacturer’s protocol, and eluted in 50 µL of EB buffer (Qiagen, Hilden, Germany). Final concentrations were measured on a QubitTM and on the 2200 TapeStation, and then pooled for sequencing on an Illumina MiSeq platform using 250PE chemistry at the National High-throughput DNA Sequencing Centre at the Natural History Museum of Denmark. Each pool was sequenced over ca. 15% of a MiSeq lane.
Processing sequencing data
Raw paired-end (PE) Illumina MiSeq reads for the 16S rRNA and ITS1 amplicons were treated using largely the same approach with USEARCH (v10.0.240) (Edgar Citation2010). Following merging of PE reads with USEARCH, trimming of sequencing barcodes, adapters and primers was performed with Cutadapt (v1.8.3) (Martin Citation2011) with the requirement that sequences to be trimmed were found in reads with more than two thirds of their length. Merged and trimmed reads were quality filtered with maximum number of expected errors in each read of 0.5. Quality filtered reads were dereplicated and subsequently clustered to Operational Taxonomic Units (OTU) in USEARCH with the -cluster_otus command with default parameters (minimum 97% similarity between OTUs), where chimeras were also filtered. Taxonomic classification of OTUs was performed with SINTAX (Edgar Citation2016) against the SILVA (v123) and UNITE (v7.1 “utax” version) databases for 16S and ITS1 regions, respectively, with -sintax_cutoff option set to 0.8. ITS1 OTUs that were not classified with SINTAX were manually curated for taxonomy using BLASTN (Altschul et al. Citation1990) against the UNITE database (minimum 90% identity threshold). PCR triplicates with less than 400 reads were removed from both datasets prior to statistical analyses. This was the case for four samples in the bacterial dataset which lost one PCR triplicate each during filtering, and for two samples in the fungal dataset which lost two PCR triplicates. One sample lost one PCR triplicate as it contained 95% plant taxa, and was therefore removed from the fungal OTU table. Unclassified and Plantae OTUs were removed prior to construction of the Venn diagrams, which were created using MetaCoMET based on presence or absence of OTUs in the different methods (Wang et al. Citation2016).
Microbial taxonomic composition and statistical analysis
Statistical analyses were performed using R version 3.4.3 (R Core Team Citation2014). Relative abundance plots of the top 20 most abundant taxonomic groups at the phylum and genus level were generated for each method using the RAM package. Alpha diversity measures (Observed, Chao1, Shannon and Simpson) of bacterial and fungal communities were calculated with the R package “phyloseq” (McMurdie and Holmes Citation2013). These alpha diversity estimates were calculated on OTU data that was not subsampled to equal sampling depth, since a potential loss in sensitivity, as discussed elsewhere (McMurdie and Holmes Citation2013) could not be tolerated. Differences in richness and evenness were assessed using Kruskal–Wallis followed by pairwise tests among methods using a Wilcoxon rank-sum test followed by a Benjamini-Hochberg (FDR) correction for multiple testing (Benjamini and Hochberg Citation1995). Pairwise comparisons of microbial communities between each of the methods were assessed with the Metacoder package in R (p-value <0.05) (Foster, Sharpton, and Grünwald Citation2017). The heat trees generated from Metacoder allow for the visualisation of differences between the median proportion of reads for samples from different methods using a Wilcoxon rank-sum test followed by a Benjamini-Hochberg (FDR) correction for multiple testing (Benjamini and Hochberg Citation1995). In order to enable between-sample beta diversity statistics with Bray–Curtis dissimilarity, samples were subsampled randomly to 5000 reads with the USEARCH -otutab_norm function. The degree of dissimilarities in the bacterial and fungal community composition were quantified among the different methods by a principal coordinate analysis (PCoA) with the Bray Curtis dissimilarity matrix using the phyloseq package in R. A permutational multivariate analysis of variance on Bray–Curtis dissimilarities (Anderson Citation2001) (adonis; 4999 permutations), as implemented in the R-package “vegan”, was used to test if there were any significant effects of sample pretreatment on bone bacterial and fungal community structure.
Results
Sequence quality
A total of 496,896 reads were obtained from the 35 bacterial metabarcoding reactions sequenced (and three PCR negative controls). The average number of reads per amplicon was 14,197, ranging between 404 and 76,752 number of reads per sample (S4 Table). The total number of clustered OTUs was 375 (). We also obtained 707,539 reads for the 33 fungal metabarcoding reactions sequences (). The average number of reads per sample was 21,441, ranging from 2379 to 96,799. The total number of clustered OTUs was 67 at 97% identity threshold, however the majority of the OTUs (42) were initially unclassified, and had to be manually assigned (by BLASTN the OTUs against the online UNITE database) to taxonomic classification (14 of the 42 OTUs was successfully classified at 90% identity threshold, S3 Table). Both the PCR negative control and extraction blank showed no products on the TapeStation, and DNA concentrations were below the Qubit detection limits. The PCR negative controls yielded no reads.
Table 1. Sequencing results. The bacterial / fungal number of merged and quality filtered reads, number of samples and number OTUs per different method and as total for all methods are listed in the table. Some OTUs are present in more than one method. The number of OTUs stated for “All method” are the total no. of unique OTUs.
The different treatments tested were as follows: “raw” bone powder, which excluded the EDTA pre-digestion, “total” which contained bone digested with EDTA, “pellet” was treated with EDTA but the EDTA fraction was removed and “EDTA” which contained the EDTA leftover from the “pellet.”
Bone bacterial communities
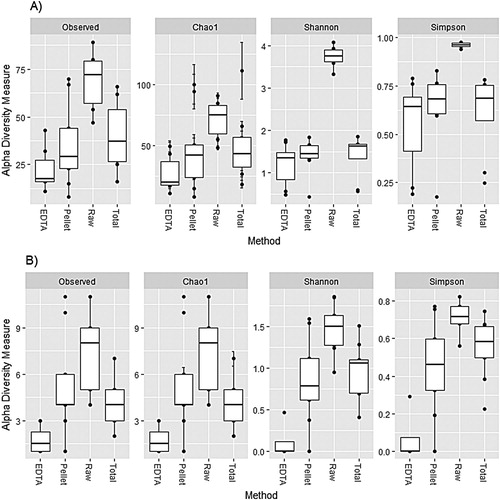
Taxonomical composition of the bacterial community at the phylum and genus levels was consistent across the replicate extractions, and triplicate PCRs per extract, for the “total” (ZM4.1-3; ZM5.1-3; ZM6.2-3) and “raw” methods (ZM1.2-3; ZM2.2-3; ZM3.2-3) (S1a and S1b Figures). The rarefaction curves (S3a and S3b Figures) showed that the number of reads obtained from each of the samples covered most of the bacterial community diversity within each of the methods, despite the lower number of reads obtained for “raw”. Overall, alpha diversity was significantly higher in “raw” compared to all of the three methods using EDTA digestion for both richness (observed and Chao1 all FDR < 0.05; a) and evenness (Shannon and Simpson all FDR < 0.05; a). “EDTA” showed the largest within-method variation in both Shannon and Simpson evenness measures.
Figure 2. Alpha diversity of the a) bacterial 16SV4 region and b) fungal ITS region of the four methods (non-normalized and minimum cut-off of 400 reads).
The “raw” method showed the greatest number of bacterial differences at all taxonomic levels when compared to each of the other three methods that incorporated an EDTA predigestion (top row in a). In comparison, all three methods using EDTA predigestion had few differences among bacterial community composition (a).
Figure 3. Heat trees showing the pairwise comparisons of a) bacterial and b) fungal communities between the different methods of extracting microbes in bone. The gray tree on the lower left functions as a key for the smaller unlabelled trees. The colour of each taxon represents the log-2 ratio of median proportions of reads observed for each extraction method. Only differentially abundant taxa are coloured, determined using a Wilcoxon rank-sum test followed by a Benjamini-Hochberg (FDR) correction for multiple comparisons. Taxa coloured green are enriched in the method shown in the row and those coloured brown are enriched in the methods shown in the column.
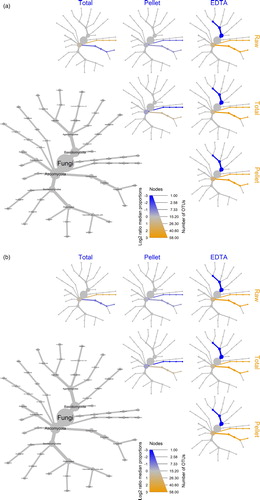
At the phylum level, the bacterial community was dominated by Firmicutes in all methods using EDTA predigestion, with the exception of one sample in the “pellet” method, and four samples in the “EDTA” method, where Proteobacteria and Bacteroidetes dominated (a and S1a Fig.). Pairwise comparisons between each of the three EDTA predigestion methods showed relatively few differences at the phylum level; Proteobacteria were more abundant in method “EDTA” whereas, “pellet” and “total” methods showed more Actinobacteria (a). The taxonomic composition of the extractions that were performed directly on the bone powder (“raw”), were strikingly different from those that included an EDTA predigestion, in which Proteobacteria, Actinobacteria and Bacteroidetes composed a large proportion of the phyla (a and S1a Fig). Pairwise method comparisons confirmed that the “raw” method was more abundant in the above three phyla compare to the EDTA predigestion treatments, which were themselves consistently and significantly more abundant in Firmicutes (a).
At the genus level, the most abundant taxa were Paenibacillus and Psychrobacillus within method “pellet”, whereas Bacillus and Aneurinibacillus were the most abundant among samples within the “total” method (S1b Fig). Pairwise comparisons between each of the three methods using EDTA predigestion showed that “pellet” and “total” had higher overall proportions of Paenibacillus and Psychrobacillus than method “EDTA” (a). Additionally, Micromonospora was higher within method “pellet” than all other methods, whereas Cohnella and Bacillus were more abundant in method “total” (a). The “raw” method samples had over 50% of unclassified taxa below the family level, otherwise Streptosporangium was the most dominant genus.
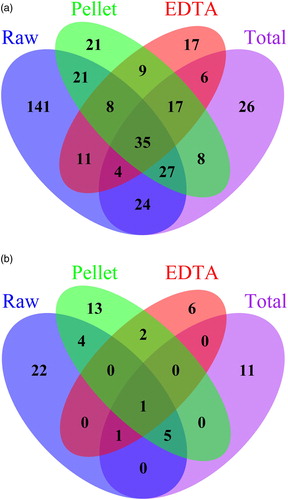
The Venn diagram (a) supports the statistical data in showing that “raw” contains the highest number of unique OTUs (141 OTUs, 37.6%), whereas “total” has 26 unique OTUs (6.9%), “pellet” has 21 (5.6%) and “EDTA” has 17 (4.5%). It is worth noting however that only 35 of the 375 OTUs were shared between the methods. Furthermore, only 17 OTUs (4.5%) were shared between the three methods using EDTA digestion (“pellet”, “EDTA”, “total”).
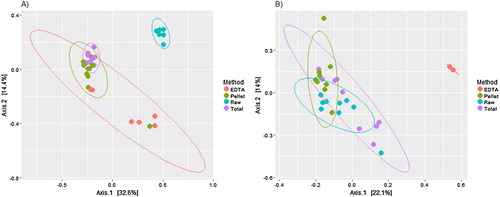
The different methods had a significant effect on the bacterial community structure (adonis; p = 0.001). The Bray–Curtis PCoA plot showed three distinct clusters, which were confirmed with a gap statistical analyses (a). The majority of the samples from methods “EDTA”, “pellet” and “total” clustered together, with the exception of the four “EDTA” and one “pellet” sample that were identified to have differential taxonomic abundance above. All of the samples from the “raw” method clustered tightly together without any overlap with samples from other methods.
Bone fungal community
The rarefaction curve showed that the number of reads obtained from each of the samples covered most of the fungal community diversity within each of the methods. Overall, alpha diversity was significantly higher in the “raw” compared to the other three methods for richness (observed and Chao1 all FDR < 0.05; b) and evenness (Shannon and Simpson all FDR < 0.05; b), and the “EDTA” method had significantly lower richness (observed and Chao1 all FDR < 0.05; b) and evenness (Shannon and Simpson all FDR < 0.05; b) in comparison to all other methods. The “pellet” method showed the largest within method variation in all alpha diversity measures (b).
At the phylum level, the fungal community was largely dominated by Ascomycota in all methods (S2a Fig), with the exception of two of the “EDTA” samples, which were dominated by Basidiomycota. Pairwise method comparisons confirmed that “EDTA” samples had more Basidiomycota and fewer Ascomycota when compared to the other three methods (b). Taxonomically, there were no obvious differences identified among “raw”, “total” and “pellet” methods at the phylum level (b).
At genus level the most abundant genera were Pseudeurotium and Aspergillus in all of the methods except “EDTA” (S2b Figure). Within the “EDTA” method, each sample was dominated by a different genus which, collectively, were not present in any of the other methods. Similar to the bacterial dataset, the “raw” method showed the highest abundance of unclassified fungal groups.
The Venn diagram (b) supports the statistical data showing that “EDTA” is the method that shares the fewest OTUs with any of the other methods. Again it is worth noting that the number of shared OTUs among methods are one OTU out of the total 76 OTUs. This means that less than 2% of the total amount of OTUs are shared between the methods. No OTUs were shared between the three methods using EDTA predigestion (“pellet”, “EDTA”, “total”).
Figure 4. Venn diagram showing the shared and method specific OTUs for the a) bacterial and b) fungal communities.
The different methods had a significant effect on the fungal community structure (adonis; p = 0.001). The Bray–Curtis PCoA plot showed that “EDTA” formed a tight cluster that was separate from the other three methods, and was responsible for most of the variation along the first principal coordinate axis (b). Samples from the “pellet”, “total” and “raw” methods had overlapping clusters (b), corroborating the results from the differential abundance analysis visualised in the heat trees (b).
Figure 5. PCoA plot based on Bray-Curtis dissimilarities of the rarefied and log+1 transformed a) bacterial 16SV4 region and b) fungal ITS region.
Discussion
The principal aim of this study was to compare the effect of four different approaches for extracting DNA from archaeological bone remains, on the resulting microbial metabarcoding community profile recovered. Specifically, we aimed to examine the degree to which the relative abundance and diversity of the microbes changed according to each method, and not what the biological relevance was of the microbes recovered. In this regard, we draw the reader’s attention to the findings of several key previous studies in the efficacy of methods for profiling microbial communities from both modern and ancient materials (Eisenhofer et al. Citation2019; Salter et al. Citation2014; Ziesemer et al. Citation2015). And in particular that should biologically meaningful information be required, then as long as suitable reference databases are available to compare against, shotgun metagenomics approaches are likely less inherently biased, thus more likely to provide accurate community reconstructions. PCR based amplification methods are also in general limited by the design of the primers which in this case are not able to amplify fragments shorter than the amplicon length (here ca 290 bp for bacteria and ca 350 bp for fungal), and thus any very degraded or fragmented DNA will not have been PCR amplified and sequenced. We also note that the bead-beating step used in all extractions, while shown in previous studies to give a more accurate representation of the microbial community (Santos et al. Citation2017; Teng et al. Citation2018), could fragment the DNA in the samples. However as it was used in all methods tested, its effect should be equal in all cases.
Nevertheless, although our data was based on metabarcoding, it does not change the fact that major differences were observed, and thus support the key point that there is a large effect of methods on the OTUs recovered. Specifically, overall our findings showed that there was a large difference in the microbial community composition when using different approaches prior to microbial DNA extraction of bone material. In the bacterial dataset we observed that when samples were not subjected to an initial EDTA digestion (“raw” method) - and to a lesser extent when only the supernatant was extracted after EDTA digestion (“EDTA” method) - the largest difference from the other methods was shown. In the fungal dataset we saw the largest difference from the other methods when only the supernatant was extracted after EDTA digestion (“EDTA” method).
The bacterial community
With regards to the bacterial community data, it was notable that when the bone was not initially predigested with EDTA to dissolve its inorganic component (“raw”), its community structure was most diverse. However given that the majority (>50%) of this diverse community could not successfully be classified, and was significantly different from the taxa found using the other methods, it seems that most of this community comprises of taxa that are rare. Although there is a higher overall diversity and consistency in the PCR triplicates using the raw method, the dominating bacterial phyla (Figure S1a) found have previously been associated with environmental contaminants such as soil (Margesin et al. Citation2017; Zaremba-Niedzwiedzka and Andersson Citation2013). Furthermore, given that quantitative real-time PCR analysis of the extracts indicated that the “raw” extracts contained up to 1000-fold less bacterial DNA than in the extracts from the three EDTA based methods (data not shown), we speculate that their signal is subsequently lost among the flood of more common microbial taxa recovered when fully digesting the bone with EDTA, hence why their overall diversity appears lower.
Our findings show very little overlap of OTUs between the different methods. However, when observing the taxonomic variation among the three methods using EDTA digestion, we do not see any significant differences, and they cluster together on the PCoA plot. The difference between the pre-digestion methods seen in both the microbial community (4.5% shared OTUs) and the fungal community (no shared OTUs) could also be explained by the findings of an earlier study by Campos et al. (Citation2012), which argues that the pellet formed after treatment with EDTA mainly consists of the organic part of the bone (collagen), whereas the EDTA soluble supernatant contains the hydroxyapatite. Given that the principal difference between the three EDTA related methods was whether the EDTA and pellet fractions were kept separate or recombined, the observed differences may simply relate to the microbes in the inorganic vs organic components of the bone. Again we speculate whether filtering the supernatant through the Amicon filters may wash away some DNA that is therefore not added back to the “total” method, nor retained in the “EDTA” method. This could explain the lack of OTU overlap found between methods in both the bacterial and fungal dataset.
However, in this regard, a natural intuition would be that as the “total” method tested combines both the EDTA and pellet fraction, this should encompass the variation seen within the two separate pellet and EDTA fractions, which appears not the case. In our study we speculate again that perhaps the observed diversity differences are driven by rare microbial taxa, that simply vary in location throughout the bone, whereas those most common drive the overall clustering of the three EDTA related methods. It could also be that the very low amount of DNA obtained in all of the extractions from all four methods is limiting the detection of diversity and not the diversity itself.
The four most common bacterial phyla found were Firmicutes, Proteobacteria, Actinobacteria and Bacteroidetes. McIntyre et al. (Citation2017) observed in their study that there seemed to be a sequencing bias towards Firmicutes, Proteobacteria and Actinobacteria most likely because they are better represented in databases than others. However other studies have found that Firmicutes and Bacteroidetes are the dominating phyla related to degradation of bones together with Proteobacteria and Actinobacteria (Damann and Jans Citation2017). Metcalf et al. (Citation2013) also found Firmicutes dominated the initial bacterial community associated with degrading mouse cadavers, however the study focussed on soft tissue decomposition and not bone material. Actinobacteria are also known to be present in sediments where they play a crucial role in the degradation of biomaterials (Goodfellow and Williams Citation1983; Margesin et al. Citation2017). That we find these phyla in our bone sample is therefore not surprising. However, as we are unaware of any genetic studies on the bacterial communities that naturally inhabit bones stored in museum facilities, we cannot rule out that they derive from this environment. Although we feel this is unlikely given that the water content of museum bones is low, which is hardly conducive to bacterial growth. It could also be argued that some of the main bacterial genus we observe in our treatments are derived from contamination as e.g. Paenibacillus is observed in three out of four methods are a known laboratory contaminant (Eisenhofer et al. Citation2019). As we only included an extraction blank after the EDTA pre-digestion step we cannot completely rule out that this is the case. However, in this regard, we wish to highlight that if it indeed is a lab contaminant, then it would be expected to show up in all treatments as the extraction kit used was from the same batch and the extractions was carried out on the same day. Also we did not observe any contamination in our extraction blank both right after extraction (Qubit) and after PCR amplification (gel visualisation).
Whether these four different approaches give the correct picture of what is actually present in the bone of bacterial and fungal DNA could therefore be debated. However, as a predigestion step is often used in studies that aim to examine the microbial community in bone using EDTA (Barnes and Thomas Citation2006; Der Sarkissian et al. Citation2014), exploring the effect of these pretreatment methods is clearly relevant.
The fungal community
In general, the fungal dataset had a very low level of OTUs (67) compared to the bacterial dataset (375). This could simply be due to a less diverse bone fungal community, however the lack of taxonomic diversity in the comparative databases could also lead to an underestimation of the fungal taxonomical identification. The fungal dataset show very few overlapping OTUs (<2%) (b) between the different methods, but there were still taxonomic similarities (excl. “EDTA”) (b and b) among the methods. This low level of overlap is probably due to the very low number of fungi in the samples. The most abundant fungal genera we found in the three methods “raw”, “pellet” and “total” were Aspergillus and Pseudeurotium. Aspergillus is a very diverse genus with over 250 species, which contains both pathogenic species, responsible for human and plant death, and species used in the food industry (Gibbons and Rokas Citation2013). However species of the genus Aspergillus are also known to contain collagenase producing fungi (Wanderly et al. Citation2017; Yakovleva, Khoang, and Nikitina Citation2006) which could be responsible for degradation of the collagen in the bone material. However, very little research has been published on the genetics of bone degrading fungi. The most abundant fungus genus found in the “EDTA” method were either yeast (cyberlindnera) (Kurtzman and Robnett Citation2013), pathogenic (Sarocladium) (Giraldo et al. Citation2015) or mushrooms (Clitocybe and Schizophyllum). This reflects the low resolution of the amplified ITS region and the fungal database used for taxonomic assignment. These genera that were present in the “EDTA” method were not present in any of the other methods. It could be speculated that the fungi present in the bone material will not be extracted when only using the supernatant as the rather large and heavy fungal cells will be spun down, and not incorporated in the further analysis. It could also be that the fungus we find in the supernatant is contamination in the EDTA solution and the reason we do not apply it in the other methods using EDTA is because it is in such low abundance it is overwhelmed by the bone fungus present in the pellet fraction.
Numerous studies have compared the efficacy of different DNA extraction kits in profiling microbial communities from different sample types (e.g. soil or saliva), and variations in the extracted communities are commonly reported between methods tested (Fredricks, Smith, and Meier Citation2005; Lazarevic et al. Citation2013; Leff et al. Citation1995; Santos et al. Citation2015; Vesty et al. Citation2017). Indeed, biases towards specific phyla are even reported when using different cell lysis methods (Lazarevic et al. Citation2013). In our data we observe variation within a single method (a,b) and not just between methods. This could be due to the nonhomogeneous structure of the bone material itself, as other studies have shown a large variation in endogenous DNA yields between not only different skeletal parts (Mundorff and Davoren Citation2014), but also within the same bone (Pinhasi et al. Citation2015). It could also be due to the already mentioned low amounts of input DNA in the PCR reactions, which have been shown to have a significant impact on the sample profile (Kennedy et al. Citation2014). Contamination from the extraction kit, PCR reagents, laboratory equipment etc. can be an issue in low biomass microbial studies (Stinson, Keelan, and Payne Citation2018). However in our study both the extraction blank and the PCR blanks did not amplify, and the PCR blanks yielded no reads after sequencing. Although it would benefit the experiment to apply the different extraction approaches to a larger number of samples, our results still show that care should be taken when extracting microbial DNA from bones and the need to be consistent in whichever method chosen prior microbial DNA extraction. It also shows the importance of communicating which method that has been used in the study for other researchers to be able to compare results.
Conclusion
Overall, we found little overlap in the number of OTUs between the four different methods for both bacterial and fungal data. Fewer than 10% of the bacterial and 2% of the fungal OTUs were shared between the four different methods. The lack of shared OTUs among different molecular methods highlights the challenges and sensitivities of microbiome research.
Which method to choose depends on the research question asked. In a case where one wishes to obtain an overview of the microbial community present on a bone, disregarding a predigestion could be recommended. However to get full representation of the microbial community within the bone, whether the microbes associated with diagenesis or pathogens present in the animal’s blood system prior to death, then using the method where predigestion is used and both the supernatant and the pellet are extracted together could be recommended for both the fungal and bacterial communities. We do not recommend only using the supernatant after the predigestion step, prior to subsequent extraction of the bone material, as the fungal community showed very little overlap with the other methods as well as very little taxonomic diversity.
In this study, although the lowest amount of technical variability was observed in both the raw and total methods, the total method recovered microbes most relevant to diagenesis of mineralised tissue, and thus ultimately may prove to be the most suitable treatment of bone prior to DNA extraction for studies aiming to characterise the microbial community – something that we hope future studies may be able to explore in detail.
Acknowledgement
The authors would like to thank colleagues Sarah Mak, Kristine Bohmann, Katharina Fietz, Martin Nielsen, Christian Carøe and Shyam Gopalakrishnan from the EvoGenomics group at the GLOBE institute, University of Copenhagen, as well as two anonymous reviewers for very helpful guidance. We would also like to thank Conservator Kristian Murphy Gregersen from the Natural History Museum of Denmark for providing the cow humerus used in the experiment, and Henning Matthiesen, National Museum of Denmark for useful comments on the manuscript. This work was supported by the Danish Council for Independent Research under grant DFF –4090-00037.
Data availability statement
The data that support the findings of this study are openly available after publication of the paper.
Disclosure statement
No potential conflict of interest was reported by the author(s).
Notes on contributors
Anne Marie Høier Eriksen is a Post Doc at the National Museum of Denmark and holds a PhD from the University of Copenhagen’s GLOBE Institute. Her research interests focus on the degradation processes associated with organic materials (e.g. bone and wood) in the marine environment, where she uses molecular approaches to studying the microbial community associated with diagenesis.
Lara Puetz is a PhD student at the University of Copenhagen’s GLOBE Institure who uses metagenomic tools to compare the microbiomes of different animal gut datasets in order to look at how community difference may affect phoenotypes of the host.
Carolina Rocha has a Bachelor in Agro-Genomic Sciences from The National Autonomous University of Mexico. Since she finished her bachelor thesis she has been working on microbiome projects, with a focus on microorganism especially pathogens. Currently she is studying pathogens from ancient individuals. In the future, she would like to study pathogens in modern individuals and study pathogen evolution.
Tue K. Nielsen is a post doc at the University of Copenhagen, Dep. of Plant and Environmental Sciences, Microbial Ecology and Biotechnology. He has experience with molecular microbial methods including high-throughput sequencing on 2nd- and 3rd-generation platforms, bioinformatics, and statistics. He has previously worked extensively with microbial community analysis using targeted amplicon sequencing, transcriptomics, and metagenomics. Furthermore, he has experience in working with comparative genomics of microbial genomes.
Lars H. Hansen is a professor at the University of Copenhagen, Dep. of Plant and Environmental Sciences, Microbial Ecology and Biotechnology. He uses molecular approaches to investigate complex questions in microbial ecology in both fundamental and applied sciences. His main fields of research include how bacteria perceive their environment, and change accordingly, via transfer and of bacterial plasmids as well as plasmid evolution in the context of bacterial resistance to antibiotics. In the past years, 2nd and 3rd generation DNA sequencing has become a favourite tool for investigating bacterial, bacteriophage and plasmid diversity in research related to the environment and bacteriophage-host interactions. His long-term experience in microbial sequencing projects has resulted in co-authoring more than 75 peer-reviewed publications on microbial sequencing in the last 5 years.
M. Thomas P. Gilbert is a professor at the University of Copenhagen’s GLOBE Institute. He principally applies ancient DNA methodologies to explore questions spanning evolution, ecology, archaeology and anthropology, but also in the context of degradation to both natural materials and the DNA that is within them. He additionally has an interest in environmental DNA studies, for use in both biomonitoring but also ecosystem reconstruction.
Additional information
Funding
References
- Altschul, S. F., W. Gish, W. Miller, E. W. Meyers, and D. J. Lipman. 1990. “Basic Local Alignment Search Tool.” Journal of Molecular Biology 215 (3): 403–410. doi:10.1016/S0022-2836(05)80360-2.
- Anderson, M. J. 2001. “A new Method for Non-Parametric Multivariate Analysis of Variance.” Austral Ecology 26 (1): 32–46. doi:10.1111/j.1442-9993.2001.01070.
- Barnes, I., and M. G. Thomas. 2006. “Evaluating Bacterial Pathogen DNA Preservation in Museum Osteological Collections.” Proceedings of the Royal Society B 273: 645–653. doi:10.1098/rspb.2005.3339.
- Barta, J. L., C. Monroe, and B. M. Kemp. 2013. “Further Evaluation of the Efficacy of Contamination Removal From Bone Surfaces.” Forensic Science International 231: 340–348. doi:10.1016/j.forsciint.2013.06.004.
- Begerow, D., H. Nilsson, M. Unterseher, and W. Maier. 2010. “Current State and Perspectives of Fungal DNA Barcoding and Rapid Identification Procedures.” Applied Microbiology and Biotechnology 87: 99–108. doi:10.1007/s00253-010-2585-4.
- Bell, L. S. 1990. “Palaeopathology and Diagenesis: an SEM Evaluation of Structural Changes Using Backscattered Electron Imaging.” Journal of Archaeological Science 17: 85–102. doi:10.1016/0305-4403(90)90016-X.
- Bell, L. S., M. F. Skinner, and S. J. Jones. 1996. “The Speed of Post Mortem Change to the Human Skeleton and its Taphonomic Significance.” Forensic Science International 82 (2): 129–140.
- Benjamini, Y., and Y. Hochberg. 1995. “Controlling the False Discovery Rate: a Practical and Powerful Approach to Multiple Testing.” Journal of the Royal Statistical Society. Series (Methodological) 57 (1): 289–300.
- Binladen, J., J. A. Gilbert, J. P. Bollback, F. Panitz, C. Bendixen, R. Nielsen, and E. Willerslev. 2007. “The use of Coded PCR Primers Enables High-Throughput Sequencing of Multiple Homolog Amplification Products by 454 Parallel Sequencing.” PlosOne 2 (2): e197. doi:10.1371/journal.pone.0000197.
- Campos, P. F., O. Craig, G. Turner-Walker, E. E. Peacock, E. Willerslev, and M. T. P. Gilbert. 2012. “DNA in Ancient Bone - Where is it Located and how Should we Extract it?” Annals of Anatomy 194: 7–16. doi:10.1016/j.aanat.2011.07.003.
- Caporaso, J. G., C. L. Lauber, W. A. Walters, D. Berg-Lyons, C. A. Lozupone, P. J. Turnbaugh, N. Fierer, and R. Knight. 2011. “Global Patterns of 16S rRNA Diversity at a Depth of Millions of Sequences per Sample.” Proceedings of the National Academy of Sciences 108: 4516–4522. doi:10.1073/pnas.1000080107.
- Child, A. M. 1995. “Microbial Taphonomy of Archaeological Bone.” Studies in Conservation 40 (1): 19–30. doi:10.2307/1506608.
- Damann, F. E., and M. M. E. Jans. 2017. “Microbes, Anthropology and Bones.” In Forensic Microbiology, edited by D. O. Carter, J. K. Tomberlin, M. E. Benbow, and J. L. Metcalf, 312–327. West Sussex: John Wiley & Sons Ltd.
- Damann, F. E., D. E. Williams, and A. C. Layton. 2015. “Potential use of Bacterial Community Succession in Decaying Human Bone for Estimating Postmortem Interval.” Journal of Forensic Sciences 60: 844–850. doi:10.1111/1556-4029.12744.
- Damgaard, P. B., A. Margaryan, H. Schroeder, L. Orlando, E. Willerslev, and M. E. Allentoft. 2015. “Improving Access to Endogenous DNA in Ancient Bones and Teeth.” Nature 5 (11184): 1–12. doi:10.1038/srep11184.
- Der Sarkissian, C., L. Ermini, H. Jonsson, A. N. Alekseev, E. Crubezy, B. Shapiro, and L. Orlando. 2014. “Shotgun Microbial Profiling of Fossil Remains.” Molecular Ecology 23: 1780–1798. doi:10.1111/mec.12690.
- Edgar, R. C. 2010. “Search and Clustering Orders of Magnitude Faster Than BLAST.” Bioinformatics Applications Note 26 (19): 2460–2461. doi:10.1093/bioinformatics/btq461.
- Edgar, R. C. 2016. “SINTAX: a Simple non-Bayesian Taxonomy Classifier for 16S and ITS Sequences.” bioRxiv, doi:10.1101/074161.
- Eisenhofer, R., J. J. Minich, C. Marotz, A. Cooper, R. Knight, and L. S. Weyrich. 2019. “Contamination in Low Microbial Biomass Microbiome Studies: Issues and Recommendations.” Trends in Microbiology 27: 105–117. doi:10.1016/j.tim.2018.11.003.
- Foster, Z. S. L., T. J. Sharpton, and N. J. Grünwald. 2017. “Metacoder: An R Package for Visualization and Minipulation of Community Taxonomic Diversity Data.” PlosOne 13 (2): 1–15. doi:10.5281/zenodo.158228.
- Fredricks, D. N., C. Smith, and A. Meier. 2005. “Comparison of six DNA Extraction Methods for Recovery of Fungal DNA as Assessed by Quantitative PCR.” Journal of Clinical Microbiology 43 (10): 5122–5128. doi:10.1128/JCM.43.10.5122–5128.2005.
- Garcia-Donas, J. G., A. Dalton, I. Chaplin, and E. F. Kranioti. 2017. “A Revised Method for the Preparation of dry Bone Samples Used in Histological Examination: Five Simple Steps.” HOMO - Journal of Comparative Human Biology 68 (4): 283–288. doi:10.1016/j.jchb.2017.07.001.
- Gibbons, J. G., and A. Rokas. 2013. “The Function and Evolution of the Aspergillus Genome.” Trends in Microbiology 21 (1): 14–22. doi:10.1016/j.tim.2012.09.005.
- Gilbert, J. A., J. K. Jansson, and R. Knight. 2014. “The Earth Microbiome Project: Successes and Aspirations.” BMC Biology 12 (69): 1–4. doi:10.1186/s12915-014-0069-1.
- Giraldo, A., J. Gené, A. Sutton, H. Madrid, G. S. de Hoog, J. Cano, C. Decock, P. W. Corous, and J. Guarro. 2015. “Phylogeny of Sarocladium (Hypocreales).” Persoonia - Molecular Phylogeny and Evolution of Fungi 34: 10–24. doi:10.3767/003158515X685364.
- Goodfellow, M., and S. T. Williams. 1983. “Ecology of Actinomycetes.” Annual Review of Microbiology 37: 189–216. doi:10.1146/annurev.mi.37.100183.001201.
- Grif, K., I. Heller, W. M. Prodinger, K. Lechleitner, C. Lass-Flörl, and D. Orth. 2012. “Improvement of Detection of Bacterial Pathogens in Normally Sterile Body Sites with a Focus on Orthopedic Samples by use of a Commercial 16S rRNA Broad-Range PCR and Sequence Analysis.” Journal of Clinical Microbiology 50 (7): 2250–2254. doi:doi:10.1128/JCM.00362-12.
- Hackett, C. J. 1981. “Microscopical Focal Destruction (Tunnels) in ex-Humed Human Bones.” Medicine Science and Law 21 (4): 243–265. doi:10.1177/002580248102100403.
- Handke, J., N. Procopio, M. Buckley, D. van der Meer, G. Williams, M. Carr, and A. Williams. 2017. “Successive Bacterial Colonisation of Pork and its Implications for Forensic Investigations.” Forensic Science International 281: 1–8. doi:10.1016/j.forsciint.2017.10.025.
- Hedges, R. E. M. 2002. “Bone Diagenesis: an Overview of Processes.” Archaeometry 44 (3): 319–328.
- Hollund, H. I., M. M. E. Jans, M. Collins, H. Kars, I. Joosten, and S. M. Kars. 2012. “What Happened Here? Bone Histology as a Tool in Decoding the Postmortem Histories of Archaeological Bone From Castricum, the Netherlands.” International Journal of Osteoarchaeology 22: 537–548. doi:10.1002/oa.1273.
- Ihrmark, Katarina, Inga T.M. Bödeker, Karelyn Cruz-Martinez, Hanna Friberg, Ariana Kubartova, Jessica Schenck, Ylva Strid, et al. 2012. “New Primers to Amplify the Fungal ITS2 Region - Evaluation by 454-Sequencing of Artificial and Natural Communities.” FEMS Microbiol Ecology 82: 666–677. doi:10.1111/j.1574-6941.2012.01437.x.
- Kajiya, M., G. Giro, M. A. Taubman, X. Han, M. P. A. Mayer, and T. Kawai. 2010. “Role of Periodontal Pathogenic Bacteria in RANKL-Mediated Bone Destruction in Periodontal Disease.” Journal of Oral Microbiology 2 (1): 5532. doi:10.3402/jom.v2i0.5532.
- Kalmar, T., C. Z. Bachrati, A. Marcsik, and I. Rasko. 2000. “A Simple and Efficient Method for PCR Amplifiable DNA Extraction From Ancient Bones.” Nucleic Acids Research 28 (12): 67e–667.
- Keenan, S. W., and A. S. Engel. 2017. “Reconstructing Diagenetic Conditions of Bone at the Gray Fossil Site, Tennessee, USA.” Palaeogeography, Palaeoclimatology, Palaeoecology 471: 48–57. doi:10.1016/j.palaeo.2017.01.037.
- Kendall, C., A. M. H. Eriksen, I. Kontopoulos, M. Collins, and G. Turner-Walker. 2018. “Diagenesis of Archaeological Bone and Tooth.” Palaeogeography, Palaeoclimatology, Palaeoecology 491: 21–37. doi:10.1016/j.palaeo.2017.11.041.
- Kennedy, K., M. W. Hall, M. D. J. Lynch, G. Moreno-Hagelsieb, and J. D. Neufeld. 2014. “Evaluating Bias of Illumina-Based Bacterial 16S rRNA Gene Profiles.” Applied and Environmental Microbiology 80 (18): 5717–5722. doi:10.1128/AEM.01451-14.
- Kurtzman, C. P., and C. J. Robnett. 2013. “Relationships among Genera of Saccharomycotina (Ascomycota) From Multigene Phylogenetic Analysis of Type Species.” FEMS Yeast Research 13 (1): 23–33. doi:10.1111/1567-1364.12006.
- Kuske, C. R., K. L. Banton, D. L. Adorada, P. C. Stark, K. K. Hill, and P. J. Jackson. 1998. “Small-scale DNA Sample Preparation Method for Field PCR Detection of Microbial Cells and Spores in Soil.” Applied and Environmental Microbiology 64 (7): 2463–2472.
- Lazarevic, V., N. Gaia, M. Girard, P. Francois, and J. Schrenzel. 2013. “Comparison of DNA Extraction Methods in Analysis of Salivary Bacterial Communities.” PlosOne 8 (7): e67699. doi:10.1371/journal.pone.0067699.
- Leff, L. G., J. R. Dana, J. V. McArthur, and L. J. Shimkets. 1995. “Comparison of Methods of DNA Extraction From Stream Sediments.” Applied and Environmental Microbiology 61 (3): 1141–1143.
- Le Garff, E., V. Mesli, E. Marchand, H. Behal, X. Demondion, A. Becart, and V. Hedouin. 2017. “Is Bone Analysis with uCT Useful for Short Postmortem Interval Estimation?” International Journal of Legal Medicin 132 (1): 269–277. doi:10.1007/s00414-017-1696-1.
- Lever, M. A., A. Torti, P. Eickenbusch, A. B. Michaud, T. Santl-Temkiv, and B. B. Jørgensen. 2015. “A Modular Method for the Extraction of DNA and RNA, and the Separation of DNA Pools From Diverse Environmental Sample Types.” Frontiers in Microbiology 6 (476): 1–24. doi:10.3389/fmicb.2015.00476.
- Lopez-Costas, O., O. Lantes-Suarez, and A. M. Cortizas. 2016. “Chemical Compositional Changes in Archaeological Human Bones due to Diagenesis: Tpe of Bone vs Soil Environment.” Journal of Archaeological Science 67: 43–51. doi:10.1016/j.jas.2016.02.001.
- Margaryan, Ashot, Henrik B. Hansen, Simon Rasmussen, Martin Sikora, Vyacheslav Moiseyev, Alexandr Khoklov, Andrey Epimakhov, et al. 2018. “Ancient Pathogen DNA in Human Teeth and Petrous Bones.” Ecology and Evolution 8 (6): 3534–3542. doi:10.1002/ece3.3924.
- Margesin, R., J. A. Siles, T. Cajthaml, B. Ohlinger, and E. Kistler. 2017. “Microbial Meets Archaeology: Soil Microbial Communities Reveal Different Human Acticities at Archaic Monte Iato (Sixth Century BC).” Microbial Ecology 73 (4): 925–938. doi:10.1007/s00248-016-0904-8.
- Martin, M. 2011. “Cutadapt Removes Adapter Sequences From High-Throughput Sequencing Reads.” EMBnet.Journal 17 (1): 10–12. doi:10.14806/ej.17.1.200.
- McIntyre, A. B. R., R. Ounit, E. Afshinnekoo, R. J. Prill, E. Hénaff, N. Alexander, S. S. Minot, et al. 2017. “Comprehensive Benchmarking and Ensemble Approaches for Metagenomic Classifiers.” Genome Biology 18 (182): 1–19. doi:10.1186/s13059-017-1299-7.
- McMurdie, P. J., and S. Holmes. 2013. “Phyloseq: An R Package for Reproducible Interactive Analysis and Graphics of Microbiome Census Data.” PlosOne 8 (4): 1–11. doi:10.1371/journal.pone.0061217.
- Metcalf, Jessica L, Laura Wegener Parfrey, Antonio Gonzalez, Christian L Lauber, Dan Knights, Gail Ackermann, Gregory C Humphrey, et al. 2013. “A Microbial Clock Provides an Accurate Estimate of the Postmortem Interval in a Mouse Model System.” eLife 2: e01104. doi:10.7554/eLife.01104.
- Metcalf, J. L., Z. Z. Xu, S. Weiss, S. Lax, W. Van Treuren, E. R. Hyde, S. J. Song, et al. 2015. “Microbial Community Assembly and Metabolic Function During Mammalian Corpse Decomposition.” Science 351 (6269): 158–162. doi:10.1126/science.aad2646.
- Meyer, M., and M. Kircher. 2010. “Illumina Sequencing Library Preparation of Highly Multiplexed Target Capture and Sequencing.” Cold Spring Harbor Protocols 2010 (6): pdb.prot5448–pdb.prot5448. doi:10.1101/pdb.prot5448.
- Morales, N. S., L. Catella, F. Oliva, P. L. Sarmiento, and G. Barrientos. 2017. “A SEM-Based Assessment of Bioerosion in Late Holocene Faunal Bone Assemblages From the Southern Pampas of Argentina.” Journal of Archaeological Science: Reports 18: 782–791. doi:10.1016/j.jasrep.2017.07.012.
- Morales, S. E., and W. E. Holben. 2014. “Simulated Geologic Carbon Storage Leak Reduces Bacterial Richness and Alters Bacterial Community Composition in Surface Soil.” Soil Biology & Biochemistry 76: 286–296. doi:10.1016/j.soilbio.2014.05.018.
- Mundorff, A., and J. M. Davoren. 2014. “Examination of DNA Yield Rates for Different Skeletal Elements at Increasing Post Mortem Intervals.” Forensic Science International: Genetics 8: 55–63. doi:10.1016/j.fsigen.2013.08.001.
- Orlando, L., J. L. Metcalf, M. T. Alberdi, M. Telles-Antunes, D. Bonjean, M. Otte, F. Martin, et al. 2009. “Revising the Recent Evolutionary History of Equids Using Ancient DNA.” Proceedings of the National Academy of Sciences of the United States of America 106 (51): 21754–9. doi:10.1073/pnas.0903672106.
- Pesquero, M. D., L. S. Bell, and Y. Fernandez-Jalvo. 2017. “Skeletal Modification by Microorganisms and Their Environments.” Historical Biology 30 (6): 882–893. doi:10.1080/08912963.2017.1371713.
- Pinhasi, Ron, Daniel Fernandes, Kendra Sirak, Mario Novak, Sarah Connell, Songül Alpaslan-Roodenberg, Fokke Gerritsen, et al. 2015. “Optimal Ancient DNA Yields From the Inner ear Part of the Human Petrous Bone.” PlosOne 10 (6): 1–13. doi:10.1371/journal.pone.0129102.
- Poinar, H. N., C. Schwarz, J. Qi, B. Shapiro, R. D. E. MacPhee, B. Buigues, A. Tikhonov, et al. 2006. “Metagenomics to Paleogenomics: Large-Scale Sequencing of Mammoth DNA.” Science, New Series 311 (5759): 392–394. doi:10.1126/science.1123360.
- Prado, M., C. M. Franco, C. A. Fente, A. Cepeda, B. I. Vazquez, and J. Barros-Velazquez. 2002. “Comparison of Extraction Methods for the Recovery, Amplification and Species-Specific Analysis of DNA From Bone and Bone Meals.” Electrophoresis 23 (7-8): 1005–1012. doi:10.1002/1522-2683(200204)23:7/8 < 1005::AID-ELPS1005 > 3.0.CO;2-1.
- R Core Team. 2014. R: A Language and Environment for Statistical Computing. Vienna: R Foundation for Statistical Computing. http://www.R-project.org/.
- Rohland, N., and M. Hofreiter. 2007. “Ancient DNA Extraction From Bones and Teeth.” Nature Protocol 2 (7): 1756–1762. doi:10.1038/nprot.2007.247.
- Salonen, A., J. Nikkila, J. Jalanka-Tuovinen, O. Immonen, M. Rajilic-Stojanovic, R. A. Kekkonen, A. Palva, and W. M. De Vos. 2010. “Comparative Analysis of Fecal DNA Extraction Methods with Phylogenetic Microarray: Effective Recovery of Bacterial and Archaeal DNA Using Mechanical Cell Lysis.” Journal of Microbiological Methods 81: 127–134. doi:10.1016/j.mimet.2010.02.007.
- Salter, Susannah J, Michael J Cox, Elena M Turek, Szymon T Calus, William O Cookson, Miriam F Moffatt, Paul Turner, Julian Parkhill, Nicholas J Loman, and Alan W Walker. 2014. “Reagent and Laboratory Contamination can Critically Impact Sequence-Based Microbiome Analyses.” BMC Biology 12: 87. doi:10.1186/s12915-014-0087-z.
- Santos, S. S., T. K. Nielsen, L. H. Hansen, and A. Winding. 2015. “Comparison of Three DNA Extraction Methods for Recovery of Soil Protisk DNA.” Journal of Microbiological Methods 115: 13–19. doi:10.1016/j.mimet.2015.05.011.
- Santos, S. S., I. Nunes, T. K. Nielsen, S. Jacquiod, L. H. Hansen, and A. Winding. 2017. “Soil DNA Extraction Procedure Influences Protist 18S rRNA Gene Community Profiling Outcome.” Protist 168 (3): 283–293. doi:10.1016/j.protis.2017.03.002.
- Schoch, C. L., K. A. Seifert, S. Huhndorf, V. Robert, J. L. Spouge, C. A. Leesque, W. Chen, and F. B. Consortium. 2012. “Nuclear Ribosomal Internal Transcribed Spacer (ITS) Region as a Universal DNA Barcode Marker for Fungi.” Proceedings of the National Academy of Sciences 109 (16): 6241–6246. doi:10.1073/pnas.1117018109.
- Siles, J. A., B. Öhlinger, T. Cajthaml, E. Kistler, and R. Margesin. 2018. “Characterization of Soil Bacterial Archaeal and Fungal Communities Inhabiting Archaeological Human-Impacted Layers at Monte Lato Settlement (Sicily, Italy).” Scientific Reports 8 (1903): 1–14. doi:10.1038/s41598-018-20347-8.
- Sinclair, L., O. A. Osman, S. Bertilsson, and A. Eiler. 2014. “Microbial Community Composition and Diversity via 16S rRNA Gene Amplicons: Evaluating the Illumina Platform.” PlosOne 10 (2): 1–18. doi:10.1371/journal.pone.0116955.
- Stinson, L. F., J. A. Keelan, and M. S. Payne. 2018. “Identification and Removal of Contaminating Microbial DNA From PCR Reagents: Impact on low-Biomass Microbiome Analyses.” Letters in Applied Microbiology 68 (1): 2–8. doi:10.1111/lam.13091.
- Taberlet, P., E. Coissac, F. Pompanon, C. Brochmann, and E. Willerslev. 2012. “Towards Next-Generation Biodiversity Assessment Using DNA Metabarcoding.” Molecular Ecology 21 (8): 2045–2050. doi:10.1111/j.1365-294X.2012.05470.x.
- Teng, F., S. S. D. Nair, P. Zhu, S. Li, S. Huang, X. Li, J. Xu, and F. Yang. 2018. “Impact of DNA Extraction Method and Targeted 16S-rRNA Hypervariable Region on Oral Microbiota Profiling.” Nature Scientific Reports 8 (16321): 1–12. doi:10.1038/s41598-018-34294-x.
- Tjelldén, A. K. E. 2016. Death, Decay and Dissolution? The Impact of a Wetland Environment on Archaeological Bone. Aarhus: Aarhus University.
- Tringe, S. G., and P. Hugenholtz. 2008. “A Renaissance for the Pioneering 16S rRNA Gene.” Current Opinion in Microbiology 11 (5): 442–446. doi:10.1016/j.mib.2008.09.011.
- Turner-Walker, G. 2012. “Early Bioerosion in Skeletal Tissues: Persistence Through Deep Time.” Neues Jahrbuck für Geologie und Paläontogie 265 (2): 165–183. doi:10.1127/0077-7749/2012/0253.
- Turner-Walker, G. 2019. “Light at the End of the Tunnels? The Origins of Microbial Bioerosion in Mineralised Collagen.” Palaeogeography, Palaeoclimatology, Palaeoecology 529: 24–38. doi:10.1016/j.palaeo.2019.05.020.
- Vesty, A., K. Biswas, M. W. Taylor, K. Gear, and R. G. Douglas. 2017. “Evaluating the Impact of DNA Extraction Method on the Representation of Human Oral Bacterial and Fungal Communities.” PlosOne 12 (1): 1–13. doi:10.1371/journal.pone.0169877.
- Wanderly, M. C. D. A., J. M. W. D. Neto, J. L. D. L. Filho, C. D. A. Lima, J. A. C. Teixeira, and A. L. F. Porto. 2017. “Collagenolytic Enzymes Produced by Fungi: a Systematic Review.” Brazilian Journal of Microbiology 48: 13–24. doi:10.1016/j.bjm.2016.08.001.
- Wang, Y., L. Xu, Y. Q. Gu, and D. Coleman-Derr. 2016. “MetaCoMET: a web Platform for Discovery and Visualization of the Core Microbiome.” Bioinformatics (oxford, England) 32 (22): 3469–3470. doi:10.1093/bioinformatics/btw507.
- Wedl, C. 1864. “Über Einen im Zahnbein und Knochen Keimenden Pilz.” Akademie der Wissenschaften, Mathematisch-Naturwissenschaftliche Classe, Vienna 50: 171–193.
- Wintzingerode, F. V., U. B. Göbel, and E. Stackebrandt. 1997. “Determination of Microbial Diversity in Environmental Samples: Pitfalls of PCR-Based rRNA Analysis.” FEMS Microbiology Reviews 21 (3): 213–229. doi:10.1111/j.1574-6976.1997.tb00351.x.
- Wunderlin, T., T. Junier, L. Roussel-Delif, N. Jeanneret, and P. Junier. 2013. “Stage 0 Sporulation Gene A as a Molucular Marker to Study Diversity of Endospore-Forming Firmicutes.” Environmental Microbiology Reports 5 (6): 911–924. doi:10.1111/1758-2229.12094.
- Yakovleva, M. B., T. L. Khoang, and Z. K. Nikitina. 2006. “Collagenoytic Activity in Several Species of Deuteromycetes Under Varios Storage Conditions.” Applied Biochemical and Microbiolgy 42 (4): 431–434. doi:10.1134/S000368380604017X.
- Yang, D. Y., B. Eng, J. S. Waye, J. C. Dudar, and S. R. Saunders. 1998. “Technical Note: Improved DNA Extraction from Ancient Bones Using Silica-Based Spin Columns.” American Journal of Physical Anthropology 105 (4): 539–543. doi:10.1002/(SICI)1096-8644(199804)105:4 < 539::AID-AJPA10 > 3.0.CO;2-1.
- Zaremba-Niedzwiedzka, K., and S. G. E. Andersson. 2013. “No Ancient DNA Damage in Actinobacteria From the Neanderthal Bone.” PlosOne 8 (5): e62799. doi:10.1371/journal.pone.0062799.
- Zhou, J., M. A. Bruns, and J. M. Tiedje. 1996. “DNA Recovery from Soils of Diverse Composition.” Applied and Environmental Microbiology 62 (2): 316–322.
- Ziesemer, Kirsten A., Allison E. Mann, Krithivasan Sankaranarayanan, Hannes Schroeder, Andrew T. Ozga, Bernd W. Brandt, Egija Zaura, et al. 2015. “Intrinsic Challenges in Ancient Microbiome Reconstruction Using 16S rRNA Gene Amplification.” Nature Scientific Reports 5 (16498), doi:10.1038/srep16498.