
ABSTRACt
Candida dubliniensis is closely related to Candida albicans, a major causative agent of candidiasis, and is primarily associated with oral colonization and infection in human immunodeficiency virus (HIV)-positive patients. Despite the high similarity of genomic and phenotypic features between the 2 species, C. dubliniensis is much less virulent and less prevalent than C. albicans. The ability to change morphological phenotypes is a striking feature of Candida species and is linked to virulence. In this study, we report a novel phenotype, the gray phenotype, in C. dubliniensis. Together with the previously reported white and opaque cell types, the gray phenotype forms a tristable phenotypic switching system in C. dubliniensis that is similar to the white-gray-opaque tristable switching system in C. albicans. Gray cells of C. dubliniensis are similar to their counterparts in C. albicans in terms of several biological aspects including cellular morphology, mating competence, and genetic regulatory mechanisms. However, the gray phenotypes of the 2 species have some distinguishing features. For example, the secreted aspartyl protease (Sap) activity is induced by bovine serum albumin (BSA) in gray cells of C. albicans, but not in gray cells of C. dubliniensis. Taken together, our results demonstrate that the biological features and regulatory mechanisms of white-gray-opaque tristable transitions are largely conserved in the 2 pathogenic Candida species.
Introduction
Candida species are the most common agents of fungal infections in humans. Among them, Candida albicans is the best studied and most prevalent pathogen.Citation1-5 Candida dubliniensis, which was identified as a new species in 1995, is closely related to C. albicans.Citation6-8 The two species share many phenotypic characteristics, including the development of true hyphae and chlamydospores.Citation6,9 The genome sequences of these 2 species are highly similar and the gene order is largely collinear.Citation10 However, C. dubliniensis is much less pathogenic and prevalent than C. albicans.Citation3,11,12 Epidemiological studies indicate that C. dubliniensis is primarily associated with human immunodeficiency virus (HIV)-infected patients.Citation6-9 A number of comparative genomic and phenotypic studies of C. albicans and C. dubliniensis have been performed in the previous 2 decades,Citation12-15 but what underlying mechanisms or biological characteristics underlying the differences between the 2 species in epidemiology, virulence, and the ability to develop antifungal resistance remain to be investigated.
A striking feature of the biology of C. albicans is its phenotypic plasticity: the ability to grow in several morphological forms.Citation4,16,17 This ability is important for the fungus to rapidly adapt to the changing host environment and cause infections. White-opaque switching in C. albicans has been intensively investigated in the previous decade.Citation18-21 White and opaque cells are 2 distinct and heritable cell types that differ in cellular morphologies, global gene expression profiles, susceptibility to host immune cells, and mating competency. White cells are round and relatively small, while opaque cells are elongated and large. The cell wall surface of white cells is smooth, whereas that of opaque cells is pimpled.Citation22 White cells are more virulent in systemic infections, while opaque cells have an enhanced ability to cause cutaneous damage due to high activity levels of secreted aspartyl proteases (Saps).Citation23-25 In addition, opaque cells mate much more efficiently than white cells. Therefore, to mate, white cells must first switch to the opaque cell type.Citation26 Recently, we reported a novel cell type, the gray phenotype, in C. albicans.Citation25 Gray cells are elongated but smaller than white and opaque cells. Similar to the white and opaque cell types, gray cells are also heritable. The three cell types (white, gray, and opaque) form a tristable phenotypic switching system. The appearances of colonies formed by the 3 cell types are distinct on nutrient agar plates. On solid medium plates containing phloxine B, a red dye, white cells form white and shiny colonies and gray cells form light pink colonies, while opaque cells form “opaque” and red colonies. Gray cells of C. albicans are more virulent than white and opaque cells in models of ex vivo tongue infections and exhibit an intermediate level of mating competency. Many studies have demonstrated that different cell types evolved to adapt to different host niches.Citation21,25,27
In the present study, we report the discovery of the gray phenotype and the white-gray-opaque tristable switching system in C. dubliniensis. Despite differences in Sap activity and global gene expression profiles, the gray cells of C. dubliniensis are similar to the gray cells of C. albicans with regard to many biological features including cellular morphology, mating competency, and virulence in a mouse model of systemic infection. We further demonstrate that the Wor1 and Efg1 transcription factors play a critical role in the regulation of white-gray-opaque tristable transitions in C. dubliniensis.
Results
Discovery of a novel morphological phenotype, the gray phenotype, and white-gray-opaque tristable switching in C. dubliniensis
The gray phenotype of C. dubliniensis was initially observed in the clinical isolate PC35 when grown on Lee's GlcNAc plates in 20% CO2 for 7 d. Given that the 2 species are closely related phylogenetically, it is reasonable that C. dubliniensis undergoes white-gray-opaque transitions as C. albicans does.Citation25 To test whether other clinical strains could develop the gray phenotype, we performed white-gray-opaque switching assays in 10 clinical isolates of C. dubliniensis under several culture conditions ( and Fig. S1). Solid YPD and Lee's media were used for cell growth. Four strains (PC35, P86, d163, and d172; 40% of the total tested strains) could undergo white-gray-opaque transitions. d163, P86, and d172 were isolated from HIV-infected patients, and PC35 was from a healthy individual.Citation13 To verify that these strains were in fact C. dubliniensis, we sequenced the internal transcribed spacer (ITS) region of the rRNA genes. The colony and cellular morphology of the gray cells of all 3 C. dubliniensis strains was similar to that of C. albicans gray cells ( and Fig. S1). The gray cells were bean-shaped and smaller than the white and opaque cells. The colonies of gray cells were smaller than those of white and opaque cells. The morphologies of the white and opaque cells of PC35 and P86 were similar to their counterparts in C. albicans. However, the opaque cells of d163 underwent clear filamentation and formed fluffy colonies on Lee's GlcNAc medium (Fig. S1). White-opaque switching was not observed in d163 in a previous study.Citation13 The discrepancy between our findings and the previous study could be due to the use of different media and culture conditions. Of note, d163 (a/a), P86 (α/α), and PC35 (a/a) are homozygous at the mating type locus (MTL), which controls white-opaque switching in C. albicans.Citation26 The opaque- and gray-competent strain, d172 (a/α), is a MTL heterozygous strain, suggesting that this tristable switching in C. dubliniensis is independent of the mating type locus under our culture conditions.
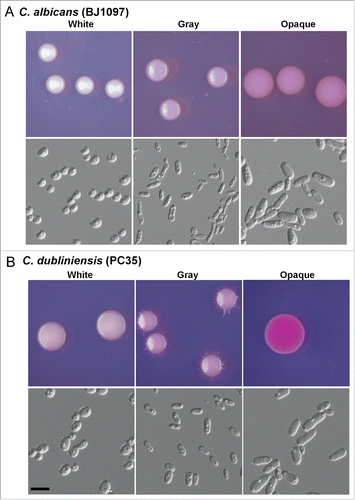
Figure 1. White-gray-opaque transitions in C. albicans (BJ1097, A) and C. dubliniensis (PC35, B). Homogeneous white, gray, or opaque cells were plated on agar plates. Colony and cellular morphologies of the 3 different phenotypes (white, gray, and opaque) are shown. The colonies and cells were imaged after 5 d of growth at 25°C in 5% CO2. Scale bar, 10 μm. Phloxine B (a red dye that stains gray colonies light pink and opaque colonies red) was added at a concentration of 5 μg/mL to Lee's GlcNAc medium.
Consistent with the previous report, SEM assays demonstrated that the cell wall surface of the white cells of C. dubliniensis was smooth and that of some opaque cells was pimpled (Fig. S2). However, there were some obvious “pits” on the cell wall surface of the gray cells. The functions of the “pimples” of opaque cells and “pits” of gray cells remain to be investigated.
Because the gray cells of C. dubliniensis are much smaller than white and opaque cells, we performed fluorescence-activated cell sorting (FACS) analysis to assess ploidy. As shown in Figure S3, all 3 cell types contained a comparable amount of DNA, which suggested that they are all diploid.
Effect of environmental conditions on white-gray-opaque tristable transitions in C. dubliniensis
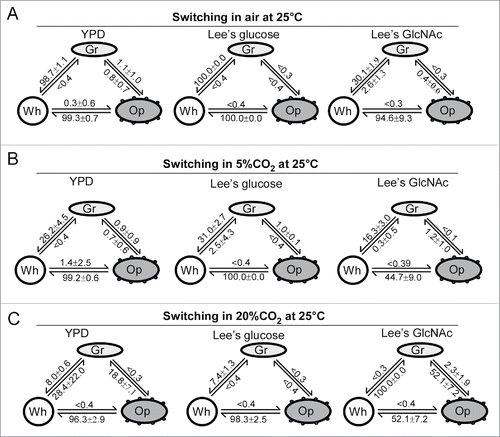
To characterize the switching feature of C. dubliniensis, we performed quantitative switching assays using 9 culture conditions (). The switching frequencies between white-gray, white-opaque, and gray-opaque varied dramatically under different culture conditions. In air, the white cell type was more stable than the gray and opaque cell types. In fact, both gray and opaque cells underwent a mass conversion to the white cell type in all 3 culture media (YPD, Lee's glucose, and Lee's GlcNAc). In the presence of high levels of CO2 (5% or 20%), the gray-to-white switching frequencies were remarkably decreased in all media, while the opaque-to-white switching frequencies were also reduced in Lee's GlcNAc medium. In the presence of GlcNAc, gray cells became more stable in air. Furthermore, GlcNAc and CO2 had a synergistic effect on preventing the switch from opaque-to-white. Although both GlcNAc and CO2 promote white-to-opaque transitions in C. albicans,Citation28,29 the inducing effect of GlcNAc and CO2 on the white-to-opaque transition was not observed in C. dubliniensis.
Figure 2. Switching frequencies of white-gray-opaque transitions in C. dubliniensis (PC35) under different culture conditions. Wh, white; Gr, gray; Op, opaque. Colonies (strain PC35) were grown under the indicated conditions at 25°C for 6 d. YPD, Lee's glucose, and Lee's GlcNAc media were used. Switching frequency = average ± standard deviation (SD). (A) Switching frequencies in air. (B) Switching frequencies in 5% CO2. (C) Switching frequencies in 20% CO2.
Distinct global gene expression profiles in white, gray, and opaque cells
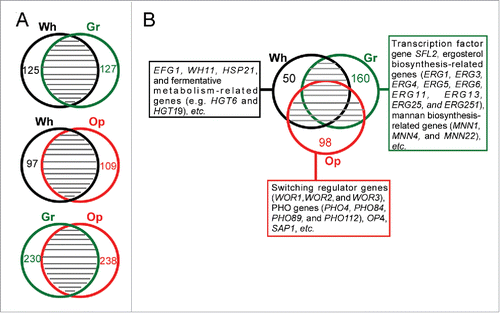
To characterize the global transcriptional profiles of white, gray, and opaque cells of C. dubliniensis, we performed RNA-Seq analysis. A comparative analysis indicated that despite some species-specific cell type-enriched genes, a large number of differentially expressed genes between white-gray, white-opaque, and gray-opaque cell types were similar to those found in C. albicans ( and Dataset S1). Several key findings are described below. In white cells, a number of genes involved in fermentative metabolism and the stress response (e.g. HGT6, NAG3, HGT19, HSP21, HSP70, and HSP78) were exclusively enriched. Similar to the expression profile in white cells of C. albicans, the white-opaque regulator gene EFG1 and white-specific gene WH11 were upregulated in white cells of C. dubliniensis. The transcription factor gene SFL2, which is upregulated in gray cells of C. albicans,Citation25 was also enriched in gray cells of C. dubliniensis, which indicated that Sfl2 plays a conserved role in this regulation. Most interestingly, at least 9 genes involved in ergosterol biosynthesis (ERG1, ERG3, ERG4, ERG5, ERG6, ERG11, ERG13, ERG25, and ERG251) and 3 mannanbiosynthesis-related genes (MNN1, MNN4 and MNN22) were upregulated in gray cells of C. dubliniensis. These genes play a critical role in the regulation of antifungal resistance and other stresses. The global gene expression profile of opaque cells of C. dubliniensis was highly similar to that of opaque cells of C. albicans. Of the 55 opaque cells-enriched genes in C. dubliniensis (a 4-fold cut-off), 32 (58.2%) were also enriched in opaque cells of C. albicans.Citation24,25,30 These genes included SAP1, OP4, WOR2, WOR3, and some oxidative metabolism-related genes (such as PXP2 and ALD6). Of note, 4 genes involved in phosphate metabolism (PHO4, PHO84, PHO89, and PHO112) were upregulated in opaque cells of C. dubliniensis. The relative expression levels of 7 cell type-enriched genes (ERG11, ERG251, RPL10A, RPL12, WOR1, OP4, and WH11) in the 3 different cell types were verified using quantitative RT-PCR assays (Fig. S4). A detailed analysis of differentially expressed genes in the 3 cell types is presented in Dataset S1.
Figure 3. Global gene expression profiles in white, gray, and opaque cells of C. dubliniensis. Differentially expressed genes were identified by RNA-Seq analysis using a 2-fold cut-off. Wh, white; Gr, gray; Op, opaque. (A) Venn diagrams of differentially expressed genes between white-gray, white-opaque, and gray-opaque cell types. The numbers of cell type-specific genes are indicated. (B) White-, gray-, and opaque-specific genes.
White, gray, and opaque cells exhibit different secreted aspartyl protease (Sap) activities
Because several SAP genes were differentially expressed in different cell types (SAP9 and SAP10 in white, SAP7 and SAP10 in gray, and SAP1 in opaque cells, Dataset S1), we tested the Sap activities of white, gray, and opaque cells in 3 clinical isolates of C. dubliniensis (PC35, P86, and d163) using YCB-BSA assays.Citation31 Opaque cells exhibited the highest Sap activity, while gray cells had the lowest Sap activity (Fig. S5). The Sap activities of white, gray, and opaque cells in the 3 clinical strains were equivalent (opaque>white>gray), suggesting that this feature is not strain-dependent. The RNA-Seq analysis demonstrated that SAP1 was exclusively expressed in opaque cells and its absolute expression level was very high (the RPKM value was 1,341 in opaque cells and was only approximately 4 in white and gray cells). Although SAP9 and SAP10 were upregulated in white cells and SAP7 and SAP10 were upregulated in gray cells, the absolute expression levels of these genes were very low in all cell types (RPKM values <220). These results for the expression levels of SAP genes in different cell types are consistent with the Sap activities observed on YCB-BSA plates (Fig. S5).
White, gray, and opaque cells differ in virulence in systemic and ex vivo tongue infection models in mice
As shown in , at the higher inoculation concentration (1 × 10⁷ cells per mouse), mice infected with white cells died faster than those infected with opaque cells, while none of the mice infected with gray cells died. At the lower inoculation concentration (4 × 10⁶ cells per mouse), the mice began to die at the fifth day after infection with white cells, but no mice infected with either gray or opaque cells died even at 15th day after inoculation. Therefore, the order of virulence from highest to lowest in the mouse systemic infection model was as follows: white cells>opaque cells>gray cells. Moreover, the growth rates of white, gray, and opaque cells in Lee's GlcNAc medium at 37°C were comparable (data not shown), suggesting that this difference of virulence is not due to the different growth rates of cell of the 3 cell types.
Figure 4. White, gray, and opaque cells differ in virulence in mouse systemic infections. (A) Survival curves for white, gray, and opaque cells of strain PC35. Each cell type (4 × 10⁶, left, 10 mice used for each cell type; or 1 × 10⁷, right, 12 mice used for each cell type) was injected into each mouse via the tail vein. (B) Fungal burdens of white, gray, and opaque cells in different organs in a mouse systemic infection system. Each cell type (2 × 10⁶ cells in 200 μL of PBS) was injected into each mouse via the tail vein. Six mice were used for each cell type. The mice were killed at 24 hours after injection and 5 organs (liver, kidney, spleen, lung, and brain) were used for the fungal burden assays. The average numbers and standard deviations of the CFU per gram of different tissues are indicated. * indicates significantly difference (P value <0.05, Student's t-test, 2-tailed).
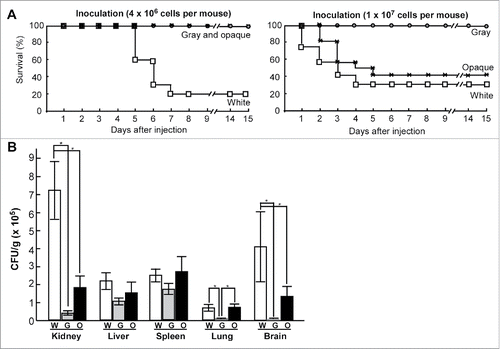
We further examined the fungal burdens in different organs in a mouse systemic infection model (). Consistent with the findings observed in C. albicans, the fungal burdens of white cells of C. dubliniensis were higher than those of gray and opaque cells in the kidney, while the relative levels of fungal burdens of gray and opaque cells were higher in the spleen and liver compared with other organs. To monitor the stability of the 3 cell types in vivo, homogenized kidneys of infected mice were suspended and plated on Lee's GlcNAc plates. We found that the majority (>90 %) of white and gray cells maintained their original cell type, while about 40% of opaque cells maintain the original cell type and about 60% of opaque cells switched to the white cell type.
Saps are one of the major virulence factors of Candida species in mucosal infection. These secreted enzymes degrade animal tissues and facilitate fungal growth and penetration during infections.Citation23,25,32,33 We performed ex vivo tongue infection assays and found that the order of growth rates for the 3 cell types was opaque cells>gray cells>white cells at both 30°C (Fig. S6A) and 37°C (Fig. S6B), which indicated that opaque cells have a greater ability to degrade animal tissues. White and gray cells were very stable at both temperatures, while opaque cells underwent mass conversion to the white phenotype at 37°C (Fig. S6C). Together with the findings for the systemic infection assays, these results suggest that different cell types may be better at colonizing different animal tissues.
White, gray, and opaque cells differ in mating competence
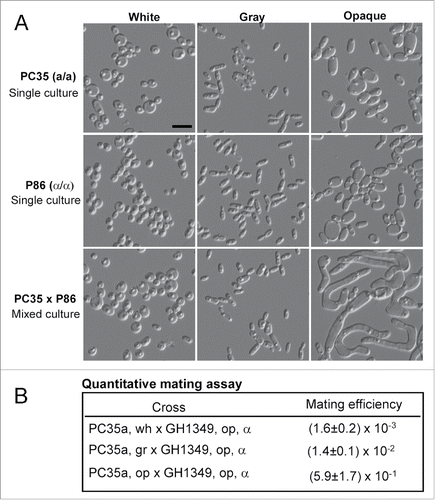
White-opaque switching and sexual mating are linked processes in C. albicans, C. dubliniensis, and C. tropicalis.Citation13,26,34,35 Opaque cells mate much more efficiently than white cells in these species. We tested the mating competence of white, gray, and opaque cells of C. dubliniensis. As shown in , the formation of mating projections (long filament-like tubes) was observed in the mixed culture of opaque “a” cells (PC35) x opaque “α” cells (P86), but this formation was rarely observed in mixed cultures of white “a” cells x white “α” cells or gray “a” cells x gray “α” cells. We then performed quantitative mating assays to compare the competences among the 3 cell types. As shown in , similar to the gray cells of C. albicans, C. dubliniensis gray cells exhibited an intermediate level of mating competency. Opaque cells of PC35 mated hundreds of times and gray cells mated approximately 10 times more efficiently than white cells.
Figure 5. White, gray, and opaque cells exhibit different mating competence. (A) Mating assays performed in liquid Lee's GlcNAc medium between PC35 (MTLa/a, C. dubliniensis) and P86 (MTLα/α, C. dubliniensis). Cellular morphologies of single strain cultures and mixed cultures are shown. Single strain cultures: 5 × 10⁶ white, gray, or opaque cells of PC35 or P86 grown in 1 mL of Lee's GlcNAc medium at 25°C for 24 hours. Mixed cultures: 5 × 10⁶ white, gray, or opaque cells of PC35 mixed with 5 × 10⁶ cells of the same cell type of P86 and grown in 1 mL of Lee's GlcNAc medium at 25°C for 24 hours. Scale bar, 10 μm. (B) Quantitative mating assays. Experimental strain: PC35u (MTLa/a, ura3−). Tester: C. albicans strain GH1349 (MTLα/α, arg4−). White, gray, or opaque a/a cells of PC35 (5 × 10⁶ cells) were mixed with an equivalent number of opaque α cells (GH1349) in 10 μL of ddH2O, spotted onto Lee's GlcNAc medium plates and cultured at 25°C for 48 hours. The mating mixtures were replated onto SC-uridine, SC-arginine, and SC-uridine-arginine medium plates for prototrophic selection. Mating efficiency = average± standard deviation (SD).
The Wor1 and Efg1 transcription factors regulate white-gray-opaque transitions
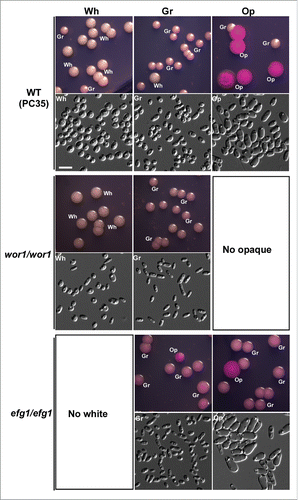
Wor1 and Efg1 play a critical role in the regulation of white-opaque and white-gray-opaque transitions in C. albicans.Citation25,36-40 We investigated the role of these 2 transcription factors in the regulation of white-gray-opaque transitions in C. dubliniensis. As mentioned previously, WOR1 is exclusively expressed in opaque cells, while EFG1 is enriched in white cells of C. dubliniensis (Dataset S1). Deletion of WOR1 blocked the formation of opaque cells and the mutant could only switch between the white and gray cell types. Gray cells of the wor1/wor1 mutant became more stable than those of the WT control on Lee's GlcNAc medium (, and Fig. S7). Deletion of EFG1 blocked the formation of white cells and the mutant could only switch between the gray and opaque cell types. Compared with the WT control, the switching frequency of the efg1/efg1 mutant increased in the presence of GlcNAc (, and Fig. S7). These results suggest that Wor1 is essential for the opaque phenotype, while Efg1 is required for the white phenotype. The two transcription factors could coordinately regulate the white-gray-opaque tristable switching system in C. dubliniensis.
Figure 6. Wor1 and Efg1 regulate white-gray-opaque transitions in C. dubliniensis. Wh, white; Gr, gray; Op, opaque. Cells were grown on Lee's GlcNAc medium in air at 25°C for 5 d The switching frequency data are shown in Figure S7. No opaque colonies were observed in the wor1/wor1 mutant, and no white colonies were observed in the efg1/efg1 mutant.
Discussion
Phenotypic switching allows pathogenic fungi to rapidly adapt to the changing environment of the host. It has been reported that 3 Candida species (C. albicans, C.dubliniensis, and C. tropicalis) can undergo white-opaque switching, which is linked to the ability to cause systemic and cutaneous infections and to undergo sexual mating.Citation13,19-21,25,34,35 We have recently discovered that C. albicans can also exist as a novel cell type, the gray phenotype,Citation25 which is distinct from the well-studied white and opaque cell types.Citation21 In the current study, we report the discovery of the gray phenotype and white-gray-opaque transitions in C. dubliniensis. These findings imply that the white-gray-opaque tristable switching system is conserved in the 2 closely related Candida species.
The gray cell type of C. dubliniensis is similar to that of C. albicans in terms of several biological features, such as cell morphology, reduced virulence in systemic infection models, and mating competence. Four of the 10 clinical isolates of C. dubliniensis (40%) were found to be able to form gray cells. This ratio of gray-competent strains is much high than that of C. albicans (˜10%, unpublished data). The regulatory mechanisms of the white-gray-opaque transitions in the 2 species are also similar. Minimally, the 2 master regulators, Wor1 and Efg1, play similar regulatory roles in the 2 species.Citation25 However, the gray cells of the 2 species also have their own species-specific characteristics. For example, the rich YPD medium has an inducing effect on the gray phenotype in C. albicans,Citation25 but not in C. dubliniensis (). Interestingly, it has been shown that, unlike C. albicans, C. dubliniensis could not undergo filamentation in YPDS medium (YPD medium supplemented with 10% v/v fetal calf serum), but could filamet in water plus 10% (vol/vol) fetal calf serum.Citation41 Given its primary niche is the oral cavity, which represents a poor nutritional environment, it is possible that rich nutrient conditions repress phenotypic transitions in C. dubliniensis. It has been shown that both GlcNAc and CO2 induce the opaque phenotype in C. albicans. Combined use of GlcNAc and CO2 has a synergistic effect on this induction.Citation24,28,29 In C. dubliniensis, GlcNAc or CO2 alone does not promote the opaque phenotype. However, combined use of GlcNAc and CO2(20%) promotes the gray phenotype and stabilizes the opaque phenotype (). Given that both CO2 and GlcNAc are important host-related environmental cues (released by commensal bacteria), the different abilities of C. albicans and C. dubliniensis to undergo morphological changes in response to these inducers could contribute to their virulence and colonization ability. C. dubliniensis primarily colonizes the oral cavity. The switch to the gray phenotype could help this fungus to compete with other bacterial members of the same niche.
There are 10 SAP genes in C. albicans but only 8 in C. dubliniensis.Citation14 Interestingly, Sap activity is induced by the protein BSA in gray cells of C. albicans but not in the gray cells of C. dubliniensis. The expression level of SAP2 is increased thousand times in the presence of BSA in gray cells of C. albicans.Citation25 This difference of Sap activity is consistent with the result of ex vivo tongue infection assays. Gray cells grow faster than white and opaque cells of C. albicans,Citation42 while the growth rate of opaque cells is the fastest in C. dubliniensis (Fig. S6). Given that Saps are major virulence factors in pathogenic Candida species, the difference in Sap activity between the 2 species may contribute to their pathogenesis. The inducible feature of Sap activity in C. albicans may contribute to its higher virulence compared with C. dubliniensis in infection settings.
A global gene expression analysis demonstrated that white, gray, and opaque cells of C. dubliniensis have a set of cell type-specific genes (Dataset S1). A large number of white and opaque cell-enriched genes found in C. dubliniensis are also enriched in the corresponding cells of C. albicans, especially those genes with a highly differential expression pattern. However, only a small number of gray cell-enriched genes in C. dubliniensis were also found to be enriched in the gray cells of C. albicans. These genes include the transcription factor SFL2, CAR1, ERG251, and ORF19.5933. It has been suggested that C. dubliniensis is more capable of developing antifungal resistance (e.g., to azoles) than C. albicans.Citation9,12,14 This feature of C. dubliniensis may be associated with its prevalence in AIDS patients, who are often subjected to antifungal treatments. Our results showing the upregulated expression of a number of ergosterol biosynthesis genes in gray cells of C. dubliniensis provide a potential explanation for this phenomenon.
As in C. albicans, white, gray, and opaque cells of C. dubliniensis differ in mating competence. Gray cells exhibit an intermediate level of mating competence in both species. The link between phenotypic switching and sexual mating could play a balancing role in the sexual and non-sexual reproduction lifestyles in the 2 species. Phenotypic switching facilitates a rapid adaption to new environments, while sexual reproduction may play a role in the evolution of new traits and maintaining a diverse population to gain advantages over other species over time. Therefore, different cell types may play a distinct role in the processes of infecting the host and adapting to unique ecological niches and different lifestyle stages. Understanding the regulatory mechanisms of these morphological transitions would not only provide insights into the adaptive strategies of pathogenic pathogens but would also be important for the development of new antifungal drugs.
In summary, the 2 closely related species, C. dubliniensis and C. albicans, share many common biological features. In the present study, we report the white-gray-opaque phenotypic switching system in C. dubliniensis, which is highly similar to that in C. albicans. The new gray cell type of C. dubliniensis is similar to the gray cell type of C. albicans in terms of cellular morphology, mating competence, and genetic regulatory mechanisms. These findings are reasonable given the high similarity of the genomic DNA sequences of the 2 species. There are indeed some unique features of gray cells of C. dubliniensis, such as its low Sap activity and unique global gene expression profile. Our results suggest that the heritable white-gray-opaque phenotypic switching system is conserved in the 2 closely related species, C. dubliniensis and C. albicans.
Materials and methods
Strains and plasmids
The strains used in this study are listed in Table S1. All clinical strains of C. dubliniensis were isolated from the oral cavity. YPD (20 g/L glucose, 20 g/L peptone, 10 g/L yeast extract, w/v) and Lee's mediumCitation24,29 were used for the routine growth of yeast cells. The solid medium contained 2% agar and 5 μg/mL of the dye phloxine B, which stains opaque colonies red and gray colonies light pink.
To delete the first allele of the URA3 gene, C. dubliniensis PC35 was transformed with the PCR product amplified from the CaSAT1 cassette (in plasmid pNIM1Citation43) with primers URA3-SAT1Fwd and URA3-SAT1Rev (Table S2). The URA3/ura3::SAT1 heterozygous strain was streaked onto 5-fluoroorotic acid (5-FOA)-containing plates to select for uridine-auxotrophic isolates. Fusion PCR strategiesCitation44 were used to delete the first allele of WOR1 or EFG1 in PC35. The primers used for PCR are listed in Table S2. The Cahph marker was used for positive selection on plates containing medium supplemented with hygromycin (the Candida hph hygromycin-resistance gene was a gift from Dr. Xiaoqin Lai, Institute of Microbiology, CAS, Beijing, China). To delete the second copy of WOR1 or EFG1, we constructed plasmids pSFS2a-WOR1KO and pSFS2a-EFG1KO. Two fragments that are homologous to the 5′- and 3′-sequences of WOR1 were inserted into the ApaI/XhoI and SacII/SacI sites of pSFS2ACitation45 to generate plasmid pSFS2a-WOR1KO. Two fragments that are homologous to the 5′- and 3′-sequences of EFG1 were inserted into the KpnI/XhoI and SacII/SacI sites to generate plasmid pSFS2a-EFG1KO. The plasmids were linearized with ApaI (or KpnI) and SacI and used to delete the second allele of WOR1 or EFG1.
Phenotype switching assays
White-gray-opaque switching assays were performed as described previously.Citation25 Lee's glucose, Lee's GlcNAc, and YPD media were used to quantitatively assess the switching frequency. White, gray, or opaque cells were first grown on solid Lee's GlcNAc medium at 25°C for 5 d Homogeneous white, gray, or opaque colonies were resuspended, plated on nutrient agar plates and incubated in air, 5% CO2, or 20% CO2 at 25°C for 5 to 6 d The number of colony of different cell types was counted, and the switching frequencies between different phenotypes were calculated.
SEM assays
SEM assays were performed as previously reported.Citation24,25 White, gray, and opaque cells were grown in liquid Lee's glucose medium at 25°C for 24 hours. The cells were gently washed with 1× PBS and fixed with 2.5% glutaraldehyde. The samples were then washed 3 times with 0.1 M Na3PO4 buffer (pH 7.2), dehydrated with gradually increasing concentrations of ethanol (30% – 50% – 70% – 85% – 95% – 100%) and coated with gold. The cells were imaged with a scanning electron microscope (FEI QUANTA 200).
Mating assays
C. dubliniensis cells were grown in liquid Lee's GlcNAc medium to the stationary phase at 25°C. To compare the mating responses in different cell types, 5 × 10⁶ white, gray, or opaque “a” cells (PC35) were mixed with 5 × 10⁶ of the corresponding “α” cells (P86) in 1 mL of liquid Lee's GlcNAc medium and cultured at 25°C for 24 hours. The cellular morphologies were then examined using a microscope.
For the quantitative mating assays, C. albicans GH1349 (MTLα/α, arg4/arg4) was used as the tester strain because its opaque cells are very stable and C. albicans can mate efficiently with C. dubliniensis.Citation13 Opaque cells (5 × 10⁶) of GH1349 were mixed with 5 × 10⁶ experimental white, gray, or opaque cells of C. dubliniensis PC35 in 10 μL of ddH2O and spotted onto solid Lee's GlcNAc medium plates. The mating mixtures were cultured in air at 25°C for 48 hours and then resuspended, diluted, and plated on 3 types of selectable plates (SC-uridine, SC-arginine, and SC-uridine-arginine) for growth. The mating efficiencies were calculated according to previous reports.Citation26,37
Sap activity and FACS analysis assays
Sap activity and FACS analysis assays were performed according to our previous study.Citation25 Cells were grown in liquid Lee's glucose medium to the exponential phase and used for FACS analysis. YCB agar containing 0.2% BSA as the sole nitrogen source was used for the Sap activity assays. White, gray, and opaque cells were grown in liquid Lee's glucose medium at 25°C to the exponential phase and then collected and washed twice with ddH2O. The cells of each type (5 × 10⁶ cells in 5 μL of ddH2O) were spotted onto the YCB-BSA agar plates and incubated in air at 25°C for 5 d The activity of the secreted enzyme was determined based on the size of the white halo rings.
Virulence assays
All of the animal experiments were performed according to the guidelines approved by the Animal Care and Use Committee of the Institute of Microbiology, Chinese Academy of Sciences. Systemic infection and ex vivo tongue (mucosal) infection assays were performed according to previous reports.Citation25 Female BALB/c mice aged 4 to 5 weeks were used in this study. Ex vivo tongue infection assays were performed in air at 30°C or 37°C. For the survival rate tests, 10 to 12 mice were used for each cell type (white, gray, or opaque). For the fungal burden assays, 2 × 10⁶ cells of each cell type in 200 μL of PBS were injected into each mouse via the tail vein. Six mice were used for each cell type (white, gray, or opaque). The mice were humanely killed at 24 hours after injection. Organ tissues (liver, kidney, spleen, lung, and brain) were removed and used for the colony-forming unit (CFU) analysis.
RNA extraction, RNA-Seq, and quantitative real-time PCR (Q-RT-PCR) assays
White, gray, and opaque cells were grown at 25°C in liquid Lee's glucose medium for 24 hours. Total RNA was extracted using GeneJET RNA Purification kits according to the manufacturer's instructions. The RNA-Seq analysis was performed by the company BGI-Shenzhen according to the company's protocol (http://www.genomics.cn/).Citation10 Approximately 10 million (M) reads were obtained by sequencing each library. The gene expression level was calculated using the RPKM method.Citation46 Quantitative RT-PCR assays were performed to verify the relative gene expression levels in different cell types according to our previous report.Citation42 The signal from each experimental sample was normalized to expression of the ACT1 gene. Three repeats were performed for quantitative RT-PCR experiments.
Statistical analysis
In the switching and mating assays ( and Fig. S7), 3 biological repeats were performed. Switching frequency (or mating efficiency) = average ± standard deviation (SD). In , 6 mice were used for each cell type. In Figure S6, 3 mice were used for each cell type. Average values ± standard deviations are shown. Two-tailed Student's t-tests were performed.
Disclosure of potential conflicts of interest
No potential conflicts of interest were disclosed.
KVIR_Supp_1135287.zip
Download Zip (3.4 MB)Acknowledgments
The authors thank Drs. David Soll and Joachim Morschhäuser for the generous gifts of plasmids and strains and Tong Zhao (Institute of Microbiology, CAS) for FACS analysis.
Funding
This work was supported by grants from the Chinese National Natural Science Foundation (31370175, 31170086, and 81322026 to G.H.; 31200115 to L.T.) and the “100 Talent Program” grant from the Chinese Academy of Sciences (to G.H.).
References
- Pfaller MA. Epidemiology of candidiasis. J Hosp Infect 1995; 30 Suppl:329-38; PMID:7560969; http://dx.doi.org/10.1016/0195-6701(95)90036-5
- Biswas S, Van Dijck P, Datta A. Environmental sensing and signal transduction pathways regulating morphopathogenic determinants of Candida albicans. Microbiol Mol Biol Rev 2007; 71:348-76; PMID:17554048; http://dx.doi.org/10.1128/MMBR.00009-06
- Pfaller MA, Diekema DJ. Epidemiology of invasive candidiasis: a persistent public health problem. Clin Microbiol Rev 2007; 20:133-63; PMID:17223626; http://dx.doi.org/10.1128/CMR.00029-06
- Whiteway M, Bachewich C. Morphogenesis in Candida albicans. Annu Rev Microbiol 2007; 61:529-53; PMID:17506678; http://dx.doi.org/10.1146/annurev.micro.61.080706.093341
- Huang G. Regulation of phenotypic transitions in the fungal pathogen Candida albicans. Virulence 2012; 3; 251-61; PMID:22546903; http://dx.doi.org/10.4161/viru.20010
- Sullivan DJ, Westerneng TJ, Haynes KA, Bennett DE, Coleman DC. Candida dubliniensis sp. nov.: phenotypic and molecular characterization of a novel species associated with oral candidosis in HIV-infected individuals. Microbiology 1995; 141 ( Pt 7):1507-21; PMID:7551019; http://dx.doi.org/10.1099/13500872-141-7-1507
- Coleman DC, Sullivan DJ, Bennett DE, Moran GP, Barry HJ, Shanley DB. Candidiasis: the emergence of a novel species, Candida dubliniensis. AIDS 1997; 11:557-67; PMID:9108936; http://dx.doi.org/10.1097/00002030-199705000-00002
- Sullivan D, Haynes K, Bille J, Boerlin P, Rodero L, Lloyd S, Henman M, Coleman D. Widespread geographic distribution of oral Candida dubliniensis strains in human immunodeficiency virus-infected individuals. J Clin Microbiol 1997; 35:960-4; PMID:9157162
- Gutierrez J, Morales P, Gonzalez MA, Quindos G. Candida dubliniensis, a new fungal pathogen. J Basic Microbiol 2002; 42:207-27; PMID:12111748; http://dx.doi.org/10.1002/1521-4028(200206)42:3%3c207::AID-JOBM207%3e3.0.CO;2-C
- Li R, Yu C, Li Y, Lam TW, Yiu SM, Kristiansen K, Wang J. SOAP2: an improved ultrafast tool for short read alignment. Bioinformatics 2009; 25:1966-7; PMID:19497933; http://dx.doi.org/10.1093/bioinformatics/btp336
- Odds FC, Hanson MF, Davidson AD, Jacobsen MD, Wright P, Whyte JA, Gow NA, Jones BL. One year prospective survey of Candida bloodstream infections in Scotland. J Med Microbiol 2007; 56:1066-75; PMID:17644714; http://dx.doi.org/10.1099/jmm.0.47239-0
- Ells R, Kock JL, Pohl CH. Candida albicans or Candida dubliniensis? Mycoses 2011; 54:1-16; PMID:19682314; http://dx.doi.org/10.1111/j.1439-0507.2009.01759.x
- Pujol C, Daniels KJ, Lockhart SR, Srikantha T, Radke JB, Geiger J, Soll DR. The closely related species Candida albicans and Candida dubliniensis can mate. Eukaryot Cell 2004; 3:1015-27; PMID:15302834; http://dx.doi.org/10.1128/EC.3.4.1015-1027.2004
- Jackson AP, Gamble JA, Yeomans T, Moran GP, Saunders D, Harris D, Aslett M, Barrell JF, Butler G, Citiulo F, et al. Comparative genomics of the fungal pathogens Candida dubliniensis and Candida albicans. Genome Res 2009; 19:2231-44; PMID:19745113; http://dx.doi.org/10.1101/gr.097501.109
- Spiering MJ, Moran GP, Chauvel M, Maccallum DM, Higgins J, Hokamp K, Yeomans T, d'Enfert C, Coleman DC, Sullivan DJ. Comparative transcript profiling of Candida albicans and Candida dubliniensis identifies SFL2, a C. albicans gene required for virulence in a reconstituted epithelial infection model. Eukaryot Cell 2010; 9:251-65; PMID:20023067; http://dx.doi.org/10.1128/EC.00291-09
- Sudbery PE. Growth of Candida albicans hyphae. Nat Rev Microbiol 2011; 9:737-48; PMID:21844880; http://dx.doi.org/10.1038/nrmicro2636
- Berman J. Candida albicans. Curr Biol 2012; 22:R620-2; PMID:22917504; http://dx.doi.org/10.1016/j.cub.2012.05.043
- Slutsky B, Staebell M, Anderson J, Risen L, Pfaller M, Soll DR. “White-opaque transition:” a second high-frequency switching system in Candida albicans. J Bacteriol 1987; 169:189-97; PMID:3539914
- Lohse MB, Johnson AD. White-opaque switching in Candida albicans. Curr Opin Microbiol 2009; 12:650-4; PMID:19853498; http://dx.doi.org/10.1016/j.mib.2009.09.010
- Soll DR. Why does Candida albicans switch? FEMS Yeast Res 2009; 9:973-89; PMID:19744246; http://dx.doi.org/10.1111/j.1567-1364.2009.00562.x
- Soll DR. The role of phenotypic switching in the basic biology and pathogenesis of Candida albicans. J Oral Microbiol 2014; 6:22993; PMID:24455104; http://dx.doi.org/10.3402/jom.v6.22993
- Anderson JM, Soll DR. Unique phenotype of opaque cells in the white-opaque transition of Candida albicans. J Bacteriol 1987; 169:5579-88; PMID:3316187
- Kvaal C, Lachke SA, Srikantha T, Daniels K, McCoy J, Soll DR. Misexpression of the opaque-phase-specific gene PEP1 (SAP1) in the white phase of Candida albicans confers increased virulence in a mouse model of cutaneous infection. Infect Immun 1999; 67:6652-62; PMID:10569787
- Xie J, Tao L, Nobile CJ, Tong Y, Guan G, Sun Y, Cao C, Hernday AD, Johnson AD, Zhang L, et al. White-opaque switching in natural MTLa/α isolates of Candida albicans: evolutionary implications for roles in host adaptation, pathogenesis, and sex. PLoS Biol 2013; 11:e1001525; PMID:23555196; http://dx.doi.org/10.1371/journal.pbio.1001525
- Tao L, Du H, Guan G, Dai Y, Nobile CJ, Liang W, Cao C, Zhang Q, Zhong J, Huang G. Discovery of a “white-gray-opaque” tristable phenotypic switching system in candida albicans: roles of non-genetic diversity in host adaptation. PLoS Biol 2014; 12:e1001830; PMID:24691005; http://dx.doi.org/10.1371/journal.pbio.1001830
- Miller MG, Johnson AD. White-opaque switching in Candida albicans is controlled by mating-type locus homeodomain proteins and allows efficient mating. Cell 2002; 110:293-302; PMID:12176317; http://dx.doi.org/10.1016/S0092-8674(02)00837-1
- Pande K, Chen C, Noble SM. Passage through the mammalian gut triggers a phenotypic switch that promotes Candida albicans commensalism. Nat Genet 2013; 45:1088-91; PMID:23892606; http://dx.doi.org/10.1038/ng.2710
- Huang G, Srikantha T, Sahni N, Yi S, Soll DR. CO(2) regulates white-to-opaque switching in Candida albicans. Curr Biol 2009; 19:330-4; PMID:19200725; http://dx.doi.org/10.1016/j.cub.2009.01.018
- Huang G, Yi S, Sahni N, Daniels KJ, Srikantha T, Soll DR. N-acetylglucosamine induces white to opaque switching, a mating prerequisite in Candida albicans. PLoS Pathog 2010; 6:e1000806; PMID:20300604; http://dx.doi.org/10.1371/journal.ppat.1000806
- Lan CY, Newport G, Murillo LA, Jones T, Scherer S, Davis RW, Agabian N. Metabolic specialization associated with phenotypic switching in Candidaalbicans. Proc Natl Acad Sci U S A 2002; 99:14907-12; PMID:12397174; http://dx.doi.org/10.1073/pnas.232566499
- Palmer GE, Cashmore A, Sturtevant J. Candida albicans VPS11 is required for vacuole biogenesis and germ tube formation. Eukaryot Cell 2003; 2:411-21; PMID:12796286; http://dx.doi.org/10.1128/EC.2.3.411-421.2003
- Schaller M, Korting HC, Schafer W, Bastert J, Chen W, Hube B. Secreted aspartic proteinase (Sap) activity contributes to tissue damage in a model of human oral candidosis. Mol Microbiol 1999; 34:169-80; PMID:10540295; http://dx.doi.org/10.1046/j.1365-2958.1999.01590.x
- Naglik JR, Challacombe SJ, Hube B. Candida albicans secreted aspartyl proteinases in virulence and pathogenesis. Microbiol Mol Biol Rev 2003; 67:400-28, table of contents; PMID:12966142; http://dx.doi.org/10.1128/MMBR.67.3.400-428.2003
- Porman AM, Alby K, Hirakawa MP, Bennett RJ. Discovery of a phenotypic switch regulating sexual mating in the opportunistic fungal pathogen Candida tropicalis. Proc Natl Acad Sci U S A 2011; 108:21158-63; PMID:22158989; http://dx.doi.org/10.1073/pnas.1112076109
- Xie J, Du H, Guan G, Tong Y, Kourkoumpetis TK, Zhang L, Bai FY, Huang G. N-Acetylglucosamine Induces White-to-Opaque Switching and Mating in Candida tropicalis, Providing New Insights into Adaptation and Fungal Sexual Evolution. Eukaryot Cell 2012; 11:773-82; PMID:22544905; http://dx.doi.org/10.1128/EC.00047-12
- Srikantha T, Tsai LK, Daniels K, Soll DR. EFG1 null mutants of Candida albicans switch but cannot express the complete phenotype of white-phase budding cells. J Bacteriol 2000; 182:1580-91; PMID:10692363; http://dx.doi.org/10.1128/JB.182.6.1580-1591.2000
- Huang G, Wang H, Chou S, Nie X, Chen J, Liu H. Bistable expression of WOR1, a master regulator of white-opaque switching in Candida albicans. Proc Natl Acad Sci U S A 2006; 103:12813-8; PMID:16905649; http://dx.doi.org/10.1073/pnas.0605270103
- Srikantha T, Borneman AR, Daniels KJ, Pujol C, Wu W, Seringhaus MR, Gerstein M, Yi S, Snyder M, Soll DR. TOS9 regulates white-opaque switching in Candida albicans. Eukaryot Cell 2006; 5:1674-87; PMID:16950924; http://dx.doi.org/10.1128/EC.00252-06
- Zordan RE, Galgoczy DJ, Johnson AD. Epigenetic properties of white-opaque switching in Candida albicans are based on a self-sustaining transcriptional feedback loop. Proc Natl Acad Sci U S A 2006; 103:12807-12; PMID:16899543; http://dx.doi.org/10.1073/pnas.0605138103
- Zordan RE, Miller MG, Galgoczy DJ, Tuch BB, Johnson AD. Interlocking transcriptional feedback loops control white-opaque switching in Candida albicans. PLoS Biol 2007; 5:e256; PMID:17880264; http://dx.doi.org/10.1371/journal.pbio.0050256
- O'Connor L, Caplice N, Coleman DC, Sullivan DJ, Moran GP. Differential filamentation of Candida albicans and Candida dubliniensis Is governed by nutrient regulation of UME6 expression. Eukaryot Cell 2010; 9:1383-97; PMID:20639413; http://dx.doi.org/10.1128/EC.00042-10
- Tao L, Cao C, Liang W, Guan G, Zhang Q, Nobile CJ, Huang G. White cells facilitate opposite- and same-sex mating of opaque cells in Candida albicans. PLoS Genet 2014; 10:e1004737; PMID:25329547; http://dx.doi.org/10.1371/journal.pgen.1004737
- Park YN, Morschhauser J. Tetracycline-inducible gene expression and gene deletion in Candida albicans. Eukaryot Cell 2005; 4:1328-42; PMID:16087738; http://dx.doi.org/10.1128/EC.4.8.1328-1342.2005
- Noble SM, Johnson AD. Strains and strategies for large-scale gene deletion studies of the diploid human fungal pathogen Candida albicans. Eukaryot Cell 2005; 4:298-309; PMID:15701792; http://dx.doi.org/10.1128/EC.4.2.298-309.2005
- Reuss O, Vik A, Kolter R, Morschhauser J. The SAT1 flipper, an optimized tool for gene disruption in Candida albicans. Gene 2004; 341:119-27; PMID:15474295; http://dx.doi.org/10.1016/j.gene.2004.06.021
- Mortazavi A, Williams BA, McCue K, Schaeffer L, Wold B. Mapping and quantifying mammalian transcriptomes by RNA-Seq. Nat Methods 2008; 5:621-8; PMID:18516045; http://dx.doi.org/10.1038/nmeth.1226