
Diphtheria and tetanus vaccines are produced by chemical detoxification of the native toxins through formaldehyde treatment. Diphtheria toxin (DT)# is secreted from the pathogenic Corynebacterium diphtheria while tetanus neurotoxin (TeNT) is secreted from the pathogenic Clostridium tetani. Both toxins are classified as A-B toxins based on their structural organization and action mechanisms containing a catalytic domain, a translocation domain and a receptor-binding domain (Fig. S1, A and B).Citation1–8 While the DT crystal structure was previously solved,Citation1,Citation2 the structure of full-length TeNT is still out of reach. However, several crystal structures of TeNT catalytic domain have been solved,Citation9,Citation6,Citation10 as well as the receptor-binding domain bound to various ligandsCitation8,Citation7,Citation11 providing partial insights into the structure and function of TeNT. These structures of TeNT catalytic and receptor-binding domains show high resemblance to the corresponding domains of the closely related clostridial botulinum neurotoxin B (BoNT).Citation9,Citation11,Citation12 Formaldehyde is a fixating, stabilizing and cross-linking agent, which, when mixed with protein, can result in a chain of reactions that lead to both inter- and intra-molecular cross-links in the form of methylene bridges (Fig. S1C). Methylene-bridges are very stable and are resistant to heat, acid hydrolysis and urea treatment.Citation13 Formaldehyde-inactivated DT and TeNT, termed toxoids, (DTd and TTd, respectively), are supplied by Statens Serum Institut (SSI) in Denmark as vaccine components in the protection against C. diphtheria and C. tetani infections. These vaccines are used in the vaccination program of both children and adults in several countries in the European, Asian and Australian continents. International quality and safety requirements are performed according to the guidelines from the World Health Organization to ensure high quality and efficacy standards. To comply with minimum requirements the toxoids are tested during the production process. Unfortunately, animal studies still play an important role in quality control. Improved in vitro investigation and qualification can potentially reduce the number of test animals required for in vivo experiments, and is a strong desire by manufacturers and regulatory authorities for both economical and ethical reasons.Citation14 For the in vitro characterization of diphtheria and tetanus vaccines, a combination of physico-chemical, immunochemical methods have previously been demonstrated as candidates for monitoring quality.Citation14–19 In the present study, we aim to use 2 novel methods for investigating and comparing the biophysical properties of diphtheria- and tetanus toxin with formaldehyde-inactivated toxoids. We apply differential scanning fluorimetry (DSF) to determine alterations in thermo-stability and small-angle X-ray scattering (SAXS) to obtain low-resolution structural information of the purified TeNT and DT and of the produced toxoids. We find that while DSF was highly useful for in vitro monitoring of the detoxification progress, and SAXS was suitable for gaining information on protein quality, molecular weight, size and for structural comparison of toxins and toxoids. Our presented data was backed up by more conventional methods such as circular dichroism (CD), mass spectrometry (MS), SDS-PAGE and size-exclusion chromatography (SEC).
To purify and evaluate the impact of the formaldehyde treatment on the oligomeric state and hydrodynamic volume of DT and TeNT, we applied both toxins as well as toxoids to size-exclusion chromatography (SEC) using a Superdex 200 column. The SEC elution profile of DT showed a larger elution volume (14.7 ml) compared with the corresponding toxoid (14.1 ml) (Fig. S2A). This corresponds to a theoretical mass of 48 kDa and 63 kDa, respectively (mass of DT based on intact primary structure is 58.3 kDa), after column calibration using defined protein standards (Gel Filtration Molecular Weight Markers kit, Sigma-Aldrich). Minor peaks of smaller elution volumes, an indication for the presence of a small fraction of DT and DTd in oligomeric state, were also seen in the DT and DTd profiles. These fractions were excluded in the following analysis but showed that DT and DTd mainly behave as monomers in solution. Similarly, TeNT showed a main monodisperse peak eluting at 12.3 ml corresponding to a theoretical size of approximately 145 kDa and a small peak with an elution volume equal to 10.3 ml, an indication for the presence of a higher TeNT oligomeric state (Fig. S2B). Hence, TeNT is primarily a monomer in solution, based on the primary sequence the mass is 150.5 kDa, and with only a very small portion of the protein in an oligomeric state. The TTd also mainly elutes as a monodisperse peak at 11.97 ml, corresponding to a theoretical mass of approximately 169 kDa and, as for TeNT, there is a minor portion of TTd that is presented as an oligomer. The SEC elution fractions corresponding to monomeric DT, DTd, TeNT and TTd were visualized by SDS-PAGE analysis (Fig. S2, A and B). The SDS gel for DT and DTd show a single defined band for intact DT at the middle position between 50 and 75 kDa MW markers. Meanwhile the DTd protein band is more diffused and appear as a smear at a position equivalent to the migrated band of DT. The gel containing TeNT and TTd shows 2 bands equal to 100 and to 50 kDa in the lane containing TeNT. The 2 bands correspond to fragment A and B of TeNT, respectively, that are dissociated due to the reduction of the disulfide bond connecting these fragments. A faint TeNT band is seen at the 150 kDa MW marker position indicating incomplete reduction of the disulfide bond. No such dissociation is observed for TTd, as a diffuse protein band around 150 kDa is more intense compared with TeNT sample and no bands are observed at 100 and 50 kDa positions. This lack of dissociation is explained by the formation of formaldehyde-induced crosslinks that connects fragments A and B making the fragments resilient to the reducing conditions of SDS-PAGE analysis. The observed smears of DTd and TTd are likely due to the heterogeneity of reaction products caused by variable numbers and sites of intramolecular cross-links in the toxoid molecules.Citation15,Citation18 Hence, formaldehyde-treatment increases the hydrodynamic volume of the toxins.
We applied far-UV (180–260 nm) circular dichroism (CD) spectroscopy, a widely used method for studying protein secondary structure and stability as well as for determining how environmental and chemical factors impact these features.Citation20 The CD analysis revealed only minor secondary structure alterations of the inactivated toxoids compared with the toxins. The CD spectra of DT and DTd are highly similar and overlay well at all measured wavelengths (Fig. S3A). The CD spectra of TeNT and TTd along with TTd measured at different detoxification stages were also compared (Fig. S3B). The spectra all looked similar, and the estimated fractions of α-helix and β-sheet were therefore also highly similar (Fig. S3C). The minor variations in the calculated α-helix and β-strand fractions for the toxins and toxoids are presumably a consequence of inaccuracies in the concentration measurements and not significant biologically.
We also applied near-UV CD to investigate the potential impact of formaldehyde detoxification on the tertiary structure of DT and TeNT. The analysis reveals that formaldehyde detoxification of DT increases the CD spectra signal intensity at 250–280 nm region (Fig A4A). This indicates that aromatic residues, mainly phenylalanine and tyrosine, are either directly or indirectly affected by formaldehyde treatment. Similar analysis was performed for TeNT and TTd from different stages of the detoxification reaction. As for DT, formaldehyde treatment of TeNT increases the CD spectra signal intensity, and this increase correlates with increasing detoxification incubation time (Fig. S4B). However, in contrast to DT the signal intensity increase is mainly 270–290nm region. This is an indication that tryptophan residues are the aromatic residues that are mainly affected by formaldehyde treatment. The near-UV results for both DT/DTd and TeNT/TTd indicate the formaldehyde treatment affects certain aromatic residues of these proteins, which may induce perturbations of the tertiary structures.
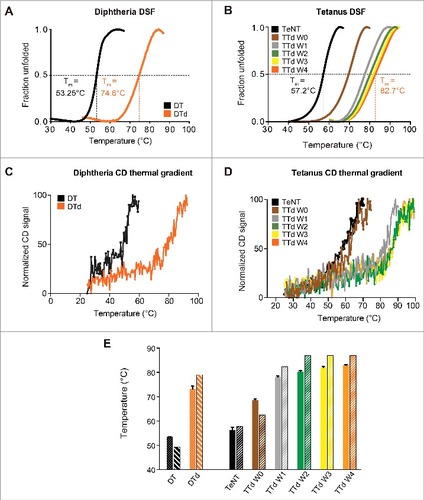
Differential scanning fluorimetry (DSF) is a fast and convenient fluorescence-based assay for investigating alterations in the melting temperature (Tm).Citation21,Citation22 Using this method, we found that the toxoids are considerably more stable in comparison to the native toxins. This was seen by a dramatic increase in Tm extrapolated from the transition region of the melting curve for both DTd (74.6 ± 0.7°C) (A) as well as TTd (82.7 ± 0.7°C) (B) compared with DT (53.3 ± 0.3°C) and TeNT (57.2 ± 0.6°C). Thus, an increase of more than 20°C in Tm was observed for both DT and TeNT upon detoxification. Subsequently, we used DSF to follow the change in Tm during the 4-week detoxification procedure of TeNT. The analysis revealed a gradual increase in Tm during the 4 weeks it was monitored (B). The Tm increased by approximately 12°C within a few hours of the detoxification process, as seen for week 0 (W0) sample in comparison to non-treated TeNT. A week later an additional increase of 8°C, in Tm was observed for sample W1, relative to W0 sample. The following weeks demonstrated less significant increases in Tm, meaning that the most significant stability enhancement was observed within the first week of treatment with formaldehyde. To corroborate the results obtained by DSF, Tm for diphtheria and tetanus toxins and toxoids were also determined using CD. Similar to DSF, the CD results revealed that the toxoids are significantly more heat-stable than the native toxins for both diphtheria and tetanus (, C and D, respectively). In addition, the CD results confirmed that the Tm of tetanus toxoid increases gradually during the detoxification process. However, in contrast to the DSF results, the largest increase in Tm was observed between W0 and W1 and the Tm values determined by CD differ slightly compared with DSF-determined Tm (E). An explanation for this could be that CD and DSF analysis are 2 different methods, where CD determines secondary structure (at 220 nm it is manly the α-helical content of the protein) changes that occur to the protein due to the increasing temperature, DSF monitors the protein folding and the temperature that exposes the hydrophobic core of the protein, that interacts with the fluorescing dye and emits the observed signal. Nonetheless, both CD and DSF confirmed a considerable increase in the thermo-stability of toxoids compared with toxins, and that a plateau in thermal stability is achieved within the first 2 weeks of the detoxification process of TeNT.
Figure 1. Differential scanning fluorimetry and circular dichroism thermal gradient. (A) the melting curves, for DT (black) and DTd (orange), represented by fraction unfolded protein vs the temperature. (B) the melting curve for the TeNT (black), and the TTd at various stages in the detoxification process W0 (brown), W1 (gray), W2 (green), W3 (yellow) and W4 (orange). The dashed lines indicate the extrapolated melting temperature, Tm. (C) CD analysis melting spectra for the DT (black) and DTd (orange). (D) CD analysis melting spectra for TeNT (black) and TTd at various stages in the detoxification process (colored as in panel (B)). (E) comparison of Tms determined for DT and DTd by DSF and CD analysis (dotted and striped columns, respectively) and TeNT and TTd at different detoxification stages (solid and striped columns, respectively). The standard deviations (std) of the DSF determined Tm for each melting curve in (B) and column diagrams in (C) are ± 0.12 for TeNT, ± 0.37 (W0), ± 0.47 (W1), ± 0.37 (W2), ± 0.37 (W3) and ± 0.25°C (W4)
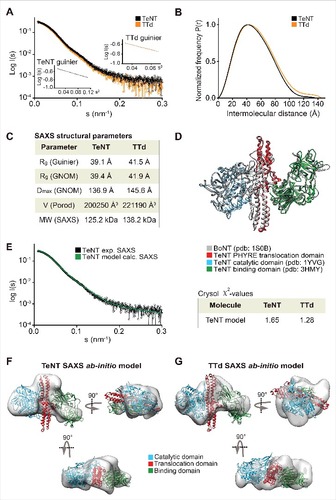
We analyzed both toxins and toxoids using small-angle X-ray scattering (SAXS). SAXS is a powerful method for investigating the solution structure of macromolecules at low resolution, providing information about the molecule size, longest particle dimension (Dmax), radius of gyration (Rg), folding state and the overall shape.Citation23,Citation24 The collected scattering data of both toxins and toxoids did not reveal any inter-particle effects as the fits in Guinier regions (s#R<1.3) were linear (A and A). The scattering curves of DT versus DTd (A) as well as TeNT vs. TTd (A) were highly similar and overlaid well, suggesting that detoxification had a minimal effect on the tertiary structure. The pair distance distribution function P(r) revealed, that Dmax was 3.2 Å larger for DTd compared with DT suggesting that detoxification resulted in a slight increase of overall molecular size (, B and C). We found a similar pattern for tetanus, as Dmax increased with 8.7 Å upon formaldehyde treatment (, B and C). In support of this, the Porod volumes of both diphtheria and tetanus toxoids were slightly larger relative to the native toxins, meaning that the estimated molecular mass of the toxoids is marginally bigger compared with the toxins (C and C). Both observations agree with the SEC analysis showing that hydrodynamic volume increases upon inactivation (Fig. S2). Next, we used the SAXS data to evaluate the oligomeric state of the toxins and toxoids and compared the solution scattering to the existing high-resolution structures obtained from the crystals. For DT and DTd, validation of the experimental SAXS data was done using the available crystal structures solved as a monomerCitation1 (Protein Data Bank code 1MDT) and as a dimer with swapped catalytic domainsCitation4 (Protein Data Bank code 1DDT). Comparison of the theoretical scattering of either the monomer or the dimer crystal structures against the experimental SAXS data using CRYSOLCitation25 showed that both DT as well as DTd are compact monomers in solution (D), with very close fits to the theoretical curve of the monomeric structure (χ2 = 1.04). As no structural data exist on the full-length TeNT, and to evaluate the scattering data, we generated a PHYRE2 Citation16 homology model of TeNT (D) using the existing crystal structures of the TeNT binding and catalytic domains and the available crystal structure of full-length BoNT as a template (see supplementary methods). The low RMSD-values of 1.283 Å (338 Cαatoms) and 0.831 Å (343 Cαatoms) of the receptor-binding and catalytic domains, respectively, combined with the high sequence similarity to BoNT, suggested, that the model is suitable for validation of the SAXS data. This BoNT-based TeNT model thus allowed us to apply CRYSOL to compare the experimental SAXS scattering of either TeNT or TTd with the calculated scattering of the TeNT model. We found that the calculated scattering of the homology TeNT model overlaid well with the scattering curves of both TeNT and TTd, (χ2 = 1.65 and χ2 = 1.28, respectively) (E). As for diphtheria, this suggests that tetanus toxin and toxoid are monomers in solution. However, contrary to diphtheria, the TeNT and TTd scattering curves were in lesser agreement and suggested a low degree of tertiary structural perturbations. Surprisingly, the homology model of TeNT aligned slightly better to the TTd (χ2 = 1.28) relative to the TeNT (χ2 = 1.65) (E). Next we explored whether we could improve the homology model of TeNT by using rigid body modeling using SASREF,Citation26 where the 3 domains were allowed to move as independent rigid bodies, but fixed by the interface contacts as suggested by the BoTN crystal structure. However, we found that the model that best explains the experimental solution scattering is the unmodified homology model (results not shown). This suggests a conservation of the orientation of domains in TeNT and BoNT structures. Finally, we also performed 3-dimensional ab initio shape reconstructions. For DT and DTd, the P1 ensembles showed compact and globular molecular shapes, wherein the crystal structure of the DT monomer (1MDT) docks well (, E and F). Comparison of DT and DTd ab initio shapes revealed that formaldehyde treatment resulted in no SAXS-observable effects on the tertiary protein structure. Similarly, the resulting P1 ensembles for TeNT and TTd showed highly similar and elongated molecules, wherein we could reasonably dock the BoNT-based TeNT homology model (, F and G). This docking into both ensembles is supported by the close CRYSOL fit between the experimental scattering curve of TeNT and the theoretical curve based on the TeNT model (E). Hence, tetanus SAXS analysis show that there are no significant SAXS observable modifications of TTd due to formaldehyde treatment, and also strongly implies, that we have created a homology model of the TeNT that credibly represents its actual solution structure at pH 7.2.
To accurately determine the mass of the investigated molecules, the toxins and toxoids were subjected to MALDI-TOF mass spectrometry analysis. The molecular masses of the toxins were determined to be 58.25 kDa for DT (Fig. S5A) and 149.7 kDa for TeNT (Fig. S5B), both closely matching the theoretical molecular masses of the mature toxins based on primary sequence (DT, 58.3 kDa; TeNT 150.5 kDa). However, as shown by SEC and SAXS results, the molecular masses of the toxoids were larger than the masses of the toxins and determined to be 61.62 kDa for DTd (Fig. S5C) and to 154.0 kDa for TTd (Fig. S5D). Besides the observed MW increase of DTd and TTd, for DT toxin and toxoid we observe that the peak broadens from a narrow peak of < 0.5 kDa (FWHM, full width at half maximum) to approx. 2.5 kDa (FWHM). For tetanus toxin and toxoid there is a peak broadening from approx. 2 kDa (FWHM) to approx. 4 kDa (FWHM). The broadening of the toxoid peaks corresponds to a more heterogeneous mass, a consequence of the detoxification treatment with formaldehyde. These observations gave consistent results on several batches of toxin and toxoid and the broadening is in agreement with the SDS-PAGE analysis (Fig. S2, A and B) that also shows heterogeneity of the products of formaldehyde-proteins reaction.
Figure 2. SAXS data on DT and DTd. (A) a plot of the scattering data for DT and DTd are shown in black and orange, respectively. They are shown as relative log (intensity) vs. inverse scattering angle. Inset shows the Guinier plot as log (intensity) vs. inverse scattering angle squared (s2). (B) the distance distribution function P(r). (C) overview of SAXS structural parameters. Rg is radius of gyration, Dmax is the longest dimension of the particle, V (Porod) is the excluded protein volume and MW is the estimated mass based on the Porod volume. (D) CRYSOL fit of the theoretical/calculated scattering of either the DT monomeric crystal structure (PDB code 1MDT) shown as red curve, or the dimer containing swapped catalytic domains (PDB code 1DDT) shown as blue curve. The fits were made against the experimental SAXS data of either the DT or the DTd, with only the former shown for clarity and depicted in black. The chi-values of the fits are shown in the inset table below the plot. (E) ab initio low resolution SAXS envelope of the DT toxin is shown as transparent gray envelope. The DT structure of the monomer was manually docked into the envelope, and rotated horizontally (below) and vertically (right). (F) ab initio low resolution SAXS envelope of the DTd
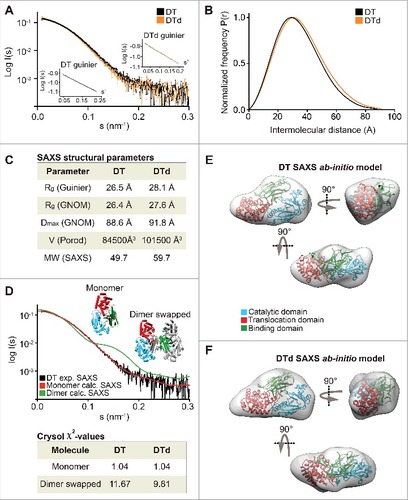
Figure 3. SAXS on TeNT and TTd. (A) plot of the scattering data for the TeNT (black) and TTd (orange), shown as relative log (intensity) vs. inverse scattering angle. Inset shows the Guinier plot as log (intensity) vs. inverse scattering angle squared (s2). (B) the distance distribution function P(r). (C) overview of SAXS structural parameters. Rg is radius of gyration, Dmax is the longest dimension of the particle, V (Porod) is the excluded protein volume and MW is the estimated mass based on the Porod volume. (D) TeNT structural homology model, generated using PHYRE2 based on the crystal structure of BoNT B (PDB code 1S0B).Citation36 BoNT, shown in gray, is aligned against the crystal structures of the TeNT catalytic domain (PDB code 1YVG)Citation9 shown in blue and the TeNT binding domain (PDB code 3HMY)Citation11 shown in green as well as the TeNT homology model shown in red. Only the translocation domain of TeNT is shown for clarity. (E) CRYSOL fit of the theoretical/calculated scattering of the PHYRE2 generated TeNT homology model shown as green curve against the experimental SAXS data of either TeNT or TTd, with only the former shown for clarity and depicted in black. The chi-values of the fits are shown in the inset table at the right of the plot. (F), ab initio low-resolution solution SAXS envelope (gray) of TeNT. The TeNT homology structural model was manually docked in the envelope, and rotated horizontally (below) and vertically (right). (G) ab initio low-resolution solution SAXS envelope (gray) of TTd
High quality-control standards are required by both international and European authorities to ensure consistent vaccine quality with animal testing as part of the quality control tests.Citation27-31 Due to the economical and ethical burdens associated with animal experimentation, several studies have been dedicated to determine in vitro guidelines that could be used for monitoring the quality and potency of the vaccines and lead to reduction in the number of animals used for these tests.Citation14-18,Citation32
Here, we used 2 novel methods to investigate the effect of formaldehyde detoxification on the thermal stability and structural integrity of TTd and DTd vaccine components produced and distributed by Statens Serum Institut. The DSF analysis clearly demonstrated a highly increased thermal stability of the toxoids and was confirmed by thermal stability measurements using CD. Previous studies using protein fluorescence spectroscopy in combination with guanidine-HClCitation15,Citation16 or differential scanning calorimetryCitation18 also confirm an increased stability of the toxoids compared with the toxins. However, to our knowledge, this is the first time DSF was applied in measuring a change in Tm, used as surrogate parameter for protein stability, between toxins and toxoids. The improved thermal stability can be ascribed to the formaldehyde detoxification treatment where the toxins form molecular crosslinks that stabilize the protein and improve the resistance to denaturizing conditions. Importantly, we could also use DSF to monitor the detoxification procedure as we showed a clear correlation between the gradual increase in Tm of TTd and the time of incubation with formaldehyde. Within the first 2 weeks of incubation with formaldehyde the Tm reaches a plateau as detoxification in the following weeks induced either small or insignificant thermal stability improvements. This correlates with the knowledge that the DT and TeNT are inactive after the first 2 weeks of formaldehyde detoxification procedure. The reason for longer incubation/inactivation time is to avoid the reversibility of formaldehyde reaction.Citation17,Citation33 Measuring the gradual thermal increase by CD analysis also revealed that a plateau is reached after the first 2 weeks. However, while DSF detects a large jump in Tm almost immediately after start of formaldehyde treatment CD does not detect a significant Tm increase until after the first week. A reason for this may be that the introduced crosslinks quickly renders the toxin resilient to temperature-induced exposure to hydrophobic surfaces while the stabilizing effect on secondary structures is delayed. In conclusion, DSF is a convenient and simple physicochemical in vitro method that could be included as a tool for monitoring the detoxification process. Therefore, together with additional in vitro methods, such as CD, SDS-PAGE and an antibody-binding assay, DSF could potentially reduce/replace in vivo toxicity experiments. However, these in vitro methods first need to be validated through comparative analysis where the toxoids under production must be tested in vivo along with the DSF analysis to establish the correlation between the thermal stability and the toxicity of the toxoids. If such correlation is established, the in vitro methods including DSF analysis will not only contribute to reducing the cost and ethical considerations associated with animal experiments, but it will also reduce the time required for quality controlling the toxoids.
Maintenance of the structural integrity is important for conserving neutralizing epitopes on the toxoids. Although not reflected in the secondary structure crosslinking of the toxin may result in changes of the overall shape and structure. To investigate the overall shape in solution of the diphtheria and tetanus toxoids in comparison to the toxins we decided to perform SAXS analysis. This analysis revealed that the SEC-purified toxins and toxoids are highly monodisperse monomers in solution. The SAXS analysis revealed that the toxoids have an increased hydrodynamic volume after formaldehyde treatment when compared with the respective toxins. This increase in size is supported by both our SEC and MS results and similar observations are reported in other studiesCitation15,Citation17,Citation18,Citation32-34 and explained by the added modifications upon formaldehyde treatment. The SAXS analysis estimated the average MW differences between the toxoids and the toxins to ∼13 kDa for tetanus and ∼10 kDa for diphtheria, respectively. Interestingly, the discrepancies in molecular masses between the toxoids and the toxins determined by MS are considerably lower than the mass discrepancies estimated by SEC and SAXS analysis, summarized in Table S1. This discrepancy is possibly due to that SEC and SAXS methods estimate proteins masses based on the average volume occupied by the molecules in solution and not by direct measurements of the molecular mass as achieved through MS. However, ultimately this confirms that formaldehyde-treated toxoids have a significantly higher molecular mass compared with untreated toxins. Furthermore, the structural information from SAXS in combination with known atomic structures of the toxins showed that the toxoids and the toxins have a similar overall shape and no obvious tertiary structural re-arrangements could be detected. However, the SAXS analysis cannot rule out that minor tertiary structure deviations are present between the toxins and toxoids. In fact, minor deviations were detected by the near-UV CD analysis where an increase of the CD signal intensity difference for both tetanus and diphtheria toxoids was observed compared with the respective toxins. This indicates the presence of minor tertiary structural / aromatic residues changes due to formaldehyde treatment. Finally, besides revealing the first solution structures of diphtheria and tetanus toxoids, the TeNT SAXS structure allowed us to perform the first low-resolution structural reconstruction of full-length TeNT. The overall structure revealed that the shape of the toxin is similar to BoNT. Based on the homology modeling of TeNT, this is not surprising as TeNT can be modeled with high confidence to look like BoNT. Currently, there is no high-resolution structural data that includes the translocation domain of TeNT. For both TeNT and TTd part of the modeled translocation domain did not fit into the SAXS surface reconstruction. This suggests that the extended helical structure seen in the translocation domain of BoNT is significantly shorter in TeNT. However, based on secondary structure prediction of TeNT, using only the primary amino acid sequence and PSI-PRED,Citation35 there is a good agreement between the PSI-PRED prediction and the PHYRE2 generated TeNT model regarding the position and the helical content of the translocation domain when compared with BoNT translocation domain known structure (data not shown). Also, we saw no systematic deviations in the CRYSOL fit of the theoretical and experimental scattering curves. This suggests that the homology model represents well the actual structure in solution. Thus, the length of the translocation domain in TeNT is likely not considerably different, but could be modestly shorter compared with BoNT.
Abbreviations
| BoNT | = | botulinum toxin. |
| CD | = | circular dichroism; |
| DSF | = | differential scanning fluorimetry; |
| DT | = | diphtheria toxin; |
| DTd | = | diphtheria toxoid; |
| NSD | = | normalized spatial discrepancy; |
| MS | = | mass spectrometry; |
| SAXS | = | small-angle X-ray scattering; |
| SEC | = | size exclusion chromatography; |
| TeNT | = | tetanus toxin; |
| TTd | = | tetanus toxoid; |
Disclosure of potential conflicts of interest
No potential conflicts of interest were disclosed.
Author contributions
H.A., E.D. and R.J. conceived and designed the experiments. H.A. performed SEC and DSF experiments and analysis. H.A. and E.D. performed SAXS data collection and analysis. H.A. and M.B. performed the CD experiments and data analysis. O.Ø. performed the molecular mass determination by MALDI-TOF analysis. J.W.P. and M.P.K. produced and supplied the toxins and toxoids. R.J. provided the funding for this work. H.A., E.D. and R.J. wrote the paper with review and contributions from all the listed authors.
KVIR_S_1321726.zip
Download Zip (776 KB)Acknowledgments
We are thankful to Tomás Plivelic at SAXS beamline I911–4 MAX-II Laboratory (Lund, Sweden) for help with SAXS data collection; the MX beamline staff at I911–2, at MAX-II Laboratory (Lund, Sweden). We also thank Grethe Jensen and Professor Lise Arleth from the Niels Bohr Institute at Copenhagen University for initial SAXS analysis and data collection at Copenhagen University.
Funding
This work was supported by the DFF-Sapere Aude Starting Grant from the Danish Council for Independent Research (grant number 11–104831/FSS). Access to synchrotron beam time was made possible by support from DANSCATT.
References
- Bennett MJ, Eisenberg D. Refined structure of monomeric diphtheria toxin at 2.3 A resolution. Protein Sci 1994; 3:1464–75; PMID:7833808; https://doi.org/https://doi.org/10.1002/pro.5560030912
- Choe S, Bennett MJ, Fujii G, Curmi PM, Kantardjieff KA, Collier RJ, Eisenberg D. The crystal structure of diphtheria toxin. Nature 1992; 357:216–22; PMID:1589020; https://doi.org/https://doi.org/10.1038/357216a0
- Collier RJ. Effect of diphtheria toxin on protein synthesis: inactivation of one of the transfer factors. J Mol Biol 1967; 25:83–98; https://doi.org/https://doi.org/10.1016/0022-2836(67)90280-X
- Bennett MJ, Choe S, Eisenberg D. Refined structure of dimeric diphtheria toxin at 2.0 A resolution. Protein Sci 1994; 3:1444–63; PMID:7833807; https://doi.org/https://doi.org/10.1002/pro.5560030911
- Qazi O, Bolgiano B, Crane D, Svergun DI, Konarev PV, Yao ZP, Robinson CV, Brown KA, Fairweather N. The HC fragment of tetanus toxin forms stable, concentration-dependent dimers via an intermolecular disulphide bond. J Mol Biol 2007; 365:123–34; https://doi.org/https://doi.org/10.1016/j.jmb.2006.09.050
- Breidenbach MA, Brunger AT. 2.3 A crystal structure of tetanus neurotoxin light chain. Biochemistry 2005; 44:7450–7; PMID:15895988; https://doi.org/https://doi.org/10.1021/bi050262j
- Fotinou C, Emsley P, Black I, Ando H, Ishida H, Kiso M, Sinha KA, Fairweather NF, Isaacs NW. The crystal structure of tetanus toxin Hc fragment complexed with a synthetic GT1b analogue suggests cross-linking between ganglioside receptors and the toxin. J Biol Chem 2001; 276:32274–81; https://doi.org/https://doi.org/10.1074/jbc.M103285200
- Umland TC, Wingert LM, Swaminathan S, Furey WF, Schmidt JJ, Sax M. Structure of the receptor binding fragment HC of tetanus neurotoxin. Nat Struct Biol 1997; 4:788–92; https://doi.org/https://doi.org/10.1038/nsb1097-788
- Rao KN, Kumaran D, Binz T, Swaminathan S. Structural analysis of the catalytic domain of tetanus neurotoxin. Toxicon 2005; 45:929–39; PMID:15904688; https://doi.org/https://doi.org/10.1016/j.toxicon.2005.02.032
- Guo J, Pan X, Zhao Y, Chen S. Engineering Clostridia Neurotoxins with elevated catalytic activity. Toxicon 2013; 74:158–66; PMID:23994593; https://doi.org/https://doi.org/10.1016/j.toxicon.2013.08.055
- Chen C, Fu Z, Kim JJ, Barbieri JT, Baldwin MR. Gangliosides as high affinity receptors for tetanus neurotoxin. J Biol Chem 2009; 284:26569–77; https://doi.org/https://doi.org/10.1074/jbc.M109.027391
- Schiavo G, Poulain B, Rossetto O, Benfenati F, Tauc L, Montecucco C. Tetanus toxin is a zinc protein and its inhibition of neurotransmitter release and protease activity depend on zinc. EMBO J 1992; 11:3577–83; PMID:1396558
- Puchtler H, Meloan SN. On the chemistry of formaldehyde fixation and its effects on immunohistochemical reactions. Histochemistry 1985; 82:201–4; PMID:3997553; https://doi.org/https://doi.org/10.1007/BF00501395
- Metz B, Hendriksen CF, Jiskoot W, Kersten GF. Reduction of animal use in human vaccine quality control: opportunities and problems. Vaccine 2002; 20:2411–30; PMID:12057596; https://doi.org/https://doi.org/10.1016/S0264-410X(02)00192-5
- Metz B, Jiskoot W, Hennink WE, Crommelin DJ, Kersten GF. Physicochemical and immunochemical techniques predict the quality of diphtheria toxoid vaccines. Vaccine 2003; 22:156–67; PMID:14615142; https://doi.org/https://doi.org/10.1016/j.vaccine.2003.08.003
- Metz B, Jiskoot W, Mekkes D, Kingma R, Hennink WE, Crommelin DJ, Kersten GF. Quality control of routine, experimental and real-time aged diphtheria toxoids by in vitro analytical techniques. Vaccine 2007; 25:6863–71; PMID:17707558; https://doi.org/https://doi.org/10.1016/j.vaccine.2007.07.009
- Thaysen-Andersen M, Jorgensen SB, Wilhelmsen ES, Petersen JW, Hojrup P. Investigation of the detoxification mechanism of formaldehyde-treated tetanus toxin. Vaccine 2007; 25:2213–27; PMID:17240009; https://doi.org/https://doi.org/10.1016/j.vaccine.2006.12.033
- Metz B, Tilstra W, van der Put R, Spruit N, van den Ijssel J, Robert J, Hendriksen C, Kersten G. Physicochemical and immunochemical assays for monitoring consistent production of tetanus toxoid. Biologicals 2013; 41:231–7; PMID:23726755; https://doi.org/https://doi.org/10.1016/j.biologicals.2013.05.001
- Johansen P, Merkle HP, Gander B. Physico-chemical and antigenic properties of tetanus and diphtheria toxoids and steps towards improved stability. Biochim Et Biophys Acta 1998; 1425:425–36; https://doi.org/https://doi.org/10.1016/S0304-4165(98)00097-X
- Micsonai A, Wien F, Kernya L, Lee YH, Goto Y, Refregiers M, Kardos J. Accurate secondary structure prediction and fold recognition for circular dichroism spectroscopy. Proc Natl Acad Sci U S A 2015; 112(24):E3095–103; https://doi.org/https://doi.org/10.1073/pnas.1500851112
- Niesen FH, Berglund H, Vedadi M. The use of differential scanning fluorimetry to detect ligand interactions that promote protein stability. Nat Protocols 2007; 2:2212–21; PMID:17853878; https://doi.org/https://doi.org/10.1038/nprot.2007.321
- Boivin S, Kozak S, Meijers R. Optimization of protein purification and characterization using Thermofluor screens. Protein Expr Purif 2013; 91:192–206; https://doi.org/https://doi.org/10.1016/j.pep.2013.08.002
- Mertens HD, Svergun DI. Structural characterization of proteins and complexes using small-angle X-ray solution scattering. J Struct Biol 2010; 172:128–41; https://doi.org/https://doi.org/10.1016/j.jsb.2010.06.012
- Putnam CD, Hammel M, Hura GL, Tainer JA. X-ray solution scattering (SAXS) combined with crystallography and computation: defining accurate macromolecular structures, conformations and assemblies in solution. Quarterly Rev Biophys 2007; 40:191–285; https://doi.org/https://doi.org/10.1017/S0033583507004635
- Svergun D, Barberato C, Koch MHJ. CRYSOL - a Program to evaluate X-ray solution scattering of biological macromolecules from atomic coordinates. J Applied Crystallography 1995; 28:768–73; https://doi.org/https://doi.org/10.1107/S0021889895007047
- Petoukhov MV, Svergun DI. Global rigid body modeling of macromolecular complexes against small-angle scattering data. Biophys J 2005; 89:1237–50; https://doi.org/https://doi.org/10.1529/biophysj.105.064154
- Kreeftenberg JG. Developments in the reduction refinement and replacement of animal tests in the quality control of immunobiologicals. Dev Biol Stand 1999; 101:13–7
- Zoon K, Garnick R. Definition of a well-characterized biotechnology product. Dev Biol Stand 1998; 96:191–7
- Zoon KC. Well-characterized biotechnology products: evolving to meet the needs of the 21st century. Dev Biol Stand 1998; 96:3–8
- Gupta RK. A need to review regulations for production and control of vaccines. Vaccine 1997; 15:1–2; PMID:9041657; https://doi.org/https://doi.org/10.1016/S0264-410X(96)00160-0
- Castle P. Combined vaccines: policy and practice in the European Pharmacopoeia. Biologicals 1994; 22:381–7; PMID:7779365; https://doi.org/https://doi.org/10.1006/biol.1994.1058
- Metz B KG, de Jong A, Meiring H, ten Hove J, Hennink WE, Crommelin DJA, Jiskoot W. Identification of formaldehyde-induced modifications in proteins: reactions with diphtheria toxin. In: Structural Characterisation Of Diphtheria Toxoid. Proefschrift Universiteit Utrecht 2005; 7:139–54
- Metz B, Kersten GF, Hoogerhout P, Brugghe HF, Timmermans HA, de Jong A, Meiring H, ten Hove J, Hennink WE, Crommelin DJ, et al. Identification of formaldehyde-induced modifications in proteins: reactions with model peptides. J Biol Chem 2004; 279:6235–43; https://doi.org/https://doi.org/10.1074/jbc.M310752200
- Metz B, Kersten GF, Baart GJ, de Jong A, Meiring H, ten Hove J, van Steenbergen MJ, Hennink WE, Crommelin DJ, Jiskoot W. Identification of formaldehyde-induced modifications in proteins: reactions with insulin. Bioconjugate Chem 2006; 17:815–22; https://doi.org/https://doi.org/10.1021/bc050340f
- Jones DT. Protein secondary structure prediction based on position-specific scoring matrices. J Mol Biol 1999; 292:195–202; https://doi.org/https://doi.org/10.1006/jmbi.1999.3091
- Eswaramoorthy S, Kumaran D, Keller J, Swaminathan S. Role of metals in the biological activity of Clostridium botulinum neurotoxins. Biochemistry 2004; 43:2209–16; PMID:14979717; https://doi.org/https://doi.org/10.1021/bi035844k