
ABSTRACT
Epigenetic mechanisms have been proposed to translate environmental stimuli into heritable transgenerational phenotypic variations that can significantly influence natural selection. An intriguing example is exposure to pathogens, which imposes selection for host resistance. To test this hypothesis, we used larvae of the greater wax moth Galleria mellonella as model host to experimentally select for resistance to Bacillus thuringiensis (Bt), the most widely used bacterial agent for the biological control of pest insects. To determine whether epigenetic mechanisms contribute to the evolution of resistance against pathogens, we exposed G. mellonella larvae over 30 generations to spores and crystals mix of Bt and compared epigenetic markers in this selected line, exhibiting almost 11-fold enhanced resistance against Bt, to those in a non-selected control population. We found that experimental selection influenced acetylation of specific histones and DNA methylation as well as transcription of genes encoding the enzymatic writers and erasers of these epigenetic mechanisms. Using microarray analysis, we also observed differences in the expression of conserved miRNAs in the resistant and susceptible larvae, resulting in the repression of candidate genes that confer susceptibility to Bt. By combining in silico minimum free energy hybridization with RT-PCR experiments, we identified the functions and biological processes associated with the mRNAs targeted by these miRNAs. Our results suggest that epigenetic mechanisms operating at the pre-transcriptional and post-transcriptional levels contribute to the transgenerational inherited transcriptional reprogramming of stress and immunity-related genes, ultimately providing a mechanism for the evolution of insect resistance to pathogen.
Introduction
The primary molecular mechanism underlying Charles Darwin's theory of evolution by natural selection involves DNA sequence mutations and chromosomal alterations that result in heritable phenotypic variation. The environment facilitates natural selection even though most environmental factors cannot directly alter the DNA sequence. More recent concepts in evolutionary biology postulate that the translation of environmental stimuli into heritable phenotypic alterations can also be mediated by epigenetic mechanisms.Citation1 To test this hypothesis we exposed a well-established model host insect to a bacterial pathogen (environmental stimulus) in a manner allowing experimental selection for resistance (altered phenotype). Using a transgenerational approach, we compared the selected (resistant) line with a non-selected (susceptible) population to investigate changes in epigenetic markers.
Bacillus thuringiensis (Bt) was used for the experimental insect selection for resistance because it is the best-studied entomopathogen and economically the most important biopesticide used to control pest and vector insects. This Gram-positive bacterium produces several virulence factors, including endotoxins such as Cry or Cyt, enterotoxins, hemolysins, phospholipases and metalloproteases, which are transcribed in the vegetative cells and play an important role in the infection process.Citation2,3 A pioneering study demonstrates experimental coevolution between Bt and Caenorhabditis elegans favors bacterial virulence through manipulation of genes encoding nematocidal toxins.Citation4 Mechanisms underlying the emerging resistance against Bt toxins in insects is well understood but this is not the case when considering the evolution of resistance against Bt infections.Citation5-8 We used larvae of the greater wax moth Galleria mellonella as a surrogate model host for the transgenerational selection experiments, because this species is widely used to study coevolution between insects and their pathogens.Citation9-12 Furthermore, G. mellonella has recently emerged as a model to study the epigenetic basis of disease.Citation13
Our hypothesis to explore the role of epigenetics in the evolution of insect resistance to Bt was inspired by our previous work showing that G. mellonella undergoes immunophysiological adaptation during experimental selection for resistance against Bt. Our comparative gene expression analysis of non-selected (susceptible) and selected (resistant) populations revealed that host adaptations are achieved by the transcriptional reprogramming of stress and immunity-related genes in the gut and in the fat body.Citation14 We observed a rapid loss of susceptibility to Bt upon experimental selection because the selected G. mellonella line achieved an 8.8-fold fold increase in resistance after 20 generations compared with the susceptible control line.
In this follow-up study, we selected G. mellonella for resistance against Bt over 30 generations. The selected line displayed almost 11-fold enhanced resistance compared with the susceptible control line, allowing us to investigate epigenetic adaptations associated with the evolution of resistance. We used our comprehensive G. mellonella transcriptome data set including immunity-related genes and microRNAsCitation15,16 to study epigenetic mechanisms controlling gene expression at both at the pre-transcriptional and post-transcriptional levels.
The regulation of gene expression before the initiation of transcription is mediated by the chemical modification of DNA or the proteins (predominantly histones) that maintain DNA as chromatin. The addition of methyl groups to DNA cytidine residues results in the formation of 5-methylcytidine, which influences DNA interactions with proteins thus providing a mechanism for gene regulation. Evolutionarily conserved DNA methyltransferases (DNMTs) mediate the transfer of methyl groups, and the degree of DNA methylation in genomes can be quantified using enzymatic assays.Citation17 To investigate the transcriptional activation of DNA methylation markers in G. mellonella during experimental selection for resistance against Bt, we studied genes which were previously shown to be differentially expressed during fungal infection.Citation18
Another epigenetic mechanism operating at the pre-transcriptional level is the acetylation of histones by histone acetyltransferases (HATs). The latter generate a chromatin structure that promotes DNA accessibility and hence gene expression, whereas the removal of acetyl groups by histone deacetylases (HDACs) generates a condensed form of chromatin that silences gene expression. These 2 groups of enzymes with opposing activities modify chromatin structure and thereby control the ability of transcription factors to access DNA. Chromatin remodeling by histone modification is known to occur during bacterial infections.Citation13,19 Using G. mellonella as a model host, we have previously demonstrated that histone acetylation/deacetylation is involved in the regulation of transcriptional reprogramming during metamorphosis, wounding and infection.Citation20
The regulation of gene expression in eukaryotes at the post-transcriptional level often involves microRNAs (miRNAs), which are short non-coding RNAs (∼18–24 nucleotides in length) that control protein synthesis by base-pairing with the 3′ untranslated regions (UTRs) of target mRNAs (mRNAs), triggering their degradation and inhibiting translation.Citation21 We have recently developed microarrays to investigate the role of miRNAs in G. mellonella immunity.Citation16 We used these microarrays here to screen for miRNAs that are differentially expressed upon experimental insect selection for resistance against Bt. Taken together, our results provides evidence that epigenetic mechanisms operating at both the pre-transcriptional and post-transcriptional levels mediate the evolution of insect resistance against Bt.
Results
Resistance to Bt is associated with tissue-specific changes in DNA methylation
After 30 generations of selection, we found that larvae from the line continuously exposed to Bt (selected line) were resistant in 10.8-fold (resistance ratio, RR) to the pathogen than those with no exposure (non-selected line). We isolated DNA from the midgut and fat body of resistant and susceptible larvae for the antibody-based detection of global DNA methylation because the midgut is the prime location for insects defense reactions against intestinal Bt infection, and fat bodies is responsible for systemic immune response. The levels of 5-methylcytosine in the midgut and fat body of the resistant larvae were higher than in the corresponding susceptible larvae (). The differences in global DNA methylation were tissue-specific, e.g. DNA methylation levels in the resistant larvae were higher in the fat bodies than the midguts (p < 0.0005) but no such differences were observed in the susceptible larvae.
Figure 1. Midgut and fat body-specific changes in DNA methylation in uninfected Bt-resistant G. mellonella larvae. (A) Global DNA methylation level in the midgut and fat body of uninfected Bt-resistant G. mellonella larvae (resistant line) and uninfected susceptible larvae (susceptible line) (### p < 0.0005 - compared with susceptible line for the same organ). (B) Transcriptional activation of the DNA methyltransferase 1-associated protein 1 and DNA cytosine-5 methyltransferase genes in the fat body and midgut of uninfected Bt-resistant G. mellonella larvae relative to expression in the fat body and midgut of uninfected susceptible larvae (## p < 0.005 – compared with fold expression in the midgut and fat body of susceptible line). The 18S rRNA housekeeping gene was used for internal data normalization. Data are means of 3 independent experiments with standard deviations
We also observed the relative upregulation of genes encoding DNA methyltransferase 1-associated protein 1 and DNA cytosine 5-methyltransferase in the fat bodies of resistant larvae compared with susceptible larvae (). Interestingly, the same genes were more strongly induced in the fat body and midgut of the susceptible larvae when they were challenged with Bt, compared with unchallenged controls from the same susceptible line (). In contrast, these genes were downregulated in the midgut of resistant larvae exposed to Bt, compared with unchallenged controls from the same resistant line.
Figure 2. DNA methylation-specific gene expression in the midgut and fat body of Bt-infected resistant and susceptible G. mellonella larvae. The expression of the DNA methyltransferase 1-associated protein 1 and DNA cytosine 5-methyltransferase genes were measured in the midgut and fat body of resistant and susceptible G. mellonella larvae infected with Bt. The values were normalized to the midgut and fat body expression profiles of the corresponding uninfected resistant and uninfected susceptible larvae. The 18S rRNA housekeeping gene was used for internal data normalization. Data are means of 3 independent experiments with standard deviations (#p < 0.05, ## p < 0.005, ### p < 0.0005- fold expression in the fat body and midgut of infected susceptible line and infected resistant line were compared with fold expression of uninfected susceptible line and uninfected resistant line for the same organ respectively)
Resistance to Bt is associated with tissue-specific changes in histone acetylation
The acetylation of specific core histones was measured by enzyme-linked immunosorbent assay (ELISA) in the resistant and susceptible larvae using specific antibodies for each histone. We selected histones H3 and H4 to determine global acetylation levels because they are involved in the transcriptional control of immunity and development in eukaryotes, although their specific role in insect immunity is unclear. In the resistant larvae, we observed higher levels of histone H3 and H4 acetylation in the midgut, and higher levels of H4 acetylation in the fat body, compared with susceptible larvae (–). We also detected higher level of H3 acetylation in the midgut compared with fat body of resistant larvae () (p < 0.05).
Figure 3. Midgut and fat body-specific changes in global histone H3 and H4 acetylation in uninfected Bt-resistant G. mellonella larvae. Global histone (A) H3 and (B) H4 acetylation levels in the midgut and fat body of uninfected Bt-resistant G. mellonella larvae relative to uninfected susceptible larvae. Data are means of 3 independent experiments with standard deviations (# p < 0.05, ### p < 0.0005- compared with uninfected susceptible line for the same organ)
We also investigated the erasers and writers of histone acetylation in Bt-resistant larvae by measuring the expression of genes encoding HDACs and HATs. The genes encoding HDAC 8, HDAC 8 iso, HDAC complex subunit, HDAC complex subunit sap18, HAT1, HAT tip60 and HAT type b catalytic were all upregulated in the midgut and fat body of uninfected resistant larvae compared with uninfected susceptible larvae (). In contrast, the same genes were downregulated in the midgut and fat body of solely the resistant larvae and not the susceptible larvae when challenged with Bt (–). HDACs and HATs were upregulated in the midgut and fat body of susceptible larvae infected with Bt compared with the same tissues in unchallenged larvae (). The expression profiles of HDACs and HATs following infection were distinct in larvae from the resistant and susceptible lines (–).
Figure 4. Midgut and fat body-specific changes in the expression of HDACs and HATs in uninfected Bt-resistant G. mellonella larvae. Transcriptional activation of genes encoding HDAC 8, HDAC 8 iso, HDAC complex, HDAC sap18, HAT1, HAT type b and HAT tip60 in the fat body and midgut of uninfected resistant G. mellonella larvae relative to expression in the fat body and midgut of uninfected susceptible larvae. The 18S rRNA housekeeping gene was used for internal data normalization. Data are means of 3 independent experiments with standard deviations (# p < 0.005, ### p < 0.0005 – compared with fold expression in the midgut and fat body of susceptible line)

Figure 5. Expression of genes encoding HDACs and HATs in the midgut and fat body of Bt-resistant and susceptible G. mellonella larvae infected with Bt. Transcriptional activation of genes encoding HDAC 8, HDAC 8 iso, HDAC complex, HDAC sap18, HAT1, HAT type b and HAT tip60 in the midgut and fat body of (A) Bt infected susceptible line (# p < 0.05, ## p < 0.005– compared with fold expression in the midgut and fat body of uninfected susceptible line) and (B) Bt-infected resistant G. mellonella larvae (# p < 0.05, ## p < 0.005, ### p < 0.0005– compared with fold expression in the midgut and fat body of uninfected resistant line). The values were normalized to the expression profile in the midgut and fat body of corresponding uninfected resistant and uninfected susceptible larvae. The 18S rRNA housekeeping gene was used for internal data normalization. Data are means of 3 independent experiments with standard deviations
Differential regulation of miRNAs in resistant and susceptible larvae
The expression of miRNAs in the midgut of resistant and susceptible larvae was measured by designing a DNA oligonucleotide microarray containing 2621 unique mature arthropod miRNA sequences from miRBase v21 because a complete G. mellonella genome sequence is not available.Citation16 The miRNA sequences were derived from diverse insect species including the fruit fly, honey bee, pea aphid, silk worm and red flour beetle (1735, 259, 103, 560 and 422 unique mature miRNAs, respectively). All probes representing unique mature miRNAs were printed in triplicate for signal verification. We detected the differential expression of 1296 miRNAs in unchallenged resistant larvae, and 1295 and 1456 miRNAs in susceptible and resistant larvae infected with Bt, when uninfected susceptible larvae were used for comparison (Fig. S1–3). We found that 1364 and 1372 miRNAs were induced in resistant larvae relative to infected susceptible larvae and unchallenged resistant larvae, respectively (Figs. S4 and 5). Finally, we observed the expression of 1159 miRNAs in infected resistant larvae relative to the infected susceptible population (Fig. S6).
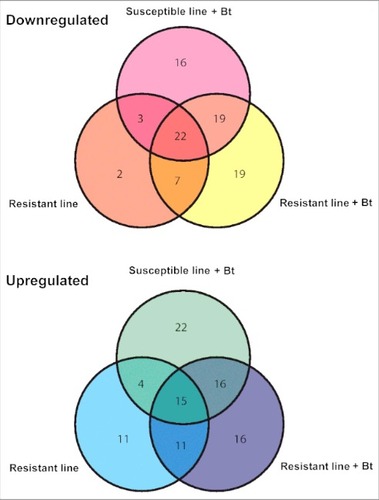
After removing duplicates that were expressed in the infected resistant and susceptible larvae, we selected 173 miRNAs with significant differential expression levels (p < 0.01) compared with unchallenged susceptible larvae (–). We found 16, 19 and 2 miRNAs that were specifically downregulated and 22, 16 and 11 miRNAs that were specifically upregulated in infected susceptible, infected resistant and uninfected resistant larvae, respectively (). We identified 7 and 11 miRNAs that were downregulated to upregulated, respectively, when we compared infected and uninfected resistant larvae. Similarly, we found 19 and 16 miRNAs that were downregulated to upregulated, respectively, when we compared infected susceptible and resistant larvae. Finally, 22 and 15 miRNAs were commonly downregulated and upregulated, respectively, in all 3 lines compared with the uninfected susceptible larvae ().
Figure 6. Distribution of expressed miRNAs in the midgut of Bt-resistant and susceptible G. mellonella larvae infected with Bt. The miRNA sequences were obtained from miRBase v21 and their expression profiles were determined by microarray analysis. The figure (A-E) represent significantly expressed miRNAs in infected susceptible and resistant larvae, and uninfected resistant larvae. The fold differences are expression levels relative to uninfected susceptible larvae
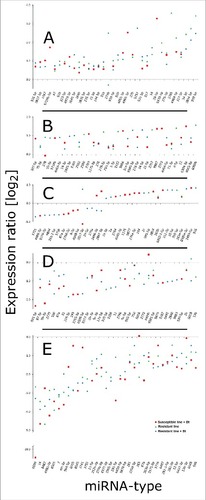
Figure 7. Venn diagram showing the differential expression of miRNAs in the midgut of infected and uninfected Bt-resistant or susceptible G. mellonella larvae. The miRNA sequences were obtained from miRBase v21 and their expression profiles were determined by microarray analysis. The fold differences of downregulated and upregulated miRNAs are shown relative to uninfected susceptible G. mellonella larvae (p < 0.01)
Identification and experimental verification of miRNA targets involved insect resistance to Bt
To compensate for the lack of a complete G. mellonella genome sequence, the mRNA targets of selected miRNAs identified by microarray analysis were tested using the sequenced G. mellonella transcriptome.Citation15 We identified mRNA targets for 33 of the miRNAs and analyzed their corresponding biological processes (Fig. S7) and molecular functions (Table S1). Our results indicated that the majority of miRNAs in resistant and susceptible larvae target biological processes such as metabolism, transcription, DNA damage and repair mechanisms, cell division, and epigenetic mechanisms. The identified miRNA targets were confirmed using the RNA hybrid software, which calculates the minimum free energy required to hybridize a miRNA to the best-fitting part of the corresponding mRNA while excluding intramolecular hybridization (Table S2). The software indicated that complete seed sequence complementarity preceded miRNA–mRNA duplex formation, thus confirming the targets we identified.
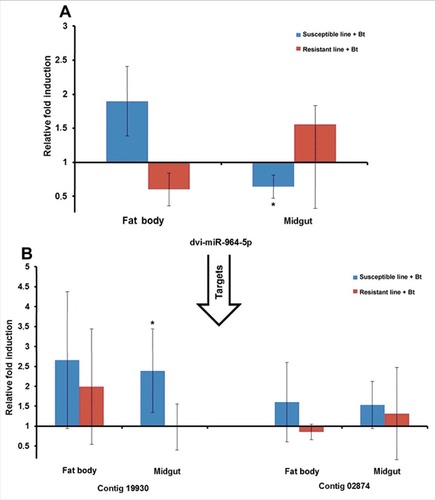
The miRNAs and their mRNA targets predicted in silico were experimentally verified by measuring their relative expression levels by RT-PCR. We selected miR-3718b, miR-31–5p, miR-964–5p and miR-317 because of their relatively high expression levels in resistant or susceptible larvae. For example, we observed the induction of aga-miR-317 in the midgut of infected resistant larvae relative to uninfected resistant larvae by RT-PCR, as predicted by microarray analysis (). Interestingly, this particular miRNA was also upregulated in the fat body of infected susceptible larvae relative to uninfected susceptible larvae (). The identified target (contig 3714) was downregulated in the fat body of infected resistant larvae relative to uninfected resistant larvae (). Another target (contig 3616) was upregulated in the fat body of infected susceptible larvae compared with uninfected susceptible larvae (). Similarly, dvi-miR-964–5p was downregulated in the midgut of infected susceptible larvae relative to uninfected susceptible larvae, as predicted by microarray analysis (), whereas its target (contig 19930) was upregulated in the midgut of infected susceptible larvae (). We also analyzed the expression of ame-miR-3718b (Fig. S8A-B) and tca-miR-31–5p (Fig. S9A-B) and their mRNA targets using the same sample set.
Figure 8. Differential expression of miRNAs and predicted target mRNAs in infected Bt-resistant and susceptible G. mellonella larvae. The miRNAs identified by microarray analysis and their predicted mRNA targets were validated by RT-PCR to confirm differential expression in infected Bt-resistant and susceptible G. mellonella larvae: (A) aga-miR-317; (B) contigs 3616, 3714 and 04123. The relative fold differences indicated for the miRNAs and mRNAs are normalized against bmo-miR-184–5p and 18S rRNA as the internal reference control. (# p < 0.05, ### p < 0.0005– fold expression in the fat body and midgut of infected susceptible line and infected resistant line were compared with fold expression of uninfected susceptible line and uninfected resistant line for the same organ respectively)
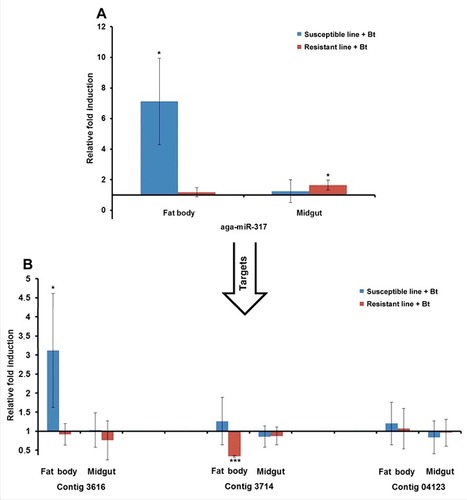
Figure 9. Differential expression of miRNAs and predicted target mRNAs in infected Bt-resistant and susceptible G. mellonella larvae. The miRNAs identified by microarray analysis and their predicted mRNA targets were validated by RT-PCR to confirm differential expression in infected resistant and susceptible G. mellonella larvae: (A) dvi-miR-964–5p; (B) contigs 19930 and 02874. The relative fold differences indicated for the miRNAs and mRNAs are normalized against bmo-miR-184–5p and 18S rRNA as the internal reference control. (# p < 0.05– fold expression in the fat body and midgut of infected susceptible line and infected resistant line were compared with fold expression of uninfected susceptible line and uninfected resistant line for the same organ respectively)
Discussion
Most models of evolutionary biology involve DNA sequence mutations as the primary molecular mechanism behind heritable phenotypic variation.Citation1,4 However, our understanding of evolutionary processes is increasingly influenced by insights from the burgeoning field of epigenetics, which does not require changes in the DNA sequence to explain the inheritance of novel traits in response to environmental stimuli such as pathogens.Citation22-24 Epigenetic mechanisms have been proposed to translate environmental stimuli into heritable transgenerational phenotypic variation that can significantly influence natural selection.Citation23 To test this hypothesis, we experimentally selected for adaptations to a changing complex parameter (resistance against Bt) to explore the role of underlying epigenetic mechanisms. We have previously reported that prolonged exposure to Bt for multiple generations can lead to the development of resistance in G. mellonella larvae under laboratory conditions, which is manifested by increased regeneration and amelioration of Bt toxin activity in the midgut and induced innate immune defense.Citation14 Accordingly, we have also shown that experimental selection for resistance against the parasitic fungus Beauveria bassiana results in transcriptional reprogramming of stress and immunity-related genes.Citation25 In this follow-up study, we used a similar experimental design and observed that susceptible G. mellonella larvae constantly exposed to Bt become 10.8 times more resistant than naïve larvae by generation 30. This resistant line was compared with a non-selected (susceptible) control population to study differences in DNA methylation, histone acetylation and miRNA expression.
Insect genomes are sparsely methylated compared with mammals, and information on the role of methylation in the context of innate immunity is limited.Citation26-28 We observed minor but distinct tissue-specific differences in the global DNA methylation levels of resistant and susceptible G. mellonella larvae, which indicated transcriptional repression. The induction of DNA methyltransferase 1-associated protein 1 in uninfected resistant larvae, and its downregulation when resistant larvae are infected with Bt, complements earlier observations because the function of this gene is to modulate transcription. The high-level basal expression of immunity-related genes was observed in the midgut and fat bodies of uninfected resistant larvae and the expression levels did not change significantly when they were infected with Bt, but more profound changes in expression were observed in infected susceptible larvae.Citation14 From this we conclude that induced immunity-related genes in Bt-resistant larvae are not regulated by DNA methylation and that the activation of immunity-related genes is maybe controlled by other epigenetic mechanisms such as histone acetylation. The variation of the induced or repressed gene expression levels may reflect the individual bandwidth within the sampled populations.
The addition or removal of acetyl groups on histones is tightly controlled by enzymes with opposing activities. HATs generate a chromatin structure that promotes DNA accessibility and gene expression, whereas the removal of acetyl groups by HDACs generates a condensed form of chromatin that silences gene expression. Core histones H3 and H4 are involved in the regulation of chromatin structure and the recruitment of transcription factors to promoters. The Bt-resistant G. mellonella line displayed differences in histone acetylation between the fat body and the midgut, agreeing with the observation that stress and immunity-related genes are differentially regulated in these organs following experimental selection for resistance.Citation14 In the midgut and fat bodies of uninfected Bt-resistant G. mellonella larvae, we observed the induction of histone acetylation represented by the percentage of acetylated core histones H3 and H4, and the balanced transcriptional induction of HDACs and HATs. The latter was reversed when resistant and susceptible larvae were infected with Bt. The acetylation of core histones was also tissue specific, i.e. H3 acetylation was more prevalent in the midgut and H4 acetylation was more prevalent in the fat bodies of the resistant larvae. Although the acetylation of histones H3 and H4 is associated with ecdysone biosynthesis during metamorphosis in Drosophila melanogaster, our data may suggest that the acetylation of these histones also plays a role in pathogen resistance. The comparison of susceptible and resistant G. mellonella larvae revealed the strong repression of HDACs and HATs in both the fat body and in the midgut of the resistant line () confirming that selection for resistance affects histone acetylation. This observation implicates that Bt can interfere with epigenetic mechanisms in the infected host resulting in a transgenerational impact on the phenotype. However, further studies are required to trace the shifts of epigenetics marks from one generation to another particularly in the egg germline.
The epigenetic regulation of gene expression at the post-transcriptional level has been attributed to miRNAs.Citation21,29,30 To explore the role of miRNAs in the development of resistance against Bt in G. mellonella we used our comprehensive transcriptome data set, which was enriched for developmental and immunity-related genes.Citation15 We also used microarrays imprinted with probes representing more than 2000 insect miRNA sequences deposited in miRBase (www.mirbase.org). These microarrays were used successfully for the first time to analyze the role of miRNAs in G. mellonella immunity.Citation16 Using this approach, we analyzed the expression profile of 2621 unique mature miRNAs and identified candidates that are expressed specifically in infected or uninfected resistant and susceptible larvae. For example, miR-9887, miR-9877, miR-3789 and miR-2784 were upregulated, and miR-991–5p, miR-3287, miR-193 and miR-278 were downregulated, in infected susceptible larvae compared with uninfected susceptible larvae. Similarly, miR-995–5p, miR-8–5p, miR-6000b and miR-3332 were upregulated, and miR-310–5p and miR-13b were downregulated, in uninfected Bt resistant larvae compared with uninfected susceptible larvae. In this manner we identified specific miRNAs that contribute to the evolution of Bt resistance in an insect model whose genome has been not yet sequenced.
This experimental design produced a comprehensive collection of miRNAs whose target mRNAs were identified using a comprehensive G. mellonella transcriptome to compensate for the lack of a complete genome sequence. The transcriptome data allowed us to identify potential 3′-UTRs and align them with the modulated miRNAs identified by microarray analysis, revealing 33 miRNAs and 112 corresponding target mRNAs. Putative functions were assigned based on annotated sequences in model insects. The in silico target predictions were validated by RT-PCR to confirm the co-expression of miRNAs and their mRNA targets. For example, the expression of aga-miR-317 in the midguts of infected resistant larvae relative to uninfected resistant larvae confirmed the microarray data and the function of 4 mRNAs associated with development and metamorphosis based on homologs in D. melanogaster.Citation31 The unexpected large number of miRNAs displaying differential expression in susceptible versus Bt-resistant G. mellonella suggests that the evolution of resistance is accompanied by the regulation of gene expression at the post-transcriptional level, but the role of specific miRNAs in this process is yet to be experimentally verified.
Conclusion
We have shown that insect resistance to Bt is achieved by prolonged exposure over 30 generations and is manifested not only by the stronger expression of stress and immunity-related genes but also by the coordinated reprograming of epigenetic mechanisms. Using complementary transcriptomic, proteomic and bioinformatic approaches we determined differences between resistant and susceptible larvae in terms of DNA methylation, histone acetylation and miRNA expression profiles. These differences translate into either the expression or repression of candidate genes that determine the sensitivity of insects to entomopathogens and their toxins. Taken together, our results support the hypothesis that epigenetic mechanisms operating at the pre-transcriptional and post-transcriptional levels could be involved in the translation of environmental stimuli such as pathogens into a heritable resistance phenotype.
Materials and methods
Insect rearing, B. thuringiensis infections and experimental design
The experimental and stock populations of G. mellonella were reared in strict isolation at 28°C, 60% relative humidity, with a 12-h photoperiod, and were fed on artificial medium (AM) containing 22.5% maize meal, 12.5% honey, 12.5% glycerol, 12.5% beeswax, 10% wheat flour, 12.5% milk solids, 5% yeast and 12.5% water. The entomopathogen Bacillus thuringiensis ssp. galleria, H-serotype V, strain 69–6 was provided by the ISEA bacterial collection.
Artificial selection was performed as described previously.Citation14 Briefly, the starting population of larvae was separated into 2 lines. The first was exposed to Bt and selected for increased resistance over 30 generations (resistant line) while the second was bred under the same conditions without exposure to Bt (susceptible line). Full details of the selection protocol are provided in the Supplementary text.
The uninfected resistant and susceptible larvae were compared in generation 30 to determine their sensitivity to Bt and to investigate whether epigenetic reprograming had occurred. Fourth-instar larvae were used in all experiments. Cohorts of uninfected resistant and susceptible larvae were starved for 2 h before exposure to different doses of Bt via the oral application of a spore-crystal mixture. The LC50 of the resistant line was divided by the LC50 of the susceptible line to quantify the degree of resistance. In a parallel study, fourth-instar insects from uninfected (resistant and susceptible lines) and infected larvae (resistant line + Bt, susceptible line + Bt) were collected 48 h post-exposure and the midgut and fat body were dissected for the isolation of RNA, DNA and histones (n = 9 larvae per treatment). Experiments were performed in triplicate. Full details of the bacterial culture and inoculation methods are provided in the Supplementary text.
Extraction of genomic DNA, RNA and histone proteins
Fat body and midgut epithelium was dissected from at least 3 chilled, surface-sterilized larvae per treatment and crushed with a pestle in cell lysis solution. Resistant and susceptible larvae were sampled 48 h after the oral administration of Bt and uninfected control larvae were sampled in parallel. Three replicate samples were collected per time point per line, and each of the triplicate samples comprised fat body or midgut epithelium from 3 individuals. DNA was isolated using the DNA sorb B kit (AmpliSens, K1–2–50-CE) according to the manufacturer's recommendations.
Total RNA was prepared by collecting samples in RNA-later (Ambion, AM7020), crushing under liquid nitrogen, and extracting the RNA using TRIzol® Reagent (Invitrogen, 15596018) according to the manufacturer's recommendations. RNA concentrations were determined by spectrophotometry.
Histones were analyzed by extracting the samples in 3 volumes of extraction buffer with glycerol on ice for 5 min following the manufacture's recommendations (EpigenTek). The supernatant was mixed with 100% trichloroacetic acid (TCA) and incubated on ice for 30 min. The precipitate was collected after centrifugation for 10 mins at 13523 × g at 4°C, washed twice with acetone and dissolved in water. The histone protein concentration was estimated using the bicinchoninic acid (BCA) method and the extract was aliquotted and stored at −80°C.
Measurement of global changes in DNA methylation
Global DNA methylation was measured using the MethylFlash™ Methylated DNA Quantification kit (EpigenTek, P-1034). DNA isolated from the midgut and fat body was coated onto 96-well plates (100 ng per sample). The methylated DNA was detected with capture and detection antibodies by measuring the absorbance at 450 nm using a microplate reader (BioTek). The relative percentage of methylated DNA in larvae from the resistant and susceptible lines was estimated using the formula provided in the manufacturer's protocol.
Measurement of global histone H3 and H4 acetylation
Global histone H3/H4 acetylation levels in Bt-resistant and susceptible larvae were determined using the EpiQuik™ global histone H3/H4 acetylation assay kit (EpigenTek, P-4008–48, P-4009–48) following the manufacturer's recommendations. Briefly, histone proteins (1–2 μg) were coated on the strip wells and acetylated histone H3/H4 was detected with a high-affinity antibody. The ratio in resistant and susceptible larvae was estimated using a horseradish peroxidase (HRP)-conjugated secondary antibody and the colorimetric signal was quantified by measuring the absorbance at 450 nm.
Microarray analysis of miRNAs
Microarray analysis of miRNAs was performed by LC Sciences, Houston, TX, USA. RNA isolated from the midgut of resistant and susceptible larvae (uninfected and infected) was extended using polyadenylate polymerase and ligated to an oligonucleotide tag labeled with a fluorescent dye for subsequent fluorescence detection in dual-sample experiments. Microarray hybridization, detection, and analysis were performed as described previously.Citation16 Further details on the reagents used, experimental procedure and analysis are provided in the Supplementary text.
Prediction of miRNA targets
The sequence alignment editor BioEdit was used to identify open reading frames (ORFs) in all contigs in the sequenced G. mellonella transcriptome.Citation15 Potential 3′-UTRs were detected by considering nucleotide sequences outside the confirmed ORFs at the 3′ end of individual contigs.Citation16 The miRNA sequences were aligned with the identified potential 3′-UTRs and seed region complementarity was determined to identify target mRNAs. The Gene Ontology categories of the identified contigs were listed by consulting the UniProt database and previous reports Citation15 (Table S1). The biologic processes targeted by miRNAs in the resistant and susceptible lines were summarized using Cytoscape v3.2.1 (http://www.cytoscape.org) (Fig. S1). The structure of miRNA–mRNA duplexes was visualized using the RNAhybrid tool provided by the Bielefeld Bioinformatics Server Citation32 (Table S2).
RT-PCR analysis
Relative miRNA and mRNA expression levels were determined by RT-PCR as described previously, using RNA from the midgut and fat bodies of resistant and susceptible (uninfected and infected) larvae.Citation33,34 For the analysis of miRNAs, cDNA was synthesized using the miScript II miRNA first-strand synthesis and qPCR kit (Qiagen, 218160) according to the manufacturer's instructions. Small RNA-enriched total RNA was reverse transcribed using miScript HiSpec buffer, oligo-dT primers with 3′ degenerate anchors and a 5′ universal tag sequence for the specific synthesis of mature miRNAs. The combination of polyadenylation and the universal tag ensures that miScript primer assays do not detect genomic DNA. Primers for the selected miRNAs were designed using the miScript miRNA product-design webpage (Qiagen). Candidate miRNA expression levels were normalized against bmo-miR-184–5p, which showed uniform expression across all samples. Real-time RT-PCR was performed using the Biorad (CFX 96) Mx3000P system, starting with a 15-min incubation at 95°C to activate the hot-start polymerase followed by 40 cycles at 94°C for 15 s, 55°C for 30 s and 70°C for 30 s. The following miRNA sequences were used for primer design: ame-miR-3718b (5′-UCG GGA CAG GAC AGG GGA CAG A-3′), tca-miR-31–5p (5′-GGC AAG AAG UCG GCA UAG CUG-3′), dvi-miR-964–5p (5′-UUA GAA UAG GGG AGC UUA ACU U-3′), and aga-miR-317 (5′-UGA ACA CAU CUG GUG GUA UCU CAG U-3′). The control miRNA sequence was bmo-miR-184–5p (5′-CCU UGU CAU UCU UCA GGC CCU G-3′).
The amplification of specific target mRNAs and genes coding for HDACs, HATs and DNMTs by RT-PCR was performed as described previouslyCitation15 using the following primer sequences: GME-string_Contig_3963.0-fwd/rev (5′-CAG TCC GGA ATG TCC TGT TT-3′/5′-GTG GAC AAC AAG AGC TGC AA-3′), GME-string_Contig_2236.0-fwd/rev (5′-TAC AGC ACC AGG GAA GCT CT-3′/5′-CAT GTT CTG GAA GCG AGG TT-3′), GME-string_Contig_4315.0-fwd/rev (5′-TTT GGC CAC AAC TCC CTT AC-3′/5′-GTC ATG ACG CAC TGG CTC TA-3′), contig19930_1.f1.exp-fwd/rev (5′-GCA GAG GGA TCC GTA ACT TG-3′/5′-CGG TGT TGC ATC TCT GAA AA-3′), contig02874_1.exp-fwd/rev (5′-CCG TCG TTA TCG TAG CCA TT-3′/5′-CTG CTG CAG TGC TCT ACC TG-3′), GME-string_Contig_3616.0-fwd/rev (5′-GCA CCC TGT ACG GAA ACC TA-3′/5′-CTA ACA CGC CCC AGT CT CT-3′), GME-string_Contig_3714.0-fwd/rev (5′-TTC CTT CAA CTC CCC TTG TG-3′/5′-GTC CAC GTT ACC TCG AGC AT-3′), contig04123_1.f1.exp-fwd/rev (5′-GCT CAA CT CTT TCG GCT CT-3′/5′-GCA CGC AGT TGC AGA GAA TA-3′), contig15335_1.exp-fwd/rev (5′-TTG CTT GAG GGG CAA TAG TT-3′/5′-TGG GGG AAA CAA TTC TCT TG-3′), histone deacetylase 8-fwd/rev (5′-GAT ACA GTG TGG TGC GGA TG-3′/5′-GCA ACA AGA GCA GTG ATG GA-3′), histone deacetylase 8 isoform 2-fwd/rev (5′-TCT TCA TCT TGT GGG GTT GA-3′/5′-GCG GGC TTC TTT AAT ACA CG-3′), histone deacetylase complex subunit-fwd/rev (5′-ACT TCA GGC GAG TCC ATC AG-3′/5′-ACA ACG AAC GTT GCA GAC AG-3′), histone deacetylase complex subunit sap18-fwd/rev (5′-GAA ACT CGA CGC AAA GGA AC-3′/5′-CTC ATT GGT GGA GGC ATT CT-3′), histone acetyltransferase 1-fwd/rev (5′-CGC ATT GTG CCA TTT AGT TG-3′/5′-TGA AGG CTT CCT GCA CTG TA-3′), histone acetyltransferase tip60- fwd/rev (5′-CGC GAA ATG GTA ACA AAC AG-3′/5′-TGG AGA GCC ACA TAA CAA CTG-3′), histone acetyltransferase type b catalytic-fwd/rev (5′-CCT GAA CGT TGT GGA CT CA-3′/5′-CGC GCC TGT TTC TTG TTT AT-3′), DNA cytosine-5 methyltransferase-fwd/rev (5′-GTG GTA TGC ACT GTG GAT GG-3′/ 5′-AAG GCT GAC ATG GTG GAG AC-3′), DNA methyltransferase 1-associated protein 1-fwd/rev (5′-CAA ACA AAG GCG AAG CTA GG-3′/5′- CCA TCA AAT GAT CGG TTT CC-3′) and the housekeeping gene 18S rRNA-fwd/rev (5′-ATG GTT GCA AAG CTG AAA CT-3′/5′-TCC CGT GTT GAG TCA AAT TA-3′).
Disclosure of potential conflicts of interest
No potential conflicts of interest were disclosed.
KVIR_S_1325975.zip
Download Zip (1.8 MB)Acknowledgments
We thank Dr. Richard M. Twyman for editing the manuscript.
Funding
AV acknowledges funding provided by the German Research Foundation for the project “The role of epigenetics in host–parasite coevolution” (VI 219/3–2) which is embedded within the DFG Priority Program 1399 “Host–parasite coevolution- rapid reciprocal adaptations and its genetic basis.” We gratefully acknowledge funding from the Russian Science Foundation (project №16–14–10067) for support in study of miRNAs. We acknowledge generous funding by the Hessen State Ministry of Higher Education, Research and the Arts (HMWK) via the ‘LOEWE Center for Insect Biotechnology and Bioresources’. The funders had no role in study design, data collection and analysis, decision to publish, or preparation of the manuscript.
References
- Laland K, Uller T, Feldman M, Sterelny K, Muller GB, Moczek A, Jablonka E, Odling-Smee J, Wray GA, Hoekstra HE, et al. Does evolutionary theory need a rethink? Nature 2014; 514(7521):161-4; PMID:25297418; https://doi.org/https://doi.org/10.1038/514161a
- Bravo A, Likitvivatanavong S, Gill SS, Soberon M. Bacillus thuringiensis: A story of a successful bioinsecticide. Insect Biochem Mol Biol 2011; 41(7):423-31; PMID:21376122; https://doi.org/https://doi.org/10.1016/j.ibmb.2011.02.006
- Raymond B, Johnston PR, Nielsen-LeRoux C, Lereclus D, Crickmore N. Bacillus thuringiensis: an impotent pathogen? Trends Microbiol 2010; 18(5):189-94; PMID:20338765; https://doi.org/https://doi.org/10.1016/j.tim.2010.02.006
- Masri L, Branca A, Sheppard AE, Papkou A, Laehnemann D, Guenther PS, Prahl S, Saebelfeld M, Hollensteiner J, Liesegang H, et al. Host-pathogen coevolution: the selective advantage of Bacillus thuringiensis virulence and its cry toxin genes. PLoS Biol 2015; 13(6):e1002169; PMID:26042786; https://doi.org/https://doi.org/10.1371/journal.pbio.1002169
- Melo AL, Soccol VT, Soccol CR. Bacillus thuringiensis: mechanism of action, resistance, and new applications: a review. Crit Rev Biotechnol 2016; 36(2):317-26; PMID:25264571; https://doi.org/https://doi.org/10.3109/07388551.2014.960793
- Tay WT, Mahon RJ, Heckel DG, Walsh TK, Downes S, James WJ, Lee SF, Reineke A, Williams AK, Gordon KH. Insect resistance to Bacillus thuringiensis toxin Cry2Ab is conferred by mutations in an ABC transporter subfamily a protein. PLoS Genet 2015; 11(11):e1005534; PMID:26583651; https://doi.org/https://doi.org/10.1371/journal.pgen.1005534
- Guo Z, Kang S, Chen D, Wu Q, Wang S, Xie W, Zhu X, Baxter SW, Zhou X, Jurat-Fuentes JL, et al. MAPK signaling pathway alters expression of midgut ALP and ABCC genes and causes resistance to Bacillus thuringiensis Cry1Ac toxin in diamondback moth. PLoS Genet 2015; 11(4):e1005124; PMID:25875245; https://doi.org/https://doi.org/10.1371/journal.pgen.1005124
- Broderick NA. Morse wrinkles to Bt susceptibility. Virulence 2016; 7(8):853-5; PMID:27715450; https://doi.org/https://doi.org/10.1080/21505594.2016.1244596
- Vilcinskas A. Coevolution between pathogen-derived proteinases and proteinase inhibitors of host insects. Virulence 2010; 1(3):206-14; https://doi.org/https://doi.org/10.4161/viru.1.3.12072
- Joop G, Vilcinskas A. Coevolution of parasitic fungi and insect hosts. Zoology (Jena, Germany) 2016; 119(4):350-8; PMID:27448694
- Freitak D, Schmidtberg H, Dickel F, Lochnit G, Vogel H, Vilcinskas A. The maternal transfer of bacteria can mediate trans-generational immune priming in insects. Virulence 2014; 5(4):547-54; PMID:24603099; https://doi.org/https://doi.org/10.4161/viru.28367
- Vilcinskas A. Insects emerge as valuable model hosts to explore virulence. Virulence 2011; 2(5):376-8; https://doi.org/https://doi.org/10.4161/viru.2.5.18289
- Mukherjee K, Twyman RM, Vilcinskas A. Insects as models to study the epigenetic basis of disease. Prog Biophys Mol Biol 2015; 118(1–2):69-78; PMID:25778758; https://doi.org/https://doi.org/10.1016/j.pbiomolbio.2015.02.009
- Dubovskiy IM, Grizanova EV, Whitten MM, Mukherjee K, Greig C, Alikina T, Kabilov M, Vilcinskas A, Glupov VV, Butt TM. Immuno-physiological adaptations confer wax moth Galleria mellonella resistance to Bacillus thuringiensis. Virulence 2016; 7(8):860-70: 1–11
- Vogel H, Altincicek B, Glockner G, Vilcinskas A. A comprehensive transcriptome and immune-gene repertoire of the lepidopteran model host Galleria mellonella. BMC Genomics 2011; 12:308; PMID:21663692; https://doi.org/https://doi.org/10.1186/1471-2164-12-308
- Mukherjee K, Vilcinskas A. Development and immunity-related microRNAs of the lepidopteran model host Galleria mellonella. BMC Genomics 2014; 15:705; PMID:25149864; https://doi.org/https://doi.org/10.1186/1471-2164-15-705
- Klose RJ, Bird AP. Genomic DNA methylation: the mark and its mediators. Trends Biochem Sci 2006; 31(2):89-97; PMID:16403636; https://doi.org/https://doi.org/10.1016/j.tibs.2005.12.008
- Vilcinskas A. The role of epigenetics in host-parasite coevolution: lessons from the model host insects Galleria mellonella and Tribolium castaneum. Zoology (Jena, Germany) 2016; 119(4):273-80
- Hamon MA, Cossart P. Histone modifications and chromatin remodeling during bacterial infections. Cell Host Microbe 2008; 4(2):100-9; PMID:18692770; https://doi.org/https://doi.org/10.1016/j.chom.2008.07.009
- Mukherjee K, Fischer R, Vilcinskas A. Histone acetylation mediates epigenetic regulation of transcriptional reprogramming in insects during metamorphosis, wounding and infection. Front Zool 2012; 9(1):25; PMID:23035888; https://doi.org/https://doi.org/10.1186/1742-9994-9-25
- Asgari S. MicroRNA functions in insects. Insect Biochem Mol Biol 2013; 43(4):388-97; PMID:23103375; https://doi.org/https://doi.org/10.1016/j.ibmb.2012.10.005
- Jaenisch R, Bird A. Epigenetic regulation of gene expression: how the genome integrates intrinsic and environmental signals. Nat Genet 2003; 33 Suppl:245-54; PMID:12610534; https://doi.org/https://doi.org/10.1038/ng1089
- Skinner MK. Environmental Epigenetics and a Unified Theory of the Molecular Aspects of Evolution: A Neo-Lamarckian Concept that Facilitates Neo-Darwinian Evolution. Genome Biol Evol 2015; 7(5):1296-302; PMID:25917417; https://doi.org/https://doi.org/10.1093/gbe/evv073
- Burggren W. Epigenetic Inheritance and Its Role in Evolutionary Biology: Re-Evaluation and New Perspectives. Biology (Basel) 2016; 5(2):pii: E24; PMID:27231949
- Dubovskiy IM, Whitten MM, Yaroslavtseva ON, Greig C, Kryukov VY, Grizanova EV, Mukherjee K, Vilcinskas A, Glupov VV, Butt TM. Can insects develop resistance to insect pathogenic fungi? PLoS One 2013; 8(4):e60248; PMID:23560083; https://doi.org/https://doi.org/10.1371/journal.pone.0060248
- Bingsohn L, Knorr E, Vilcinskas A. The model beetle Tribolium castaneum can be used as an early warning system for transgenerational epigenetic side effects caused by pharmaceuticals. Comp Biochem Physiol C Toxicol Pharmacol 2016; 185–186:57-64; PMID:26972758; https://doi.org/https://doi.org/10.1016/j.cbpc.2016.03.002
- Beeler SM, Wong GT, Zheng JM, Bush EC, Remnant EJ, Oldroyd BP, Drewell RA. Whole-genome DNA methylation profile of the jewel wasp (Nasonia vitripennis). G3 (Bethesda) 2014; 4(3):383-8; PMID:24381191; https://doi.org/https://doi.org/10.1534/g3.113.008953
- Hunt BG, Glastad KM, Yi SV, Goodisman MA. The function of intragenic DNA methylation: insights from insect epigenomes. Integr Comp Biol 2013; 53(2):319-28; PMID:23509238; https://doi.org/https://doi.org/10.1093/icb/ict003
- Ambros V. The functions of animal microRNAs. Nature 2004; 431(7006):350-5; PMID:15372042; https://doi.org/https://doi.org/10.1038/nature02871
- Asgari S. Role of MicroRNAs in Insect Host-Microorganism Interactions. Front Physiol 2011; 2:48; PMID:21886625; https://doi.org/https://doi.org/10.3389/fphys.2011.00048
- Yamamoto A, Zwarts L, Callaerts P, Norga K, Mackay TF, Anholt RR. Neurogenetic networks for startle-induced locomotion in Drosophila melanogaster. Proc Natl Acad Sci USA 2008; 105(34):12393-8; PMID:18713854; https://doi.org/https://doi.org/10.1073/pnas.0804889105
- Rehmsmeier M, Steffen P, Hochsmann M, Giegerich R. Fast and effective prediction of microRNA/target duplexes. RNA 2004; 10(10):1507-17; PMID:15383676; https://doi.org/https://doi.org/10.1261/rna.5248604
- Mukherjee K, Altincicek B, Hain T, Domann E, Vilcinskas A, Chakraborty T. Galleria mellonella as a model system for studying Listeria pathogenesis. Appl Environ Microbiol 2010; 76(1):310-7; PMID:19897755; https://doi.org/https://doi.org/10.1128/AEM.01301-09
- Mukherjee K, Hain T, Fischer R, Chakraborty T, Vilcinskas A. Brain infection and activation of neuronal repair mechanisms by the human pathogen Listeria monocytogenes in the lepidopteran model host Galleria mellonella. Virulence 2013; 4(4):324-32; PMID:23348912; https://doi.org/https://doi.org/10.4161/viru.23629