
ABSTRACT
Mycobacterium avium
subspecies paratuberculosis (MAP) causes Johne’s disease (JD), an incurable chronic intestinal bowel disease in ruminants. JD occurs worldwide and causes enormous economic burden in dairy industry. Research on JD pathobiology is hampered by its complexity which cannot completely be mimicked by small animal models. As a model the mouse allows dissecting some pathogenicity features of MAP. However, for unknown reasons MAP exhibits reduced growth in granulomas of infected mice compared to other Mycobacterium avium subspecies. Here, we characterized immune reactions of MAP-infected C57BL/6 mice. After infection, mice appeared fully immunocompetent. A strong antigen-specific T cell response was elicited indicated by IFNγ production of splenic T cells re-stimulated with MAP antigens. Function of splenic dendritic cells and proliferation of adoptively transferred antigen-specific CD4+ T cells was unaltered. Isolated splenic myeloid cells from infected mice revealed that MAP resides in CD11b+ macrophages. Importantly, sorted CD11b+CD11c− cells expressed high level of type 2 nitric oxide synthase (NOS2) but only low levels of pro- and anti-inflammatory cytokines. Correspondingly, MAP-infected MAC2 expressing myeloid cells in spleen and liver granuloma displayed strong expression of NOS2. In livers of infected Nos2−/−mice higher bacterial loads, more granuloma and larger areas of tissue damage were observed 5 weeks post infection compared to wild type mice. In vitro, MAP was sensitive to NO released by a NO-donor. Thus, a strong T cell response and concomitant NOS2/NO activity appears to control MAP infection, but allows development of chronicity and pathogen persistence. A similar mechanism might explain persistence of MAP in ruminants.
Introduction
Johne’s disease (JD) or paratuberculosis is a chronic intestinal infection of ruminants caused by Mycobacterium avium subspecies paratuberculosis (MAP). The disease causes severe economic burden for cattle farming worldwide [Citation1–Citation3]. In addition, MAP is suspected to have anthropozoonotic potential [Citation4–Citation7]. MAP is proposed to initiate or exacerbate Crohn’s disease (CD) and autoimmune diseases in humans [Citation8–Citation12]. Along this hypothesis, experimental evidence has accumulated that MAP is an exacerbating factor of inflammatory bowel disease (IBD) [Citation13,Citation14].
MAP is a pathogenic subspecies of M. avium and genetically closely related to M. avium subsp. avium (MAA) and M. avium subsp. hominissuis (MAH) [Citation15]. Little is known about the mechanisms by which MAP contribute to pathology of JD. This is mainly due to the difficult biology of the disease and the unique features of the pathogen. In contrast to MAA and MAH, MAP grows extremely slowly in culture and genetic manipulation is difficult [Citation16].
MAP is usually transmitted via the fecal–oral route from adults to neonatal calves. In vivo, it invades subepithelial macrophages and persists within these cells. Progression of disease is variable. Infection may either be cleared in some animals or developing into subclinical disease which might progress to clinical JD after several years. Clinical signs are persistent diarrhea and emaciation. However, some infected animals may remain in the subclinical state and never develop clinical symptoms [Citation17]. Severity of the clinical disease does not always correlate with the number of macrophages infected by MAP or the extent of intestinal inflammation. Accordingly, clinical signs can be observed in animals with multibacillar JD, i.e. high numbers of MAP-infected macrophages in the inflamed intestinal tissue, as well as in animals with paucibacillar JD, i.e. with low numbers of MAP-infected macrophages in the affected intestine. The reasons for the different pathological responses seem to depend on host immune competence and the type of immune response elicited [Citation18].
Cellular and molecular immunopathogenesis of JD is incompletely understood. Following oral uptake, MAP enters deeper intestinal tissue most likely via M cells of the distal ileum [Citation19,Citation20]. An entry via goblet cells is discussed [Citation21,Citation22]. After breaching the epithelial barrier, MAP is engulfed by subepithelial macrophages and spread to the draining lymph nodes [Citation23]. The following steps of pathogenesis are still elusive. Consensus consists that the ability of MAP to persist and/or to replicate in infected gut macrophages is an essential prerequisite for ongoing infection. Decisive for this appears the IFNγ production of MAP specific CD4+ T cells. It activates macrophages to efficiently kill MAP. Indeed infected animals develop an early cellular immune response which however is lost during the course of infection and replaced by a humoral response [Citation23]. Often, the cellular immune response is unable to control infection while it is facilitating progressive granulomatous inflammation of the gut. In addition, the extent of lesions as well as the course of disease progression might indicate the quality of the cellular immune response against MAP [Citation23]. Nevertheless, factors other than IFNγ might contribute to the control of MAP replication. Similarly, what regulates the extent granulomatous inflammation is not well defined.
Species specificity and the peculiarity of pathogenesis of JD largely restrict the use of laboratory animals for MAP research. However, even if it is not possible to mirror the complete picture of JD in laboratory animals they may help to understand certain aspects of MAP pathogenicity and disease. Since histological features such as granulomatous inflammation and immunological responses in mice are broadly similar to those in ruminants [Citation24], mouse models should help to understand aspects of host-pathogen interactions and to identify vaccine candidates [Citation24].
Usually, mice are infected intraperitoneally. Oral infection is less reproducible and does not reproduce the typical intestinal disease of JD in cattle [Citation24–Citation26]. Despite of a multitude of MAP studies in mice, immunopathology of MAP-infected mice was not systematically analyzed thus far. Nevertheless, a common observation was that MAP is able to multiply only poorly or not at all. This is in striking contrast to infection of mice with Mycobacterium avium subspecies MAA and MAH [Citation27,Citation28]. On the other hand, mice are not able to clear MAP even after months of persistence. These features are reminiscent of Mycobacterium tuberculosis (MTB) infection of mice.
In ruminants as well as in mice, the ability of MAP to infect and survive in host macrophages is thought to be a crucial property to establish an infection and for disease progression [Citation29–Citation31]. Accordingly, MAP is able to inhibit the phagosomal maturation of the infected macrophage and prevent intracellular killing [Citation32]. As consequence, persistent granulomatous inflammation and granuloma formation are observed in MAP-infected hosts [Citation8,Citation33]. In mice, MAP persistence appears to be the result of an inadequate immune reaction against the bacteria. For instance, we recently reported the absence of type I interferon induction which contributed to the survival of MAP in mice [Citation34]. Nevertheless, the various host factors affecting growth of MAP in such animals are far from being understood.
In the present study, we characterized MAP-specific immune reactions in C57BL/6J mice. Our data revealed that mice exhibit a specific cellular immune response. Granulomas were formed in spleen and liver. Bacteria resided in NOS2 expressing myeloid cells of liver and spleen granuloma. Expression of NOS2 and production of NO were found to restrict growth of MAP and progressive, granulomatous inflammation. This indicates that NOS2 plays a decisive role in the control of MAP infection in mice.
Materials and methods
Mice
Female C57BL/6J mice were purchased from Janvier (Le Genest-Saint-Isle, France) and maintained under specific pathogenic-free conditions (SPF) at the animal facility of the Helmholtz Centre for Infection Research (HZI), Braunschweig, Germany. Thy1.1 OVA albumin transgenic II (OT-II) C57B6L/J mice were bred at HZI. Nos2−/− on a C57BL/6J background were originally obtained from the Jackson Laboratories (Bar Harbor, ME, USA; stock no. 2609) [Citation35] and bred and maintained under specific pathogen-free conditions at the Franz Penzoldt Preclinical Animal Research Center of FAU and Universitätsklinikum Erlangen. Mice were infected at the age of 7–12 weeks. In all experiments, mice could feed ad-libitum and had unlimited access to water. Approval of study was granted from research ethics committee of the local authority LAVES in Lower Saxony (permission No. 3392 42502-04-13/1192).
Culture of MAP and infection
MAP6783 (DSM 44135) was grown in Middlebrook 7H9 broth (BD) supplemented with 2 mg/L Mycobactin J (IDVet), 0.5% glycerol and 10% OADC. To attain early logarithmic phase of growth, initial inoculum of optical density 600 (OD600nm) 0.2 was grown at 37°C under stirring conditions (130 rpm) until a final OD of ~1. The bacterial culture was washed 3 times with Dulbecco’s phosphate buffered saline (DPBS). To avoid clumping, bacterial suspension was briefly vortexed with 3 mm glass beads. Bacterial suspension was adjusted to OD600 of 5 in DPBS. Mice were infected intraperitoneally (i.p) with 200 µL (~108 CFU) of bacteria and followed for up to 5 weeks.
Organ sampling and plating
Liver were collected aseptically and weighed. For plating, ~300 mg of liver sections were homogenized in 1 mL sterile PBS containing 0.1% Triton-X100 in the presence of sterile 3 mm glass beads by beating three times for 20 s with 5 min cooling intervals using Hybaid Ribolyser. Serial dilutions of homogenous samples were plated on Middlebrook 7H10 agar containing 2 mg/L Mycobactin J and 10% OADC. Colonies were counted after 5–8 weeks. The bacterial load was calculated as CFU/organ.
Preparation of mycobacterial lysate
MAP cells grown in Watson Reid medium were pelleted, washed twice with 20 mL Tris-HCl (pH 7.5), and resuspended in 50 mM Tris-HCl (pH 8.0). Then cells were passed through French press (4 cycles), with 14,000 PSI with intermediate cooling on ice. Lysates were centrifuged for 30 min at 12,000 rpm at 4°C to remove cell debris. Subsequently, concentration of proteins in the supernatant was analyzed by MicroBCA (Micro BCAssay UP75860 Protein Quantification Kit (Uptima) and quantified with an Epoch microplate reader (BioTek).
Flow cytometry and cell sorting
Spleen cell suspensions were prepared by gently flushing the organs with Iscove’s complete medium (IMDM) supplemented with 10% heat inactivated fetal calf serum, penicillin 100 unit/mL, streptomycin 100 µg/mL, 2 mM L-glutamine, 50 µM 2-mercaptoethanol. Then, cells were filtered through 70 µm and finally through 50 µm diameter cell strainers. Red blood cells were removed by erythrocyte lysis buffer (14.2 mM sodium hydrogen carbonate [NaHCO3], 155 mM ammonium chloride [NH4Cl], 0.1 mM EDTA, at final pH of 7.3). Cells were stained in FACS buffer (PBS containing 2 mM EDTA, 2% FBS). Anti-Gr-1 (clone RB6.8C5) and anti-Ly6C (clone AL-21) were purchased from BD Bioscience. Other antibodies were purchased from eBioscience: Anti-CD16/32 (clone 2.4G2, FCR block), anti-CD11b (clone M1/70), anti-CD11c (clone N418), anti-MHC-II I-A/I-E (clone M5/114.15.2), anti-CD86 (clone GL1), anti-CD3 (clone 17A2), anti-CD4 (clone RMA4.5), anti-CD90.1 (clone HIS51), and anti-NOS2 (clone CXFNT). Anti-MAC-2 (clone M3/38) was purchased from Biolegend. Data were acquired on a LSR II analyzer (BD, NJ, USA). Data analysis was done using FACSDiva software (BD) or FlowJo (TreeStar). Cell sorting was done on BD FACSAria-II. Re-analysis of sorted cells was done for purity confirmation.
Ex vivo antigen dependent T cell proliferation
Splenic conventional dendritic cells, CD11chiCD11b± (cDC) were sorted and pulsed with Endograde OVA protein (Hyglos, 100 µg/mL) or OVA peptide (Aa323–339, 1 µg/mL) for 1 h at 37°C in IMDM complete medium. CD4+ T cells were isolated from the spleen of OT-II mice using Dynabeads® Untouched™ Mouse CD4+ Cells Kit (Invitrogen) with purity of ≥90%. CD4+ cells were stained with 5 µM carboxyfluorescein diacetate succinimidyl ester (CFSE, Invitrogen) and incubated for 10 min at 37°C and washed three times in complete medium. Finally, viable 3 × 10⁴ DC were co-cultured with viable 3 × 10⁵ CD4+ T cells in complete medium. Proliferation was measured after 3 days for peptide or 4 days for protein.
Antigen-specific CD4+ T cell stimulation assay
To generate dendritic cells in vitro, C57B6/J bone marrow cells were cultured at a density of 5 × 10⁶ cells in 10 cm dishes in 10 mL complete IMDM medium supplemented with 20% conditioned medium of X-63 cells producing GMCSF and 20 ng/mL murine IL-4. On day 3, new 10 mL complete medium containing growth factors was added to the cultures. On day 6, non-adherent cells were seeded overnight in 96 well plates at density of 5 × 10⁴ cells per well in the presence of 20 ng/mL E. coli LPS. The next day, cells were co-cultured with CD4+ T cells isolated from MAP-infected mice or PBS controls in the presence 50 µg/mL MAP lysate. CD4+ T cells cultured in the presence of plate bounding anti-CD3 (5 µg/mL, clone 45-2c11) and anti-CD28 (5 µg/mL, clone 37.51) were used as positive control. On day 5 after co-culture, the supernatants were collected and IFNγ was measured using ELISA.
In vivo T cell proliferation
Naïve CFSE-labeled Thy1.1 expressing OT-II CD4+ T cells (2 × 10⁶) were injected intravenously into infected or control mice. After 24 h, 200 µg OVA protein was administered i.p. Three days after, mice were sacrificed and spleens were collected. In vivo proliferation of Th1.1 expressing CD4+ T cells was monitored by CFSE dilution using flow cytometry.
In vitro infection of bone marrow derived macrophages
Mice were sacrificed after CO2 asphyxiation by cervical dislocation. Femur bones were collected aseptically. Bones were flushed with PBS and filtered in 50 µm filter and centrifuged at 1000 RPM for 5 min. To get rid off red blood cells, cells were resuspended in RBC lysis buffer and collected after centrifugation. Cells were resuspended in a freezing medium (fetal calf serum containing 10% DMSO) and stored in liquid nitrogen until use. WT and Nos2−/− C57B6/J bone marrow cells were cultured at a density of 5 × 10⁶ in DMEM complete medium (DMEM supplemented with 10% heat inactivated fetal calf serum, 100 units/mL penicillin, 100 µg/mL streptomycin, 2 mM L-glutamine) containing 20% L929 cell conditioned medium containing M-CSF (macrophage colony-stimulating factor). Medium was changed on day 3 and cells were allowed to grow for 7 more days. On day 10, ~2 × 10⁶ cells were seeded in six well plates (Sarstedt) and incubated overnight. Cells were then infected with MAP at a MOI ~10 in complete medium without antibiotics. In some conditions, cells were treated with 100 ng/mL recombinant murine IFNγ (Miltenyi Biotec) throughout the experiment. Medium was changed to complete medium with antibiotics and changed every day until day 7.
Quantitative real time PCR
After sorting spleen cells from MAP-infected mice or PBS control, cells were kept in 500 µL DNA/RNA Shield™ (Zymo Research). Afterward, RNA extraction was carried out using Direct-zolTM RNA Miniprep kit (Zymo Research). RNA from bone marrow derived macrophages was purified using RNeasy purification kit (Qiagen). RNA was reverse transcribed using M-MLV transcriptase (Promega) and oligo-(dT)12–18 primers (Carl Roth). Quantitation of expression of selected genes was done using TaqMan® Gene Expression Assays (Applied Biosystems) (assay ID; IFNγ: Mm01168134_m1, IL-10: Mm00439616_m1, IL-6: Mm00446190_m1). Primers used for SYBR based expression assays were Tnf: for_ATGAGCACAGAAAGCATGATC, rev_TACAGGCTTGTCACTCGAATT; Il1b: for_TTGACGGACCCCAAAAGATG, rev_AGAAGGTGCTCATGTCCTCA; Nos2: for_CCCAGCACAAAGGGCTCAAA, rev_GCACCTGGAACAGCACTCTC; Arg1: for_GATGTCCCTAATGACAGCTCC, rev_AGCACCACACTGACTCTTCC; Rps9: for_CTGGACGAGGGCAAGATGAAGC, rev_TGACGTTGGCGGATGAGCACA. Fold induction was calculated using housekeeping gene Rps9 as standard as described [Citation34].
Quantification of intracellular bacteria by PCR
Whole cell (eukaryotic and bacterial) DNA was extracted from sorted, 3% paraformaldehyde fixed cells or from macrophages infected with MAP in vitro. Briefly, pelleted cells were re-suspended in 500 µL lysis buffer (TE buffer with 1% SDS), zirconium beads were added and cells were disrupted using a tissue homogenizer. The homogenate was sonicated using Branson sonifier 450. Supernatant was collected after centrifugation. After adding an equal volume of TE buffer, RNA was removed by adding 20 µL RNase A (Roche) followed by a 1 h incubation at 37°C. To reverse the paraformaldehyde cross link, 30 µL of 4 M NaCl was added to fixed samples and incubated for 5 h at 65°C. DNA was extracted using standard phenol-chloroform extraction method. Bacterial DNA was determined by PCR using the MAP-DNA specific primers and normalized against eukaryotic Cxcl2 (Mip2a) promoter. Primers sequences used were: MAP-DNA: for_CTCGACCGCTAATTGAGAG, rev_CACAACCACCTCCGTAACC; Mip2a: for_GAAGGGCAGGGCAGTAGAAT, rev_ATGGCGCTAGGCTGAAGTG.
Histopathology
Upon isolation, tissues were fixed with 4% (v/v) formalin and embedded in paraffin. Approximately 3 µm thick sections were cut and stained with hematoxylin/eosin according to standard laboratory procedures. For Immunofluorescence staining, paraffin embedded sections were deparaffinized in 100% xylol and gradient ethanol concentrations. Antigen unmasking step was performed by pressure cooking of the deparaffinized section in 10 mM citrate buffer (pH = 6). Staining procedure was performed using the following primary antibodies: rat anti-mouse NOS2 (eBioscience, 1:200 dilution), rat anti-mouse MAC-2 (Biolegend, 1:200 dilution), and self-produced anti-MAP heparin binding hemagglutinin (HBHA, 1:200 dilution). Secondary antibodies: goat anti-rat Alexa Fluor 488 and anti-rabbit Alexa Fluor 568 were used at a final dilution of 1:500.
Confocal microscopy
Confocal microscopy was performed with an inverted Leica TCS SP5 microscope, equipped with lasers for 405, 488, and 561 nm excitation. Images were acquired with a 63×/1.4 NA HCX PL APO objective and image pixel size of 240 nm. The following settings were used for detection: DAPI: 410–480 nm, AlexaFluor-488: 489–560 nm, AlexaFluor-568: 569–640 nm. Image stacks with a z-distance of 0.5 μm per plane were acquired using a 1-Airy-unit pinhole diameter in sequential imaging mode to avoid bleed through. Images shown in were acquired using a LSM 780 confocal laser-scanning microscope with a 40×/1.3 Plan-Apochromat objective controlled by Zen 2012 (Carl Zeiss Microscopy GmbH) in spectral imaging mode. Spectral image stacks were acquired in λ mode using 4 laser lines (405, 488, 561, and 633 nm) and the QUASAR detector (detection range 411–695 nm) with a z-distance of 0.5 μm per plane and the pinhole set to 1-Airy-unit. λ stacks were subsequently linear unmixed with Zen 2012 (Carl Zeiss Microscopy GmbH). Maximum intensity projections were calculated for display purposes and brightness and contrast were adjusted identically for all images of the same dataset using ImageJ/Fiji.
IFNγ ELISA
The concentration of IFNγ in supernatant of co-cultured dendritic cells and T cells co-culture was analyzed using coating (clone A.N 18) and detection (clone R46A2) antibodies. In brief, coating rat anti-mouse IFNγ was incubated in 50 µL coating buffer in 96 well plates (MaxiSorb TM Immunoplates, Nunc) over night. The 96 well plates were then blocked for 1 h with 3% BSA in 0.05% Tween 20. Diluted sera were added to the wells and incubated for 2 h at room temperature. Biotinylated detection rat anti-mouse IFNγ was added and incubated for 1 h. Then horseradish peroxidase (HRP) conjugated streptavidin (BD) was added and incubated for 30 min and the bound HRP was detected with o-phenylenediamine (OPD) substrate in terms of absorbance at 490 nm using ELISA reader XFluor software (Tecan SUNRISE).
Multiplex ELISA
Blood was collected via cardiac puncture in 500 Serum-Gel tubes (Sarstedt). Serum was separated by centrifugation at 10,000 rpm for 4 min at room temperature and kept at −80°C until analysis. Serum concentration of cytokines and chemokines were quantified by LUMINEX based mouse cytokine 23-plex assay following manufacturer’s instruction (Bio-Rad, USA).
In vitro GSNO susceptibly assay
About 104 bacterial cells (M. smegmatis mc2155, M. avium25291 and MAP6783) from early exponential growth phase were incubated in 100 µL PBS containing 4 and 8 mM concentration of GNSO for 4 and 8 h. As control, equal numbers of bacterial cells were incubated with PBS. After 4 and 8 h of incubation, serial dilutions of bacteria were plated on Middlebrook agar plates and bacterial survival was monitored by CFU counting. To determine the amount of nitrite, as an indicator of NO released from the respective concentration of GSNO, the culture supernatants were collected at 0, 1, 2, 4, 6, and 8 h of incubation with the respective bacterial strains.
Nitrite assay
To quantify the amount of nitric oxide (NO) after in vitro MAP infection and in vitro GSNO assay, nitrite content in the cell culture supernatant was measured using the Griess reaction as described by the manufacturer (Promega).
Statistical analysis
Data were analyzed with the GraphPad Prism version 5 software. Mean ± standard error of the mean (mean ± SEM) was used for data description. Statistical test between two groups was determined using Student’s t-test. Difference between more than two groups was determined either with one way or two-way analysis of variance (ANOVA) using Dunnett’s multiple comparisons test or Bonferroni’s multiple comparison tests. Cut off p-value of <0.05 was considered as statistically significant difference (*p < 0.05, **p < 0.01, ***p < 0.005).
Results
Persistence of MAP in liver granuloma-associated macrophages in mice
In mice, MAP is able to persist for extended periods of time in spleen, liver, mesentery, and intestine after intraperitoneal application [Citation14,Citation34]. To understand the mechanisms that account for pathogen persistence, we infected 8 weeks old female C57B6/J mice intraperitoneally with a high dose of 108 CFU MAP.
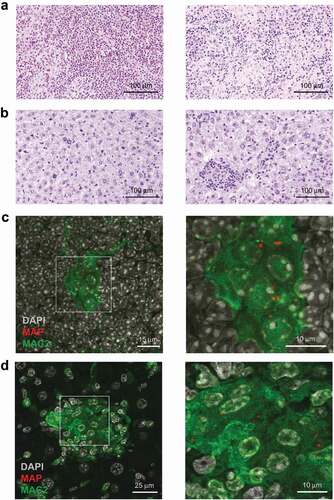
Mice infected for 5 weeks exhibited multifocal granulomatous splenitis with accumulation of irregular shaped and sized randomly distributed clusters of epithelioid macrophages surrounded by lymphocytes ()). In livers granuloma of different shapes and sizes with no evidence of caseation or necrosis were observed ()). Immuno-histochemical analysis of spleens ()) and livers ()) of infected mice demonstrated that in both organs MAP resided in MAC2 (galectin-3) expressing macrophages. In agreement, we found few acid-fast bacilli in well-formed granuloma after Ziehl-Neelsen staining of livers of infected mice (Figure S1A). As shown in Figures S1B and S2A (upper panels), histology revealed no inflammatory lesions in the liver at 1 day post infection. At 2 weeks, individual focal accumulations of macrophages and single neutrophilic granulocytes were present in the parenchyma. At 3 weeks, we observed increased numbers of activated macrophages with an epithelioid morphology (epithelioid macrophages) and lymphocytes, characteristic for granuloma formation in infected mice. Together, these results demonstrate the central role of macrophages for pathology in MAP-infected mice.
Figure 1. Histopathology of spleen and liver in MAP-infected mice.
MAP infection does not impair dendritic cell function or T cell responses
We have recently shown that MAA subverts the immune response of the host by influencing the activity of antigen-presenting cells as well as T cells [Citation27]. To see whether persistence of MAP is also associated with an impaired cellular immune response, we first characterized conventional dendritic cells (cDC, CD11chiCD11b±) from spleens of MAP-infected mice. Five weeks post infection the number of cDC had significantly increased ()). The expression levels of MHC class II of such cells were comparable to the control group while expression of the co-stimulator CD86 was slightly enhanced ()).
Figure 2. MAP infection of mice does not impair dendritic cell function and T cell response.
To prove their functional capacity, sorted cDC from spleens of mice infected with MAP for 4 weeks were sensitized with OVA protein or OVA peptide (Aa323-339) and co-cultured with OT-II T cells to monitor their antigen-processing and antigen-presentation capacity. No difference in the capacity of cDC to stimulate T cell proliferation was observed after sensitizing cDC from infected or control mice with OVA peptide. Nearly all OT-II cells proliferated ()). Stimulatory capacity of cDC from infected mice was only slightly lower compared to controls when OVA protein was used for sensitization ()). Thus, the capacity of cDC to process and present antigens appears to remain intact even after MAP infection.
As in vitro stimulation experiments inadequately reflect the complexity of host-pathogen interactions in vivo, we additionally tested T cell proliferation in infected mice. To this end, we adoptively transferred CFSE-labeled splenic OT-II T cells into uninfected mice or mice infected with MAP for 1, 3, 4, or 5 weeks. OVA protein was administered after 24 h and proliferation of transferred OT-II T cells was monitored by flow cytometry after additional 3 days. As shown in ), independent of the duration of infection, in vivo T cell proliferation was identical in MAP-infected and uninfected control mice. This suggests that despite the ongoing MAP infection, T cell immune response remained intact.
To determine whether a MAP-specific CD4+ T cell response was successfully initiated following infection, 14 and 30 days after MAP infection, CD4+ T cells were isolated from pooled splenocytes. These CD4+ T cells were co-cultured with bone marrow-derived dendritic cells in the presence of 50 µg/mL MAP lysate for 5 days. Upon re-stimulation with the MAP antigens, higher amounts of IFNγ were secreted by CD4+ T cell from MAP-infected mice compared to T cells from uninfected animals. In contrast, the release of IFNγ by both groups of CD4+ T cells was similar following polyclonal stimulation of CD4+ T cells with anti-CD3 and anti-CD28 antibody ()). This indicates that upon infection a strong MAP-specific T cell response is induced.
CD11b expressing myeloid cells exhibit enhanced type 2 nitric oxide synthase expression upon MAP infection
In infected mice, MAP resided in MAC2 positive myeloid cells. To better understand the role of myeloid cells for MAP persistence, we sorted CD11b+CD11c− myeloid cells from the spleens of un-infected control and MAP-infected mice. Infection led to a significant increase of CD11b+CD11c− cells ()). These cells were further separated into three subpopulations (purity ≥ 90%) using Gr-1 and Ly6C markers to yield granulocytes (Gr1hiLy6Clo), monocytes (Gr1intLy6Chi) and macrophages (Gr1loLy6Clo/int) ()). Following DNA extraction, qPCR analysis showed that mainly the macrophage fraction was infected with MAP ()). RT-qPCR also revealed that CD11b+CD11c− cells from infected mice expressed markedly high levels of type 2 nitric oxide synthase mRNA (Nos2), while expression of Il1b, Tnf, Il6, Ifng, Il10, and Arg1 was only weakly induced ()).
Figure 3. CD11b expressing myeloid cells exhibit enhanced inducible nitric oxide synthase expression after MAP infection.
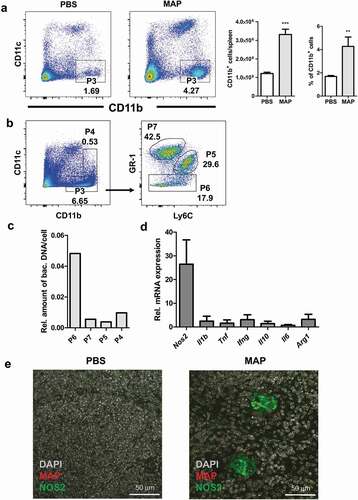
To determine whether MAP resided in NOS2 expressing macrophages, spleen sections were stained with anti-MAC2, anti-MAP, and anti-NOS2 antibodies. As shown in ), splenic myeloid cells harboring MAP also expressed NOS2. Similar findings were obtained from liver sections of infected mice (Figure S2A). Here, MAP could be shown to reside in NOS2 expressing myeloid cells of granulomas. In agreement, the appearance of NOS2 expressing cells coincided with the formation of clearly defined granuloma containing epithelioid macrophages at 3 weeks of infection (Figure S2B, middle panel). This indicates that NOS2 expression of infected macrophages is delayed and could depend on IFNγ produced by T cells.
IFNγ and NOS2 contribute to the control of MAP in macrophages
The almost exclusive presence of MAP in NOS2-expressing cells in vivo could be due to a preferential uptake of MAP by NOS2+ phagocytes or result from the induction of NOS2 by MAP. We therefore infected bone marrow-derived macrophages (BMDM) in vitro with MAP at a multiplicity of infection (MOI) of 10 and analyzed the cells for up to 24 h after infection. Under these conditions, MAP gradually induced Nos2 mRNA expression over time, whereas LPS that was used as positive control, led to an approximately three-fold higher Nos2 mRNA expression which already peaked at 8 h ()). Despite the 600-fold induction of Nos2 mRNA by MAP alone, significant accumulation of nitrite (as stable end product of NO) was only seen after co-stimulation with MAP and IFNγ ()).
Figure 4. IFNγ and NOS2 contribute to the control of MAP in macrophages.
To investigate the functional relevance of Nos2 expression in macrophages, wild type (WT) and Nos2−/− BMDM were infected with MAP in vitro. After 7 days, intracellular bacterial load was determined by PCR relative to the 2 h time-point of infection. Whereas in unstimulated WT macrophages the number of bacteria remained largely unaltered, priming of the macrophages with IFNγ 18 h prior to infection resulted in a remarkably decreased bacterial load at day 7 of culture. In the absence of Nos2, unstimulated macrophages allowed an approximately twofold increase of the bacterial burden during the observation period while IFNγ treatment slightly reduced the bacterial burden. Importantly, IFNγ-activated Nos2−/− macrophages harbored significantly less mycobacteria than unstimulated Nos2−/− macrophages. However, the relative bacterial numbers were higher than in the respective IFNγ-stimulated WT controls ()). From these data we conclude that macrophages control the growth of MAP by both NOS2-dependent and NOS2-independent mechanisms.
To further demonstrate the role of NO in controlling MAP, we tested whether MAP is directly susceptible to NO. For this we included the M. avium strain DSM44156 (MAA), which has been shown to be resistant to NO [Citation27] and M. smegmatis strain mc2 (MSM) which has been shown to be susceptible for NO [Citation36] as controls. Bacteria suspensions in PBS were treated with the NO donor GSNO (4 and 8 mM) for 4 and 8 h. Survival was monitored by plating und CFU counting. Under these conditions, NO release from GSNO increased over time from approximately 450 µM to approximately 700 µM when bacteria were treated with 4 mM GSNO, while treatment with 8 mM led to a constant exposure of 800 µM over the time (Figure S3). ) shows that survival of MAP and MSM was significantly reduced in the presence of 8 mM GSNO. A tendency of susceptibility was already seen by treatment with 4 mM GSNO. As expected, viability of MAA was not influenced. These data indicate that MAP is at least partially sensitive to the bacteriostatic or bactericidal effects of NO.
Our data indicated that IFNγ enhances NO production in MAP-infected macrophages. To extend these findings to the in vivo situation, we determined serum concentration of IFNγ as well as cytokines and chemokines five weeks after infection. As shown in ), in infected mice IFNγ and other immune effectors were upregulated compared to the PBS control, although statistical significance was only reached for RANTES (CCL5) () and Figure S4). Nevertheless, local concentrations of such cytokines produced by macrophages and/or T cells might be sufficient to co-trigger the induction of Nos2 in MAP bearing macrophages.
NOS2 contributes to the control of MAP infection in mice
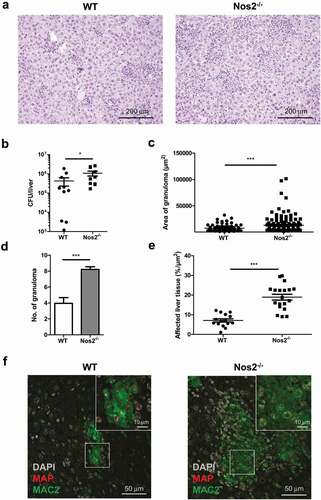
As shown above, Nos2 expression by MAP-infected macrophages was associated with reduced bacterial loads in vitro. To determine the relevance of this mechanism in vivo, we infected Nos2−/− mice. Interestingly, by 5 weeks post infection Nos2−/− mice displayed increased spleen weights (Figure S5A) and more severe pathology in liver compared to infected WT mice ()) indicating more severe inflammation. Correspondingly, a significantly higher bacterial burden was found in the liver of MAP-infected Nos2−/− mice ()). However, the gross number of CD4+ T cells was unchanged to WT mice (Figure S5B) and only slight differences in serum levels of IFNγ, IL12 and IL6 could be detected (Figure S5C). In contrast, severe multifocal, diffuse granulomatous inflammation, higher numbers of granuloma per section and larger areas of affected liver tissue were observed in infected Nos2−/− mice compared to WT controls (–e)). In addition, granuloma in Nos2−/− mice contained large areas of MAP harboring MAC2 positive macrophages ()). Together, our data indicate that Nos2 expression and subsequent NO production are involved in the restriction of bacterial growth in mice chronically infected with MAP.
Figure 5. NOS2 contributes to the control of MAP infection in mice.
Discussion
Despite the increasing economic impact of JD, its pathobiology is still unclear. This limits diagnosis, treatment and prevention of disease. The complexity arising from the prolonged process of MAP persistence and replication in the gut leading to pathogenesis and clinical disease is one major difficulty in controlling the pathogen. This particular feature of the disease clearly hampers the use of susceptible animal infection models.
The mouse is commonly used to study virulence and host pathogen interactions of various infectious microorganisms including mycobacteria. Although the mouse model often poorly mimics the complex picture of mycobacterial infection it is able to provide important insights [Citation24,Citation37,Citation38]. Immunocompetent mice are highly resistant to mycobacterial infections. Nevertheless, susceptible inbred strains and genetically modified animals lacking specific components of the immune system allow defined experimentation to understand the role of critical mycobacterial factors or host components involved in pathogenesis [Citation37].
Infection of mice with a high inoculum of 108 CFU via the intraperitoneal route is recommended for reproducible experimental setups [Citation24]. As shown by us and others [Citation34,Citation39–Citation42], under these conditions MAP-infected mice develop chronic granulomatous inflammation in spleen and liver. MAP infection is controlled but not cleared. This is in striking contrast to other M. avium subspecies, which have shown to increase in number over the time of infection [Citation27]. Recently we demonstrated that persistence of MAP in mice involves an inadequate IFNβ response [Citation34]. In the present study, we provide evidence that proliferation of MAP in mice is restricted by NOS2/NO activity in infected macrophages in the granulomas. This is remarkably different to infection of NOS2 deficient mice with other M. avium subspecies. Here, absence of NOS2/NO improved bacterial clearance and disease [Citation27,Citation43]. To the best of our knowledge, our study is the first reporting effects of NOS2/NO expression on MAP infections in vivo.
Infection of mice by MAP elicited specific immune reactions resulting in granulomatous inflammation in spleen and granuloma formation in liver. Increased numbers of cDC and MAP-reactive T cells were observed in the spleens and slightly elevated levels of IFNγ were found in the sera of infected mice. No indication of immune subversion was observed under these conditions. Dendritic cell function and activation of adoptively transferred OVA antigen-specific CD4+ T cells was not influenced. In addition, MAP-specific CD4+ T cell responses were elicited. Apparently, these immune reactions were able to control the MAP infection but were not sufficient to eliminate the pathogen. This is reminiscent of the situation of MTB infected immunocompetent mice [Citation44,Citation45]. However, it is in striking contrast to mice infected with other M. avium subspecies where a cellular immune response develops but is unable to control bacterial growth [Citation27].
The control of mycobacterial infection strongly depends on the types of myeloid cells that are targeted by the pathogens [Citation27]. In the present study, we observed accumulation of mycobacteria containing myeloid cells expressing MAC2 in spleen and liver after seven days of infection. In addition, MAP containing myeloid cells expressing MAC2 were found in the center of granuloma starting at week 3 after infection. However, only myeloid cells in the granuloma centers expressed NOS2. Sorting of splenic myeloid cells revealed that MAP resided in Gr1loLy6Clo/int macrophages of a CD11b+CD11c- cell population expressing Nos2.
Our in vitro results suggested that IFNγ produced by T cells is necessary for NOS2 expression of MAP containing myeloid cells. In agreement, IFNγ has been shown to be necessary for controlling M. avium infection [Citation46]. However, also IFNγ-independent mechanisms of protection do exist as shown by experiments using different inbred mouse strains and IFNγ deficient mice [Citation47,Citation48]. The production of NO by NOS2 apparently restricted MAP growth and disease since the absence of Nos2 in recombinant mice resulted in a higher bacterial load and increased pathology 5 weeks post infection. In such mice, levels of serum cytokines and chemokines were nearly similar to WT controls. CD4+ T cell and serum IFNγ were only marginally increased. Hence, IFNγ alone is most likely not able to control bacterial infection in vivo in the absence of NOS2. Although, this emphasizes the in vivo importance of CD4+ T cells and IFNγ for MAP infection control, it could not be mimicked by our in vitro experiments. Here, IFNγ pre-activation of BMDM from Nos2−/− mice before MAP infection restricted bacterial growth. In vivo pathogenic mycobacteria need to infect permissive naïve macrophages to be able to survive in the host. Thereby, they are protected against IFNγ induced killing [Citation49,Citation50]. However, during the course of infection myeloid cells activated by IFNγ or other cytokines most likely are involved in protection against MAP. Hence, to understand the critical role of IFNγ during MAP infection in more detail further studies will be needed.
NO is known to considerably influence infection processes. On the one hand, NO is known for its antimicrobial activity. It might directly restrict bacterial growth and survival. On the other hand, it is an immunomodulatory molecule. NO can either exacerbate tissue damage or limit immunopathology during infections by helping to shut down innate or T cell-driven responses [Citation51–Citation54]. Striking differences are found regarding the mode of action of NO in mice infected with different pathogenic mycobacteria. Experimental infections of Nos2−/− mice with MTB or M. bovis BCG clearly demonstrated a dominant antimicrobial activity of NO. Bacterial numbers and pathology were exacerbated in such mice. In contrast, investigations using virulent MAA revealed that high levels of NOS2/NO expression are induced in inflammatory monocytes [Citation27]. This has detrimental consequences for the host as MAA-infected mice which lack NOS2 show improved pathology and reduced bacterial numbers.
In the present study, we demonstrate that control of MAP infection by NO is most likely due to its direct bactericidal activity. Three weeks after infection, MAP was most prevalently found in macrophages that express NOS2 and thus produce NO. We also show that MAP is sensitive to NO. Hence, although being closely related to other M. avium subspecies, the NO-mediated infection control of MAP strongly resembles that of MTB. Despite targeting different organs and hosts, both MAP and MTB can cause latent infections or are completely cleared depending on the immune state of the host and the production of NO [Citation17,Citation55,Citation56].
The presented data help to better understand some aspects of the pathobiology of JD. Whether an animal is capable to mount an early Th1 response, to express NOS2 and to produce NO or not, might be decisive for the development of paucibacillary versus multibacillary JD. Lack of NOS2 expression has been reported in cattle with multibacillary JD [Citation57,Citation58]. While the individual capability to produce NO remains to be demonstrated for MAP-infected animals, Nos2 gene polymorphism has been shown to correlate with susceptibility to M. bovis infection in cattle [Citation59].
It is tempting to speculate on the survival and dissemination strategy of MAP. MAP seems to manipulate the immune system of the host by targeting macrophages and inducing limited production of NO during early stages of infection. This would allow initial replication. Subsequently, increasing NO production due to the action of IFNγ will restrict the expansion of the bacteria. This might avoid early pathology. In addition, MAP is subverting the activation of type I IFN [Citation34]. As type I IFN is a co-inducer of Nos2, its strong production would most likely lead to the elimination of the bacteria. Hence, the co-stimulus for the NO-producing enzyme NOS2 is most likely the low amount of serum IFNγ. As result, the bacteria reach a steady state or dormancy. After years, when the infected animals have reached adulthood, bacteria are activated possibly during phases of immunosuppression. Then they multiply and cause pathology. As a consequence, bacteria are shed and are able to infect susceptible newborns of the herd. Thus, MAP manipulates the immune system for its success as pathogen.
In conclusion, our study clearly emphasizes the critical role of NOS2 during MAP infection in mice. Hence Nos2−/− mice might represent a first step for the development of better infection models with specific knock-out animals to better evaluate MAP pathogenicity and to improve potential treatments in future.
Author contribution
Designed experiments: KA SW RG. Performed the experiments: KA KL WA NJ NR UH AS CF AN. Analyzed the data: KA AB US SW RG. Provided methodological advice and contributed to the writing of the manuscript: CB. Wrote the paper: KA SW RG.
Supplemental Material
Download Zip (3.6 MB)Acknowledgments
We are grateful to Susanne zur Lage, Regina Lesch and Maria Höxter (Helmholtz Centre for Infection Research (HZI), Braunschweig) for their skillful technical support and Marcus Gereke (HZI) for providing OTII mice and Sebastian Felgner (HZI) for help on multiplex ELISA.
Disclosure statement
No potential conflict of interest was reported by the authors.
Supplementary material
Supplemental data for this article can be accessed here.
Correction Statement
This article has been republished with minor changes. These changes do not impact the academic content of the article.
Additional information
Funding
Related Research Data
References
- Chiodini. 2005. The history of paratuberculosis. Proceedings of 8ICP, Copenhagen, Denmark 2005.
- Park HT, Yoo HS. Development of vaccines to Mycobacterium avium subsp. paratuberculosis infection. Clin Exp Vaccine Res. 2016;5(2):108–116.
- Britton LE, Cassidy JP, O’Donovan J, et al. Potential application of emerging diagnostic techniques to the diagnosis of bovine Johne’s disease (paratuberculosis). Vet J. 2016;209:32–39.
- Waddell LA, Rajic A, Stark KD, et al. The zoonotic potential of Mycobacterium avium ssp. paratuberculosis: a systematic review and meta-analyses of the evidence. Epidemiol Infect. 2015;143(15):3135–3157.
- Kuenstner JT, Naser S, Chamberlin W, et al. The Consensus from the Mycobacterium avium ssp. paratuberculosis (MAP) Conference 2017. Front Public Health. 2017;5:208.
- Bharathy S, Gunaseelan L, Porteen K. Exploring the potential hazard of Mycobacterium avium subspecies paratuberculosis as a cause for Crohn’s disease. Vet World. 2017;10(4):457–460.
- Atreya R, Bulte M, Gerlach GF, et al. Facts, myths and hypotheses on the zoonotic nature of Mycobacterium avium subspecies paratuberculosis. Int J Med Microbiol. 2014;304(7):858–867.
- McNees AL, Markesich D, Zayyani NR, et al. Mycobacterium paratuberculosis as a cause of Crohn’s disease. Expert Rev Gastroenterol Hepatol. 2015;9(12):1523–1534.
- Pierce ES. Could Mycobacterium avium subspecies paratuberculosis cause Crohn’s disease, ulcerative colitis and colorectal cancer? Infect Agent Cancer. 2018;13(1):1.
- Hermon-Taylor J. Mycobacterium avium subspecies paratuberculosis, Crohn’s disease and the Doomsday scenario. Gut Pathog. 2009;1(1):15.
- Oken HA, Saleeb PG, Redfield RR, et al. Is Mycobacterium avium paratuberculosis the Trigger in the Crohn’s Disease Spectrum? Open Forum Infect Dis. 2017;4(3):ofx104.
- Timms VJ, Daskalopoulos G, Mitchell HM, et al. The Association of Mycobacterium avium subsp. paratuberculosis with Inflammatory Bowel Disease. PLoS One. 2016;11(2):e0148731.
- Suwandi A, Bargen I, Roy B, et al. Experimental colitis is exacerbated by concomitant infection with Mycobacterium avium ssp. paratuberculosis. Inflamm Bowel Dis. 2014;20(11):1962–1971.
- Suwandi A, Bargen I, Pils MC, et al. CD4 T cell dependent colitis exacerbation following re-exposure of Mycobacterium avium ssp. paratuberculosis. Front Cell Infect Microbiol. 2017;7:75.
- Rindi L, Garzelli C. Genetic diversity and phylogeny of Mycobacterium avium. Infect Genet Evol. 2014;21:375–383.
- Turenne CY, Wallace R Jr., Behr MA. Mycobacterium avium in the postgenomic era. ClinMicrobiolRev. 2007;20:205–229.
- Koets AP, Grohn YT. Within- and between-host mathematical modeling of Mycobacterium avium subspecies paratuberculosis (MAP) infections as a tool to study the dynamics of host-pathogen interactions in bovine paratuberculosis. Vet Res. 2015;46(1):60.
- Ganusov VV, Klinkenberg D, Bakker D, et al. Evaluating contribution of the cellular and humoral immune responses to the control of shedding of Mycobacterium avium spp. paratuberculosis in cattle. Vet Res. 2015;46(1):62.
- Sigurdardottir OG, Press CM, Evensen O. Uptake of Mycobacterium avium subsp. paratuberculosis through the distal small intestinal mucosa in goats: an ultrastructural study. Vet Pathol. 2001;38:184–189.
- Sigurethardottir OG, Valheim M, Press CM. Establishment of Mycobacterium avium subsp. paratuberculosis infection in the intestine of ruminants. Adv Drug Deliv Rev. 2004;56:819–834.
- Golan L, Livneh-Kol A, Gonen E, et al. Mycobacterium avium paratuberculosis invades human small-intestinal goblet cells and elicits inflammation. J Infect Dis. 2009;199(3):350–354.
- Schleig PM, Buergelt CD, Davis JK, et al. Attachment of Mycobacterium avium subspecies paratuberculosis to bovine intestinal organ cultures: method development and strain differences. Vet Microbiol. 2005;108:271–279.
- Sweeney RW. Pathogenesis of paratuberculosis. Vet Clin North AmFood Anim Pract. 2011;27:537–546.
- Hines ME 2nd, Stabel JR, Sweeney RW, et al. Experimental challenge models for Johne’s disease: a review and proposed international guidelines. Vet Microbiol. 2007;122(3–4):197–222.
- Veazey RS, Taylor HW, Horohov DW, et al. Histopathology of C57BL/6 mice inoculated orally with Mycobacterium paratuberculosis. J Comp Pathol. 1995;113(1):75–80.
- Cooney MA, Steele JL, Steinberg H, et al. A murine oral model for Mycobacterium avium subsp. paratuberculosis infection and immunomodulation with Lactobacillus casei ATCC 334. Front Cell Infect Microbiol. 2014;4:11.
- Abdissa K, Nerlich A, Beineke A, et al. Presence of infected Gr-1intCD11bhiCD11cint monocytic myeloid derived suppressor cells subverts T cell response and is associated with impaired dendritic cell function in Mycobacterium avium-infected mice. Front Immunol. 2018;9. DOI:https://doi.org/10.3389/fimmu.2018.02317.
- Pedrosa J, Flórido M, Kunze ZM, et al. Characterization of the virulence of Mycobacterium avium complex (MAC) isolates in mice. Clin Exp Immunol. 1994;98(2):210–216.
- Momotani E, Whipple DL, Thiermann AB, et al. Role of M Cells and Macrophages in the Entrance of Mycobacterium paratuberculosis into Domes of Ileal Peyer’s Patches in Calves. Vet Pathol. 1988;25(2):131–137.
- Valentin-Weigand P, Goethe R. Pathogenesis of Mycobacterium avium subspecies paratuberculosis infections in ruminants: still more questions than answers. Microbes Infect. 1999;1(13):1121–1127.
- Ponnusamy D, Periasamy S, Tripathi BN, et al. Mycobacterium avium subsp. paratuberculosis invades through M cells and enterocytes across ileal and jejunal mucosa of lambs. Res Vet Sci. 2013;94(2):306–312.
- Kuehnel MP, Goethe R, Habermann A, et al. Characterization of the intracellular survival of Mycobacterium avium ssp. paratuberculosis: phagosomal pH and fusogenicity in J774 macrophages compared with other mycobacteria. Cell Microbiol. 2001;3(8):551–566.
- Arsenault RJ, Maattanen P, Daigle J, et al. From mouth to macrophage: mechanisms of innate immune subversion by Mycobacterium avium subsp. paratuberculosis. Vet Res. 2014;45(1):54.
- Ruangkiattikul N, Nerlich A, Abdissa K, et al. cGAS-STING-TBK1-IRF3/7 induced interferon-beta contributes to the clearing of non tuberculous mycobacterial infection in mice. Virulence. 2017;8(7):1303–1315.
- Laubach VE, Shesely EG, Smithies O, et al. Mice lacking inducible nitric oxide synthase are not resistant to lipopolysaccharide-induced death. Proc Natl Acad Sci U S A. 1995;92(23):10688–10692.
- Fabrino DL, Bleck CK, Anes E, et al. Porins facilitate nitric oxide-mediated killing of mycobacteria. Microbes Infect. 2009;11(10–11):868–875.
- Cooper AM. Mouse model of tuberculosis. Cold Spring Harb Perspect Med. 2014;5(2):a018556.
- Begg DJ, Whittington RJ. Experimental animal infection models for Johne’s disease, an infectious enteropathy caused by Mycobacterium avium subsp. paratuberculosis. Vet J. 2008;176(2):129–145.
- Shin MK, Park H, Shin SW, et al. Host transcriptional profiles and immunopathologic response following Mycobacterium avium subsp. paratuberculosis infection in mice. PLoS One. 2015;10(10):e0138770.
- Ghosh P, Wu CW, Talaat AM. Key role for the alternative sigma factor, SigH, in the intracellular life of Mycobacterium avium subsp. paratuberculosis during macrophage stress. Infect Immun. 2013;81(6):2242–2257.
- Meer T, Eckelt E, Basler T, et al. The Mycobacterium avium ssp. paratuberculosis specific mptD gene is required for maintenance of the metabolic homeostasis necessary for full virulence in mouse infections. Front Cell Infect Microbiol. 2014;4:110.
- Eckelt E, Meer T, Meens J, et al. FurA contributes to the oxidative stress response regulation of Mycobacterium avium ssp. paratuberculosis. Front Microbiol. 2015;6:16.
- Gomes MS, Florido M, Pais TF, et al. Improved clearance of Mycobacterium avium upon disruption of the inducible nitric oxide synthase gene. J Immunol. 1999;162(11):6734–6739.
- Medina E, North RJ. Resistance ranking of some common inbred mouse strains to Mycobacterium tuberculosis and relationship to major histocompatibility complex haplotype and Nramp1 genotype. Immunology. 1998;93(2):270–274.
- Chackerian AA, Behar SM. Susceptibility to Mycobacterium tuberculosis: lessons from inbred strains of mice. Tuberculosis (Edinb). 2003;83(5):279–285.
- Appelberg R. Pathogenesis of Mycobacterium avium infection: typical responses to an atypical mycobacterium? Immunol Res. 2006;35(3):179–190.
- Appelberg R, Leal IS, Pais TF, et al. Differences in resistance of C57BL/6 and C57BL/10 mice to infection by Mycobacterium avium are independent of gamma interferon. Infect Immun. 2000;68(1):19–23.
- Florido M, Goncalves AS, Silva RA, et al. Resistance of virulent Mycobacterium avium to gamma interferon-mediated antimicrobial activity suggests additional signals for induction of mycobacteriostasis. Infect Immun. 1999;67(7):3610–3618.
- Hanano R, Kaufmann SH. Nitric oxide production and mycobacterial growth inhibition by murine alveolar macrophages: the sequence of rIFN-gamma stimulation and Mycobacterium bovis BCG infection determines macrophage activation. ImmunolLett. 1995;45:23–27.
- Cambier CJ, Takaki KK, Larson RP, et al. Mycobacteria manipulate macrophage recruitment through coordinated use of membrane lipids. Nature. 2014;505(7482):218–222.
- Bogdan C. Nitric oxide and the immune response. Nat Immunol. 2001;2(10):907–916.
- Duque-Correa MA, Kühl AA, Rodriguez PC, et al. 2014. Macrophage Arginase-1 controls bacterial growth and pathology in hypoxic tuberculosis granulomas. Proc Natl Acad Sci U S A. 2014 Sep 23;111(38):E4024-32.
- Mishra BB, Rathinam VA, Martens GW, et al. Nitric oxide controls the immunopathology of tuberculosis by inhibiting NLRP3 inflammasome-dependent processing of IL-1beta. Nat Immunol. 2013;14(1):52–60.
- Mattila JT, Ojo OO, Kepka-Lenhart D, et al. Microenvironments in tuberculous granulomas are delineated by distinct populations of macrophage subsets and expression of nitric oxide synthase and arginase isoforms. J Immunol. 2013;191(2):773–784.
- Voskuil MI, Schnappinger D, Visconti KC, et al. Inhibition of respiration by nitric oxide induces a Mycobacterium tuberculosis dormancy program. J Exp Med. 2003;198(5):705–713.
- Gengenbacher M, Kaufmann SH. Mycobacterium tuberculosis : success through dormancy. FEMS Microbiol Rev. 2012;36(3):514–532.
- Hostetter J, Huffman E, Byl K, et al. Inducible nitric oxide synthase immunoreactivity in the granulomatous intestinal lesions of naturally occurring bovine Johne’s disease. Vet Pathol. 2005;42(3):241–249.
- Fernandez M, Benavides J, Castano P, et al. Macrophage subsets within granulomatous intestinal lesions in bovine paratuberculosis. Vet Pathol. 2017;54(1):82–93.
- Cheng Y, Huang C, Tsai HJ. Relationship of bovine NOS2 gene polymorphisms to the risk of bovine tuberculosis in Holstein cattle. J Vet Med Sci. 2016;78(2):281–286.