
ABSTRACT
Streptococcus pyogenes (group A streptococcus; GAS) causes a variety of invasive diseases (iGAS) such as bacteremia, toxic shock syndrome, and pneumonia, which are associated with high mortality despite the susceptibility of the bacteria to penicillin ex vivo. Epidemiologic studies indicate that respiratory influenza virus infection is associated with an increase in the frequency of iGAS diseases, including those not directly involving the lung. We modified a murine model of influenza A (IAV)-GAS superinfection to determine if viral pneumonia increased the susceptibility of mice subsequently infected with GAS in the peritoneum. The results showed that respiratory IAV infection increased the morbidity (weight loss) of mice infected intraperitoneally (i.p.) with GAS 3, 5, and 10 d after the initial viral infection. Mortality was also significantly increased when mice were infected with GAS 3 and 5 d after pulmonary IAV infection. Increased mortality among mice infected with virus 5 d prior to bacterial infection correlated with increased dissemination of GAS from the peritoneum to the blood, spleen, and lungs. The interval was also associated with a significant increase in the pro-inflammatory cytokines IFN-γ, IL-12, TNF-α, MCP-1 and IL-27 in sera. We conclude, using a murine model, that respiratory influenza virus infection increases the likelihood and severity of systemic iGAS disease, even when GAS infection does not originate in the respiratory tract.
Introduction
Streptococcus pyogenes (the group A streptococcus [GAS]) colonizes the skin and respiratory tract and can cause a variety of diseases including life-threatening invasive diseases (iGAS) such as streptococcal toxic shock syndrome (STSS), bacteremia, and deep-tissue infections. In recent decades, GAS has not been a common cause of community-acquired pneumonia (CAP), but when it occurs the severity is significant. GAS pneumonia can succeed respiratory viral infections, including those caused by influenza viruses, resulting in coinfections or superinfections. Lung biopsy analyses from the 1918 influenza A virus (IAV) pandemic revealed that 95% of the 50–100 million deaths were the result of bacterial superinfections [Citation1]. Streptococcus pneumoniae, GAS, Staphylococcus aureus, and Haemophilus influenzae were all identified as predominant pathogens; S. pneumoniae and GAS comprised 71% and 28% of positive cultures, respectively [Citation2–4]. It is noteworthy that the 1918 pandemic coincided with an epidemic of severe invasive iGAS disease caused by a particularly virulent strain with a high asymptomatic carriage rate.
Clinical and epidemiology reports show that viral and bacterial infection can result in more severe respiratory diseases in humans than occurs with either infection alone. The most studied example of virus-bacterial infection in the respiratory tract involves IAV and S. pneumonia and several reviews are available [Citation5–8]. Other respiratory viruses have been implicated in bacterial superinfections but to a lesser degree. For example, respiratory syncytial virus (RSV), parainfluenza viruses, rhinoviruses and adenovirus are linked to increased susceptibility secondary bacterial pneumonia; however, GAS is not typically associated with these viruses based on epidemiological reports [Citation9–16]. Overall, animal models of IAV-GAS superinfection support the idea that IAV induces specific changes in the lung which increases GAS adherence and internalization, suggesting a specific association between these two pathogens [Citation17,Citation18].
In addition to pneumonia, GAS causes several other invasive and non-invasive diseases which coincide temporally with seasonal influenza including acute pharyngitis, acute rheumatic fever, STSS and scarlet fever [Citation19]. Therefore, although the clinical symptoms and seasonality between GAS pharyngitis and viral respiratory diseases overlap, studies have shown that IAV specifically, but not RSV or rhinovirus, is associated with the development of severe and life threatening iGAS diseases, including diseases that do not always involve the lung [Citation19,Citation20]. For example, the incidence of all iGAS diseases in England increased by 26% in December 2010 and January 2011 in all age groups, which was accompanied by an increase in influenza virus infections, mostly due to the H1N1 virus [Citation21]. A retrospective study conducted in France found that one-third of children with laboratory-confirmed GAS infections also had laboratory-confirmed IAV or Influenza B virus (IBV) infections [Citation22]. Similarly, a study in Israel discovered there was a significant increase in GAS bacteremia during the 2009–2010 H1N1 influenza pandemic [Citation23], and the incidence of iGAS diseases in Sweden in 2012 was markedly increased in association with circulating respiratory virus levels, particularly influenza [Citation24]. The mortality linked with these superinfections is significant. For example, in California in 2009, 7 out of 10 patients with laboratory-confirmed H1N1-GAS superinfection died, including previously healthy 5- and 9-y-old girls. At least five patients suffered from bacteremia and the median age of the patients was 37 [Citation25].
Similar to IAV, IBV is also associated with iGAS diseases [Citation26]. In a study conducted in Canada, 8% of iGAS diseases between 1996 and 2008 were associated with IBV [Citation27], while a separate study found 14 of 19 patients with iGAS disease also had a previous influenza-like infection. The iGAS diseases included bacteremia, septic arthritis, endometritis, and pneumonia. Importantly, 53% of the cases were fatal and the only comorbidity was influenza virus infection [Citation28]. Perhaps most striking is the report that military recruits in the United States were less likely to experience any GAS disease if they were vaccinated against influenza compared to unvaccinated controls [Citation29]. In fact, protection against GAS diseases ranged from 50% to 77% [Citation29]. Thus, while influenza and GAS share a seasonal pattern of infection, the studies taken together suggest that patients with respiratory influenza virus infections are more susceptible to iGAS diseases in general, including those not originating, or necessarily involving the lung.
Influenza-bacterial pneumonia has been extensively studied; however, we were interested in exploring and modelling the idea that a respiratory influenza virus infection could also result in increased host-susceptibility to iGAS disease that did not originate in the respiratory tract. To do so, we modified a murine model by first infecting lungs of mice with a non-lethal dose of IAV and then inoculating the mice intraperitoneally (i.p.) with a non-lethal dose of GAS. Although i.p. injection is not a typical GAS infection model, it is minimally stressful for animals and an excellent portal of entry into the systemic circulation [Citation30]. Thus, i.p. injection mimics the more severe, life-threatening forms of iGAS disease, which are clinically associated with prior IAV infections. Overall, we found that antecedent viral infection significantly increased the susceptibility of mice to iGAS disease.
Results
The morbidity and mortality of an IAV superinfection initiated with non-pulmonary inoculation of GAS was greater compared to GAS infection alone
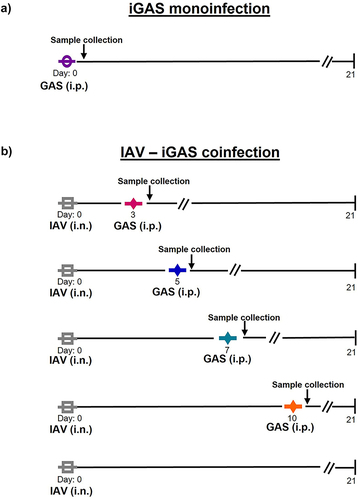
To test the idea that respiratory IAV infection increases systemic susceptibility to iGAS diseases that do not originate in the lung, we modified a pulmonary-based murine model of IAV superinfection [Citation17,Citation18,Citation31–33]. Balb/C mice were first inoculated intranasally (i.n.) with a non-lethal (106.5 median tissue culture infectious dose (TCID50)/mL) dose of IAV (H3N2 strain HK68). After 3, 5, 7 or 10 d, separate groups of these IAV infected mice were then inoculated intraperitonially (i.p.) with a non-lethal dose of GAS (strain MGAS315 [5.5 × 10⁵ CFUs]). Controls included groups of mice inoculated with a single non-lethal dose of only IAV (i.n.) or GAS (i.p.) on day 0. A summary of the inoculation schedule and groups of mice is shown in .
Figure 1. Development of a murine model of iGAS infection and IAV – iGAS coinfection. a) Balb/C mice were intraperitoneally (i.p.) inoculated with a non-lethal dose of the GAS strain MGAS315 on day 0 and morbidity and mortality were monitored for 21 d (n = 16). b) separate groups of Balb/C mice were intranasally (i.n.) infected with a non-lethal dose of IAV (HK68) followed by a non-lethal intraperitoneal (i.p.) infection with MGAS315 on days 3, 5, 7, or 10 and morbidity and mortality were determined (n = 16 IAV only; n = 8 superinfected groups). In some experiments blood, lungs and spleens were collected 24 h after GAS infection for bacterial quantification and serum cytokine analysis. Additional controls included infecting mice with a non-lethal dose of IAV only and monitoring morbidity and mortality.
All the mice inoculated only with IAV survived. Similarly, 92% of the mice inoculated only with GAS survived (). In contrast, 50% of mice infected with GAS 3 d after IAV infection survived and only 12.5% survived when infected with GAS 5 d after IAV infection. These data show that a non-lethal pulmonary IAV infection significantly increased the mortality (p < 0.05; 95% CI = −74.7 to 19.1) of mice inoculated with an otherwise non-lethal dose of GAS. GAS infection 7 and 10 d after IAV inoculation also increased mortality; however, the differences were not statistically significant ().
Figure 2. Mortality and morbidity are dependent on the timing of IAV-iGAS coinfection. Mice were inoculated with a non-lethal dose of IAV on day 0. On day 3 and 5 separate groups of mice were inoculated i.p. With a non-lethal dose of GAS. Mice were monitored for a) Survival and b) Weighted daily for 21 days. On day 7 and 10 separate groups of mice were inoculated i.p. With a non-lethal dose of GAS. Mice were monitored for c) Survival and d) Weighted daily for 21 d. The percent of the initial weight was calculated as an indicator of morbidity. For monoinfected animals (IAV or GAS only), groups of 8 mice were used, and two independent experiments were done resulting in groups of 16 mice. For superinfected mice groups of 4 mice were used and 2 individual experiments were completed resulting in 8 mice per group. A Kaplan–Meier survival analysis was used to compare the differences in mortality. The area under the curve analysis (AUC) was completed prior to a one-way ANOVA to compare the differences in morbidity.
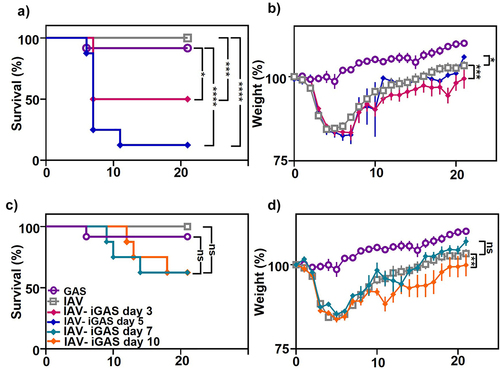
Mice that received a single non-lethal dose of GAS i.p. did not lose weight, a measure that is used as an indicator of morbidity in this model (). Previous murine models of IAV-GAS superinfection have shown that IAV-mediated weight loss (prior to GAS inoculation) is dictated by the viral strain, and increased weight loss from the IAV infection does not correlate to superinfection outcome [Citation34]. As expected based on previous studies, a non-lethal dose of the HK68 IAV inoculated into the lungs of mice resulted in immediate weight loss, with subsequent recovery for all infected animals [Citation17]. Groups of mice that were first infected with IAV and then with GAS 3 or 5 d later lost weight and the weight loss reached its lowest point 8 days after IAV infection, compared to 5 days for mice infected with IAV only. Overall, morbidity was significantly greater in groups of mice infected with GAS 3 d (p < 0.0001; 95% CI = 34.3 to 67.7) or 5 d (p < 0.05; 95% CI = 1.3 to 34.7) after IAV, compared to those infected with IAV alone.
Mice infected with GAS 7 or 10 d after IAV infection showed a second period of weight loss in the days following the GAS infection, although mice infected from a GAS only infection never lost weight (). Compared to mice infected with IAV only, weight loss with a 7-d interval was not statistically significant, while it was (p < 0.001; 95% CI = 45.3 to 78.7) with a 10-d interval. Together, the results show that the morbidity and mortality associated with an iGAS infection at a non-pulmonary site was significantly increased after respiratory IAV infection.
The viable bacteria in the blood, lungs and spleen increased among superinfected mice
To determine if pulmonary IAV infection increased dissemination of GAS from the peritoneal cavity, we quantified viable GAS recovered from the blood, spleen, and lungs of mice 24 h after GAS infection. Specifically, mice were infected i.n. with a non-lethal dose of IAV followed 3, 5, 7, or 10 d later by inoculation (i.p.) with a non-lethal dose of GAS. Blood and tissues were collected 24 h after GAS infection (). As a control, mice were inoculated (i.p.) with only GAS. In one of four mice infected with GAS only, 2 × 10² CFUs/mL bacteria were recovered from the blood; the other three mice in the group did not have detectable levels of GAS in their blood samples. In contrast, a mean value of 7.6 × 10⁴ CFUs/mL and 4.9 × 10⁴ CFUs/mL was recovered from the blood of mice infected with IAV 5 or 7 d (p < 0.05) prior to GAS infection () and bacteria were detected in samples from all the mice in these groups. The frequency of detectable GAS and the amount were increased in mice that had a prior viral infection.
Figure 3. Viable GAS detected in the blood and tissues of iGAS and IAV- iGAS coinfected mice. Bacterial quantitation in iGAS infected and IAV-iGAS coinfected mice were determined in a) Blood b) Spleen c) Lungs 24 h after GAS infection. All experiments were performed in groups of 4 Balb/c mice. Statistical analysis was performed using the Mann–Whitney test among the indicated groups. Where no p value is shown the groups were not statistically different.
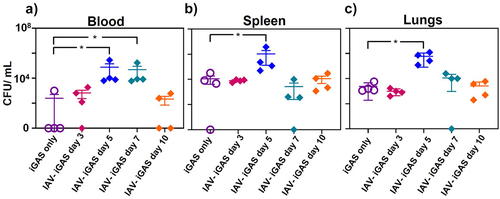
A mean value of 1.1 × 10⁴ CFUs/mL of GAS were detected in the spleens of mice infected only with GAS (), while significantly greater viable bacteria (1 × 10⁶ CFUs/mL) were detected in spleens from mice infected 5 d earlier with IAV (p < 0.05). Additionally, a mean value of 2.4 × 10³ CFUs/mL of GAS was present in the lungs of mice infected only with GAS (), whereas 5.9 × 10⁵ CFUs/mL were present in mice infected 5 d earlier with IAV (p < 0.05). We note that other intervals between IAV and GAS inoculation (days 3, 7, and 10) did not result in significantly different levels of GAS detected in the spleen and lungs of superinfected mice compared to mice infected with GAS only. These results support the idea that pulmonary influenza virus infection hinders the clearance of GAS from the blood and promotes bacterial dissemination, which was associated with increased morbidity and mortality.
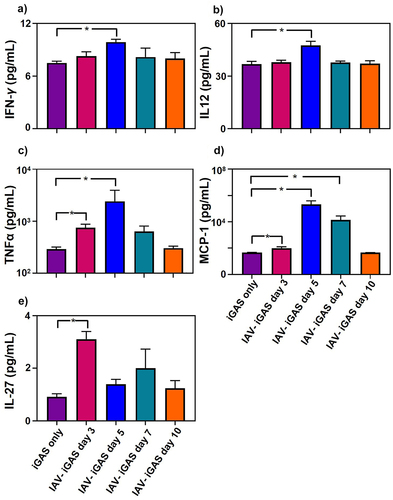
Figure 4. Inflammatory serum cytokine profiles of iGAS and IAV-iGAS coinfected mice. Protein concentrations of a) IFN-γ b) IL-12, c) TNF-α, d) MCP-1, and e) IL-27 were determined in the serum of 4 individual mice per group 24 h after iGAS infection or 24 h after IAV- iGAS infection from mice infected with iGAS 3, 5, 7, or 10 d after IAV. Serum cytokine concentrations were determined by using flow cytometry. Statistical analysis was performed between single and coinfected mice using a one-way ANOVA with Tukey’s multiple comparisons test. Where no p value is shown the groups were not statistically different.
Antecedent IAV infection increased the abundance of pro-inflammatory cytokines following iGAS infection
We assessed the cytokine response to GAS infections by quantitating IL-1α, IFN-γ, TNF-α, MCP-1, IL-12, IL-10, IL-6, IL-27, IL-17A, and GM-CSF in murine sera collected 24 h after i.p. inoculation with either GAS alone or GAS inoculation following respiratory IAV infection ( and Supplementary Table S1). Compared to the response against a GAS infection alone, IFN- γ, IL-12, TNF-α, and MCP-1 were more abundant (p < 0.05) in the sera of mice infected 5 d earlier with IAV. Specifically, IFN- γ levels were 7 ± 0.2 pg/mL among GAS monoinfected mice but were 11 ± 1 pg/mL among mice infected 5 d earlier with IAV. IL-12 levels were 37 ± 2 pg/mL among GAS monoinfected mice and increased to 48 ± 2 pg/mL among mice infected 5 d earlier with IAV. TNF-α levels were 290 ± 6 pg/mL among GAS monoinfected mice but were 755 ± 26 pg/mL and 2,412 ± 733 pg/mL, respectively, among mice infected 3 or 5 d earlier with IAV. The chemokine MCP-1 in serum was 47 ± 0.7 pg/mL in mice infected with GAS only, and increased to 100 ± 15 pg/mL, 207,000 ± 36, 000 pg/mL, and 14,000 ± 4,000 pg/mL among mice infected 3, 5, or 7 d earlier with IAV, respectively. The concentrations of the other inflammatory mediators measured did not show significant differences between mice infected with GAS only and those infected with both IAV and GAS (Fig. S1). Collectively, our data demonstrated that a preceding IAV infection of the respiratory tract intensified non-respiratory GAS infection by promoting inflammation, as shown by elevated cytokine levels.
Discussion
In this study, we modified an established murine model to investigate host susceptibility to non-pulmonary-initiated iGAS disease following a respiratory viral infection. Morbidity was significantly increased among mice with a lower respiratory IAV infection which were subsequently infected in the peritoneal cavity with GAS, even when the interval between viral and bacterial infection was up to 10 d (mice recovered from the initial IAV infection after 5 days based on body weight) (). We also noted an increase in mortality among superinfected mice (). The highest mortality (87.5%) was observed with a 5-d interval between viral and bacterial infection and was associated with a significant increase in the level of GAS detected in the spleen, blood, and lungs compared to mice not previously infected with IAV. We hypothesize that the increase in viable CFUs in the lungs and spleen is likely a reflection of the GAS in the blood. This 5-d interval also resulted in the greatest increase in proinflammatory cytokines compared to mice inoculated with only GAS. Overall, the results showed that an antecedent IAV respiratory infection increased susceptibility of mice to non-pulmonary initiated GAS infection.
In our model, superinfection mortality was greatest when the interval between IAV and iGAS infection was 3–5 d (), which is consistent with several clinical reports [Citation21,Citation35,Citation36]. For example, in a recent report, 25/97 (26%) of iGAS infections and 5/10 (50%) of these resulting deaths in children in the UK during November 2022 were identified to also have a viral respiratory infection within days of the iGAS infection [Citation37]. Additionally, weekly laboratory reports of the respiratory viruses IAV, IBV, RSV, and rhinovirus and weekly reports of iGAS diseases were compared over 10 y [Citation35]. The results of the comparison showed a significant (P = 0.007) association (as many as 40%) between STSS cases and increased IAV activity [Citation35]. In this report, none of the other iGAS diseases (necrotizing fasciitis (NF), sepsis, bacteremia, upper or lower respiratory tract specimens, genital tract specimens or pus or wounds), were associated with weekly reports of any respiratory virus detections. These results suggest that IAV circulation increases the risk of STSS, one of the most severe iGAS diseases.
Additionally, in a 2009 study, 85% of patients with an invasive bacterial infection (including iGAS) had been previously diagnosed with IAV within 7 d of the bacterial infection [Citation21]. We compared GAS infection and GAS infection following pulmonary IAV infection by measuring the morbidity, mortality, amount of viable GAS present in organs, and serum cytokine levels to gain preliminary insight into the impact of viral infection on non-pulmonary GAS disease. Aleith et al. also demonstrated increased morbidity (paw inflammation) and mortality in superinfected mice by using a model of pulmonary IAV infection followed by intravenous GAS superinfection [Citation38]. Importantly, they reported that an IAV infection elicited after intravenous GAS infection did not increase disease severity, but that decreased CCL2 (a monocyte chemokine) in plasma at 2 and 4 d following IAV likely alters an otherwise competent anti-bacterial immune response [Citation38]. This is consistent with our data. Specifically, GAS was only detected in the blood of 1 mouse and only 1 mouse succumbed to infection in a GAS monoinfection (). However, GAS was cultured at significantly higher amounts from the blood of all 4 mice and 87.5% of the mice died when IAV infection preceded GAS by 5 d suggesting decreased bacterial clearance in the blood of superinfected mice. In addition to the murine superinfection studies, Aleith et al. detected altered expression in superinfected bone marrow derived macrophages compared to macrophages infected with only GAS [Citation38]. Together, these studies support the model that prior pulmonary virus infection modifies anti-streptococcal immunity.
When measuring serum cytokine levels in the 24 h after exposure to GAS, it was evident that IAV infection at 3 and 5 d post-influenza yielded increases in pro-inflammatory cytokines that coincided with increased morbidity and mortality in this model. Interestingly, similar results were obtained using an IAV-Listeria monocytogenes murine model [Citation39]. In that study, there was an increase in IFN-γ and IL-12 when mice were initially infected in the respiratory tract with influenza virus prior to systemic infection with L. monocytogenes. The pro-inflammatory cytokine response against respiratory IAV infection increased glucocorticoids and suppressed innate immunity, which contributed to susceptibility to a systemic L. monocytogenes infection. Taken together with our results, this shows that influenza virus infections can have an impact on susceptibility to bacterial infections at distant sites.
Cytokine studies of IAV-GAS superinfection have primarily investigated cytokine levels in the lungs following IAV infection. Specifically, Chaussee et al. showed that pro-inflammatory cytokines (IL-6, TNF-α, IFN-γ) in bronchoalveolar lavage fluid were elevated in unvaccinated mice compared to mice which were vaccinated against IAV prior to IAV-GAS challenge [Citation32]. Additionally, Klonoski et al. showed that different IAV used for infection influenced the cytokine profiles the lung, which impacted superinfection outcome [Citation34]. While our model aimed to determine the systemic cytokine response to GAS with or without prior IAV, we appreciate that cytokines are recruited to the lung in response to IAV may have an impact IAV-GAS superinfection outcome. For example, TNF-α has a role in the early response against viral infection by stimulating immune cell infiltration to the site of infection. However, excessive TNF-α production following IAV leads to the over-production of cytokines and chemokines, forming a cytokine storm [Citation40]. TNF-α also induces apoptosis of various cells decreasing the epithelial barrier integrity. In contrast, others have shown a protective effect for TNF-α in IAV coinfections. TNF-α neutralization increased mortality during single S. pneumoniae infection as well as coinfections with IAV [Citation41–45]. Overall, our studies show that increased TNF-α along with prior IAV lung infection may have increased host tissue damage and negatively influenced bacterial clearance.
Neutrophils and macrophages are known to play an important role in both the innate and adaptive responses against IAV infection. A study directly evaluating neutrophil contributions towards secondary bacterial infections showed that depletion of neutrophils using antibodies did not interfere with clearance of bacteria [Citation46]. Others show that the recruitment of neutrophil cells into the lungs of mice differs based on the IAV used for infection and can have profound effects on superinfection outcomes [Citation34]. Additionally, host macrophages are strongly influenced by the cytokine environment after IAV, and the loss of macrophages function in the lung is historically observed with IAV-superinfection models [Citation47–50]. Thus, immune cell populations are transient during infections, especially those involving more than one pathogen. Induction of specific immune cell population, and the cytokine environment that develops, has apparent effects on severity of a secondary bacterial infection and is of significant interest to our future studies.
The current study has an important limitation. Only one strain of GAS was used in our animal model. The clinical isolate, designated MGAS315, is genetically representative of contemporary M3 strains and we choose to use this isolate for several reasons [Citation51]. First, GAS serotypes M1 and M3 are most commonly associated with IAV coinfection [Citation28], pneumonia, and other iGAS diseases [Citation52]. Additionally, MGAS315 is highly virulent (requiring a low inoculum), and it is used in a variety of animal models including a non-human primate model of lower respiratory tract infection.
In conclusion, we modelled iGAS diseases not originating in the respiratory tract that are associated with antecedent IAV infection. The model will be useful in identifying the molecular underpinnings of the observations and is relevant to other viruses that enhance host susceptibility to iGAS diseases. These models will aid in the design of adjunct therapeutics to decrease the morbidity and mortality of iGAS disease associate with influenza and perhaps other coinfecting viruses.
Methods
Mice
Balb/C female mice (6 and 8 weeks of age) were purchased from Jackson Laboratories (Indianapolis, IN, USA). All animal experiments were conducted in accordance with the recommendations in the Guide for the Care and Use of Laboratory Animals of the National Institutes of Health and according to the guidelines of the local Institutional Animal Care and Use Committee of the University of South Dakota. All efforts were made to minimize suffering, ensure the highest ethical standard, and adhere to the 3 R principle (reduction, refinement, and replacement).
Influenza and GAS
Influenza virus (A/Hong Kong/1/68-H3N2; HK68) was created using the PR8 reverse genetic system as described [Citation53] and propagated at 35°C for 72 h in the allantoic cavities of 10-d-old embryonated chicken eggs [Citation33,Citation53]. As described previously [Citation33], viral RNA was sequenced to confirm genotype. Viral titres (50% tissue culture infectious dose; TCID50) were determined using MDCK (Madin-Darby Canine Kidney) cells. GAS isolate MGS315 (serotype M3) was obtained from ATCC and stored at −80°C in 50% glycerol stocks. The bacteria were cultured with Todd Hewitt yeast (THY) medium at 37°C to the mid-exponential phase prior to inoculation.
Superinfection model
All mice were lightly anesthetized with 2.5% isoflurane prior to inoculations. For monoinfected control infected mice, a total of 16 mice (8 mice in 2 separate experiments) were inoculated (i.n.) with 106.5 TCID50 of IAV in 100 μL with phosphate-buffered saline (PBS); 50 µL per nostril or with MGAS315 (1 × 10⁶ CFUs/mL in 500 µL PBS). The i.p. injections were administered using a 25-gauge needle, which was inserted at approximately 45° into the side of the abdominal wall. For superinfected mice, groups of 8 mice (4 mice per group in 2 separate experiments) were inoculated (i.n.) with IAV followed by MGAS315 (i.p) 3, 5, 7, or 10 d later. Animal health and behavior was monitored at least three times a day over the 21-d course of the experiment. Body weight and deaths were recorded daily. Clinical signs of IAV in mice include anorexia, dehydration, respiratory distress, hypothermia, hunched posture, unkempt hair coat and ocular discharge; anorexia and dehydration are common signs of IAV infection that leads to excessive weight loss in mice [Citation54–56]. Endpoint criteria included extreme clinical signs of infection (huddling, hunched posture, ruffled fur, tachypnoea), severe hypothermia as indicated by a temperature of 34°C (~4.5°C below normal), and weight loss equal to or greater than 20% of starting weight. Mice with one or more of these symptoms were immediately euthanized, and the infection was considered lethal.
GAS quantification in the blood and organs of mice
To determine the number of viable GAS present in the blood, spleen or lungs of mice, groups of 4 mice previously infected with IAV or not, were euthanized 24 h after inoculation (i.p.) with GAS. Whole tissues were collected and transferred to 2 mL tubes with 1 mL sterile PBS and manually homogenized with a disposable sterile grinding rod until a homogenate appeared. Samples were centrifuged at 5500 rpm/min for 20 s to spin down impurities. Blood samples were collected by cardiac puncture of euthanized animals. GAS were enumerated by dilution plating on blood agar (TSA with 5% sheep blood) plates as previously described [Citation57]. Specifically, 100 µl of the tissue homogenate or blood was added to 900 µl sterile PBS to make a 10−1 dilution; 10-fold serial dilutions were then made. A 20 µl–200 µl of each homogenate (10°–10−3) were spread on a full blood agar plate and incubated overnight at 37°C with 5% CO2. Results were calculated as CFU per mL of the total tissue homogenate.
Measurement of serum cytokines
Whole blood was collected 24 h after GAS inoculation, left at room temperature for 15–30 min and then centrifuged at 1,000 × g for 10 min. Sera were removed and samples stored at −80°C until analysis. Sera collected from 4 individual mice, per group, were run in duplicate to measure cytokine levels. Cytokine concentrations were measured with a LEGENDPlex mouse inflammation panel (13-plex) kit (BioLegend) using a V-bottom plate according to manufacturer’s instructions. Specifically, the LEGENDPlex bead-based immunoassay uses capture beads that are mixed with mouse sera and specific antibodies on the beads bind to target proteins. The addition of detection antibodies and streptavidin-phycoerythrin produces a unique fluorescent signal for each target cytokine. The fluorescent signals were measured using a BD Accuri C6 flow cytometer and data was processed with Flojo software. IL-23, IL1-β, and IFN-β failed to generate a standard curve with the mouse cytokine control cocktail and were excluded from our analysis.
Statistics and image production
All quantification and statistical analyses of data was performed with GraphPad Prism 9 software. Statistical analyses included a one-way analysis of variance (ANOVA) with a Tukey’s multiple comparisons post-test, Kaplan Meier survival analysis, or a Student’s t-test, as appropriate.
Supplemental Material
Download Zip (249.8 KB)Acknowledgements
Research reported in this publication was supported by an Institutional Development Award (IDeA) from the National Institute of General Medical Sciences of the National Institutes of Health under grant number P20GM103443. Its contents are solely the responsibility of the authors and do not necessarily represent official views of NIGMS or NIH. This research was also funded by the South Dakota Center for Biologics Research and Commercialization (SD-CBRC) from the SD GOED Governors Research Center.
Disclosure statement
No potential conflict of interest was reported by the author(s).
Data availability statement
Raw data were generated at the University of South Dakota. Derived data supporting the findings of this study are available from the corresponding author ALH on request.
Supplemental data
Supplemental data for this article can be accessed online at https://doi.org/10.1080/21505594.2023.2265063
Additional information
Funding
References
- Morens DM, Fauci AS. The 1918 influenza pandemic: insights for the 21st century. J Infect Dis. 2007;195(7):1018–11. doi: 10.1086/511989
- Brundage JF, Shanks GD. Deaths from bacterial pneumonia during 1918-19 influenza pandemic. Emerg Infect Dis. 2008;14(8):1193–1199. doi: 10.3201/eid1408.071313
- Chien YW, Klugman KP, Morens DM. Bacterial pathogens and death during the 1918 influenza pandemic. N Engl J Med. 2009;361(26):2582–2583. doi: 10.1056/NEJMc0908216
- Birge E, Havens L. A comparison of the bacteriology of pneumonia, antemortem and postmortem. N Y Med J. 1919;109:544–545.
- McCullers JA. The co-pathogenesis of influenza viruses with bacteria in the lung. Nat Rev Microbiol. 2014;12(4):252–262. doi: 10.1038/nrmicro3231
- McCullers JA. Insights into the interaction between influenza virus and pneumococcus. Clin Microbiol Rev. 2006;19(3):571–582. doi: 10.1128/CMR.00058-05
- Metzger DW, Sun K. Immune dysfunction and bacterial coinfections following influenza. J Immunol. 2013;191(5):2047–2052. doi: 10.4049/jimmunol.1301152
- Rynda-Apple A, Robinson KM, Alcorn JF, et al. Influenza and bacterial superinfection: illuminating the immunologic mechanisms of disease. Infect Immun. 2015;83(10):3764–3770. doi: 10.1128/IAI.00298-15
- Michelow IC, Olsen K, Lozano J, et al. Epidemiology and clinical characteristics of community-acquired pneumonia in hospitalized children. Pediatrics. 2004;113(4):701–707. doi: 10.1542/peds.113.4.701
- Berkley JA, Munywoki P. Viral etiology of severe pneumonia among Kenyan infants and children. JAMA. 2010;303(20):2051–2057. doi: 10.1001/jama.2010.675
- Olsen SJ, Thamthitiwat S, Chantra S, et al. Incidence of respiratory pathogens in persons hospitalized with pneumonia in two provinces in Thailand. Epidemiol Infect. 2010;138(12):1811–1822. doi: 10.1017/S0950268810000646
- Hammitt LL, Kazungu S, Morpeth SC, et al. A preliminary study of pneumonia etiology among hospitalized children in Kenya. Clinl Infect Dis. 2012;54(Suppl 2):S190–9. doi: 10.1093/cid/cir1071
- Chen CJ, Lin P-Y, Tsai M-H, et al. Etiology of community-acquired pneumonia in hospitalized children in northern Taiwan. Pediatr Infect Dis J. 2012;31(11):e196–201. doi: 10.1097/INF.0b013e31826eb5a7
- Techasaensiri B, Techasaensiri C, Mejías A, et al. Viral coinfections in children with invasive pneumococcal disease. Pediatr Infect Dis J. 2010;29(6):519–523. doi: 10.1097/INF.0b013e3181cdafc2
- Peltola VT, McCullers JA. Respiratory viruses predisposing to bacterial infections: role of neuraminidase. Pediatr Infect Dis J. 2004;23(1 Suppl):S87–97. doi: 10.1097/01.inf.0000108197.81270.35
- Peltola V, Heikkinen T, Ruuskanen O, et al. Temporal association between rhinovirus circulation in the community and invasive pneumococcal disease in children. Pediatr Infect Dis J. 2011;30(6):456–461. doi: 10.1097/INF.0b013e318208ee82
- Herrera AL, Suso K. Binding host proteins to the M protein contributes to the mortality associated with influenza-Streptococcus pyogenes superinfections. Microbiology. 2017;163(10):1445–1456. doi: 10.1099/mic.0.000532
- Herrera AL, Faal H, Moss D, et al. The Streptococcus pyogenes fibronectin/tenascin-binding protein PrtF.2 contributes to virulence in an influenza superinfection. Sci Rep. 2018;8(1):12126. doi: 10.1038/s41598-018-29714-x
- Herrera AL, Huber VC, Chaussee MS. The association between invasive group a streptococcal diseases and viral respiratory tract infections. Front Microbiol. 2016;7:342. doi: 10.3389/fmicb.2016.00342
- de Gier B, Woudt SHS, van Sorge NM, et al. Associations between common respiratory viruses and invasive group a streptococcal infection: a time-series analysis. influenza and other respiratory viruses. Influenza Other Respir Viruses. 2019 Sep;13(5):453–458. [cited 2019 Jun 25] doi: 10.1111/irv.12658
- Zakikhany K, Degail MA, Lamagni T, et al. Increase in invasive Streptococcus pyogenes and Streptococcus pneumoniae infections in England, December 2010 to January 2011. Euro Surveill. 2011;16(5): doi: 10.2807/ese.16.05.19785-en
- Parola P, Colson P, Dubourg G, et al. Letter to the editor. Group a streptococcal infections during the seasonal influenza outbreak 2010/11 in South East England. Euro Surveill. 2011;16(11): doi: 10.2807/ese.16.11.19816-en
- Tasher D, Stein M, Simões EAF, et al. Invasive bacterial infections in relation to influenza outbreaks, 2006–2010. Clin Infect Dis. 2011;53(12):1199–1207. doi: 10.1093/cid/cir726
- Glans H, Rönnbäck K, Berggren I, et al. [Increase in serious infections due to group a streptococci]. Lakartidningen. 2013;110(22):1094–1097.
- Jean C, Louie J, Glaser C, et al. Invasive group a streptococcal infection concurrent with 2009 H1N1 influenza. Clin Infect Dis. 2010;50(10):e59–62. doi: 10.1086/652291
- Aebi T, Weisser M. Co-infection of influenza B and streptococci causing severe pneumonia and septic shock in healthy women. 2010; 10:308.
- Allard R, Couillard M, Pilon P, et al. Invasive bacterial infections following influenza: a time-series analysis in Montréal, Canada, 1996-2008. influenza other Respir viruses. Influenza Other Respir Viruses. 2012;6(4):268–275. doi: 10.1111/j.1750-2659.2011.00297.x
- Scaber J, Saeed S, Ihekweazu C, et al. Group a streptococcal infections during the seasonal influenza outbreak 2010/11 in South East England. Euro Surveill. 2011;16(5): doi: 10.2807/ese.16.05.19780-en
- Lee SE, Eick A, Bloom MS, et al. Influenza immunization and subsequent diagnoses of group a streptococcus-illnesses among U.S. Army trainees, 2002–2006. Vaccine. 2008;26(27–28):3383–3386. doi: 10.1016/j.vaccine.2008.04.041
- Turner PV, Brabb T, Pekow C, et al. Administration of substances to laboratory animals: routes of administration and factors to consider. J Am Assoc Lab Anim Sci. 2011;50(5):600–613.
- Herrera AL, Van Hove C, Hanson M, et al. Immunotherapy targeting the Streptococcus pyogenes M protein or streptolysin O to treat or prevent influenza a superinfection. PLoS One. 2020;15(6):e0235139. doi: 10.1371/journal.pone.0235139
- Chaussee MS, Sandbulte HR, Schuneman MJ, et al. Inactivated and live, attenuated influenza vaccines protect mice against influenza: Streptococcus pyogenes super-infections. Vaccine. 2011;29(21):3773–3781. doi: 10.1016/j.vaccine.2011.03.031
- Klonoski JM, Hurtig HR, Juber BA, et al. Vaccination against the M protein of Streptococcus pyogenes prevents death after influenza virus: S. pyogenes super-infection. Vaccine. 2014;32(40):5241–5249. doi: 10.1016/j.vaccine.2014.06.093
- Klonoski JM, Watson T, Bickett TE, et al. Contributions of influenza virus hemagglutinin and host immune responses toward the severity of influenza virus: Streptococcus pyogenes superinfections. Viral Immunol. 2018;31(6):457–469. doi: 10.1089/vim.2017.0193
- de Gier B, Vlaminckx BJM, Woudt SHS, et al. Associations between common respiratory viruses and invasive group a streptococcal infection: a time-series analysis. Influenza Other Respir Viruses. 2019;13(5):453–458. doi: 10.1111/irv.12658
- Ochi F, Tauchi H, Jogamoto T, et al. Sepsis and pleural empyema caused by Streptococcus pyogenes after influenza a virus infection. Case Rep Pediatr. 2018;2018:1–4. doi: 10.1155/2018/4509847
- Guy R, Henderson KL, Coelho J, et al. Increase in invasive group a streptococcal infection notifications, England, 2022. Euro Surveill. 2023;28(1): doi: 10.2807/1560-7917.ES.2023.28.1.2200942
- Aleith J, Brendel M, Weipert E, et al. Influenza a virus exacerbates group a Streptococcus infection and thwarts anti-bacterial inflammatory responses in murine macrophages. Pathogens. 2022;11(11):1320. doi: 10.3390/pathogens11111320
- Jamieson AM, Yu S, Annicelli CH, et al. Influenza virus-induced glucocorticoids compromise innate host defense against a secondary bacterial infection. Cell Host Microbe. 2010;7(2):103–114. doi: 10.1016/j.chom.2010.01.010
- Tisoncik JR, Korth MJ, Simmons CP, et al. Into the eye of the cytokine storm. Microbiol Mol Biol Rev. 2012;76(1):16–32. doi: 10.1128/MMBR.05015-11
- Ellis GT, Davidson S, Crotta S, et al. TRAIL + monocytes and monocyte-related cells cause lung damage and thereby increase susceptibility to influenza– S treptococcus pneumoniae coinfection. EMBO Rep. 2015;16(9):1203–1218. doi: 10.15252/embr.201540473
- Kirby AC, Raynes JG, Kaye PM. The role played by tumor necrosis factor during localized and systemic infection with Streptococcus pneumoniae. J Infect Dis. 2005;191(9):1538–1547. doi: 10.1086/429296
- Hussell T, Pennycook A, Openshaw PJ. Inhibition of tumor necrosis factor reduces the severity of virus-specific lung immunopathology. Eur J Immunol. 2001;31(9):2566–2573. doi: 10.1002/1521-4141(200109)31:9<2566:AID-IMMU2566>3.0.CO;2-L
- La Gruta NL, Kedzierska K, Stambas J, et al. A question of self-preservation: immunopathology in influenza virus infection. Immunol Cell Biol. 2007;85(2):85–92. doi: 10.1038/sj.icb.7100026
- Marcos-Ramiro B, García-Weber D, Millán J. TNF-induced endothelial barrier disruption: beyond actin and rho. Thromb Haemost. 2014;112(6):1088–1102. doi: 10.1160/th14-04-0299
- Stegemann S, Dahlberg S, Kröger A, et al. Increased susceptibility for superinfection with Streptococcus pneumoniae during influenza virus infection is not caused by TLR7-mediated lymphopenia. PLoS One. 2009;4(3):e4840. doi: 10.1371/journal.pone.0004840
- Astry CL, Jakab GJ. Influenza virus-induced immune complexes suppress alveolar macrophage phagocytosis. J Virol. 1984;50(2):287–292. doi: 10.1128/jvi.50.2.287-292.1984
- Jakab GJ. Immune impairment of alveolar macrophage phagocytosis during influenza virus pneumonia. Am Rev Respir Dis. 1982;126(5):778–782. doi: 10.1164/arrd.1982.126.5.778
- Warr GA, Jakab GJ. Alterations in lung macrophage antimicrobial activity associated with viral pneumonia. Infect Immun. 1979;26(2):492–497. doi: 10.1128/iai.26.2.492-497.1979
- Sun K, Metzger DW. Inhibition of pulmonary antibacterial defense by interferon-gamma during recovery from influenza infection. Nat Med. 2008;14(5):558–564. doi: 10.1038/nm1765
- Beres SB, Sylva GL, Barbian KD, et al. Genome sequence of a serotype M3 strain of group a Streptococcus: phage-encoded toxins, the high-virulence phenotype, and clone emergence. Proc Natl Acad Sci U S A. 2002;99(15):10078–10083. doi: 10.1073/pnas.152298499
- Muller MP, Low DE. Clinical and epidemiologic features of group a streptococcal pneumonia in Ontario, Canada. Arch Intern Med. 2003;163(4):467–472. doi: 10.1001/archinte.163.4.467
- Huber VC, Thomas PG, McCullers JA. A multi-valent vaccine approach that elicits broad immunity within an influenza subtype. Vaccine. 2009;27(8):1192–1200. doi: 10.1016/j.vaccine.2008.12.023
- Sanders CJ, Johnson B. Intranasal influenza infection of mice and methods to evaluate progression and outcome. Methods Mol Biol. 2013;1031:177–188.
- Trammell RA, Toth LA. Markers for predicting death as an outcome for mice used in infectious disease research. Comp Med. 2011;61(6):492–498.
- Bouvier NM, Lowen AC. Animal models for influenza virus pathogenesis and transmission. Viruses. 2010;2(8):1530–1563. doi: 10.3390/v20801530
- Herrera AL, Callegari EA, Chaussee MS, et al. The Streptococcus pyogenes signaling peptide SpoV regulates streptolysin O and enhances survival in murine blood. J Bacteriol. 2021;203(11). doi: 10.1128/JB.00586-20