
Abstract
We applied seven pairs of primer-restriction enzyme combinations to investigate the genetic diversity, genetic differentiation, and genetic structure of Prunus padus populations with AFLP markers. The values obtained for average of effective alleles (Ae), percentage of polymorphic loci (%P), Shannon’s diversity index (I), and expected heterozygosity (He) were 1.38, 81.4, 0.357, and 0.223%, respectively. The expected heterozygosity (Hj) obtained by using a Bayesian method was 0.256. The level of genetic diversity obtained for P. padus was low compared to that of Prunus species and other species with a similar life history. The inbreeding coefficient (FIS) from the approximated Bayesian method was 0.767. This value was lower than that obtained for Ulmus davidiana, which undergoes both sexual and asexual reproduction. However, the value obtained was larger than that for other species that undergo sexual reproduction, such as, Carpinus laxiflora, Phellodendron amurense, and Acer pseudosieboldianum. The value of genetic differentiation was 0.245 from AMOVA (ΦST) and 0.278 from Bayesian method (θII). The obtained level of genetic differentiation was large compared to that of other Prunus species plants and other species with a similar life history. According to UPGMA and Bayesian clustering, 11 populations were divided into two genetic groups. However, some populations were detected as weak genetic structures according to the geographical distribution. It was occurred by forest succession, asexual propagation strategies to adapt local environmental change, and gene flow being gradually decreased due to population fragmentation by demographic disturbances.
Introduction
Prunus padus L. (European bird cherry) belongs to the rose family Rosaceae, genus Prunus, subgenus Padus, and is a broad-leaved species. This is the most widely distributed species of the subgenus Padus and can be found throughout South Korea, China, Japan, and Europe (Chin et al. Citation2014). It is normally up to 15 m in height and monoecious with hermaphroditic flowers. The karyotype is known as 2n = 32 of P. padus (Kalkman Citation1965; Simon and Blanché, Citation2016). This species is an intermediate successional stage species, insect-pollinated, and its seeds are dispersed by birds or mammals (Baliuckas et al. Citation2005). It is a useful landscape woody plant and has many advantages, such as rapid growth, cold and pollution tolerance.
Amplified fragment length polymorphisms (AFLP) are PCR-based markers, which is not required prior genome sequence information of the target species, and even a polyploid genome can be easily analyzed (Mba and Tohme Citation2005). AFLP markers have been applied to various studies, such as population genetics, genome mapping, DNA fingerprinting, and phylogeny. According to the application of the capillary fraction, it is possible to detect highly reproducible polymorphic fingerprint information and can be used for genetic analysis (Kumar et al. Citation2013). AFLP markers are dominant and use only phenotype information by the presence or absence of observed amplicons, not allele frequencies from genotypes. Therefore, it is difficult to accurately estimate the frequency of alleles. Statistical bias might occur because statistics used in population genetics are estimated using allele frequency information (Lynch and Milligan Citation1994). However, the development of a Bayesian statistical model made it possible to estimate an approximate allele frequency (Zhivotovsky Citation1999). Therefore, it is possible to estimate heterozygosity, genetic distance, F-statistics, and other parameters.
Approximately 200 species of the genus Prunus are present as various types of plants worldwide such as deciduous trees, evergreen trees, and shrubs. There are about 20 Prunus species native to South Korea, and 10 species grow on Jeju Island alone (Jung et al. Citation1997). There are also five subspecies, including P. padus L. var. seoulensis Nakai (Jang et al. Citation2017). The first classification of Prunus has been reported by Tournefort (Citation1700), who recognized six subgenera (Prunus, Armeniaca Miller, Cerasus Miller, Persica Miller, Amygdalus L., and Laurocerasus Tournefort ex Duh.) based on their fruit morphology (Liu et al. Citation2013). Rehder (Citation1940) reclassified these to five subgenera, Amygdalus (peaches and almonds), Cerasus (cherries), Prunus (plums), Laurocerasus (evergreen laurel-cherries), and Padus (deciduous bird-cherries) have been accepted as species in current phylogenetic research. P. padus is classified as belonging to subgenus Padus, with approximately 20 species native to Asia, Europe, and North America (Chin et al. Citation2014). It has been reported that at least 16 species are native to China and 3 species, including P. serotina, are native to North America.
Prunus padus is also called as “Guryongmok”, and its dried small branches were used as medicine. The compendium of Medical Herbs (1596), compiled by Li Shizhen, showed that the bark, fruits, and leaves of P. padus had anti-inflammatory and antinociceptive effects. Therefore, it has been used as a traditional medicine (Choi et al. Citation2012). Recently, there have been many studies on extracting materials and proving functions both inside and outside Korea. The fruits of the plant are rich in antioxidant substances called anthocyanins (Kucharska and Oszmiański Citation2002). There have been reports on extraction of two cerebrosides and six phenolic compounds from barks in the country (Na et al. Citation2006). It was also reported that lipophilic extracts from leaves, inflorescences and fruits have an anti-inflammatory effect (Magiera et al. Citation2019). Bark extracts are also useful ingredients in cosmetics since they have antioxidant, antiwrinkle, and whitening effects (Hwang et al. Citation2014). In Europe, P. padus was evaluated to have excellent potential for healthy food materials, as well as, a great value as a medicinal resource (Donno et al. Citation2018).
A few Prunus species have been studied abroad, but there has been no reported study on the genetic diversity of P. padus both domestically and abroad. In the present study, we conducted AFLP analysis to investigate the genetic diversity, genetic differentiation, and genetic structure of P. padus.
Materials and ethods
Sample collection, DNA extraction, and AFLP analysis
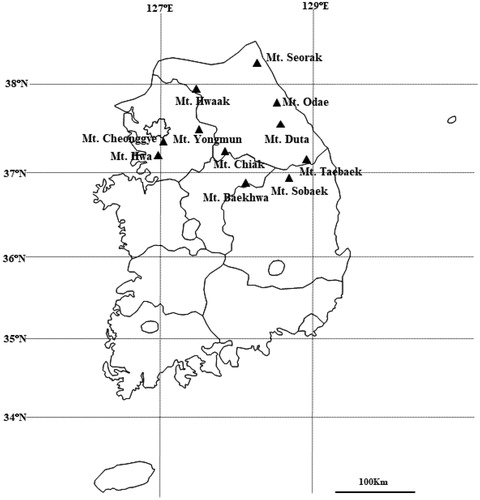
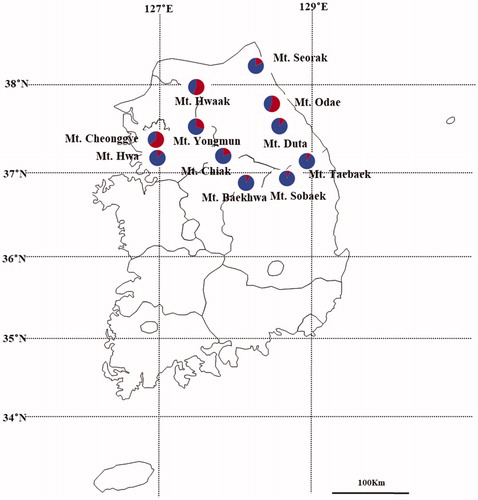
We collected data on the habitats of P. padus through a literature survey and searched all tree species for sampling. The sampled individuals within each population were separated from each other by at least 50 m to minimize collection of genetically similar samples. Except for populations that did not search for at least 20 samples, a total of 325 fresh leaf samples were collected from 11 populations (). The location information on individual trees was collected using GPS (Garmin, GPSmap 60CSx), and the heights and diameters at breast height (DBH) of each individual plant were recorded during sampling. All sampled leaves were ground using a FastPrep120 homogenizer (MPBIO, USA). Then, the total genomic DNA was extracted from each sample using GeneAll Plant SV Mini Kit (Seoul, South Korea) according to the manufacturer’s instructions. The total DNA concentration was measured using a NanoDrop 2000 spectrophotometer (Thermo Scientific, USA). AFLP analysis was carried out as described by Ahn et al. (Citation2019).
Figure 1. Location of eleven Prunus padus populations in South Korea for this study.
Data analysis
We estimated genetic diversity parameters such as number of effective alleles (Ae), percentage polymorphic loci (%P), Shannon diversity index (I), and estimated heterozygosity (He). The genetic differentiation among populations (ΦST) was determined by analysis of molecular variance (AMOVA). Pairwise values of Nei’s genetic distance among populations were calculated, and we performed principal coordinates analysis (PCA) using Nei’s genetic distance. We checked for significant correlations between pairwise values of Nei’s genetic distance and the logarithm of pairwise geographic distance using Mentel tests, which were predicted to have a linear relationship under a model of isolation by distance. All the above analyses were performed using GeneAlEx 6.41 (Peakall and Smouse Citation2006). AFLPsurv v1.0 software (Vekemans Citation2002) was used to estimate allele frequencies at AFLP loci and expected heterozygotes using a Bayesian approach. The f (analogous to FIS) and θII (analogous to FST) statistics were calculated using a Bayesian inference for different models using HICKORY v1.1 software (Holsinger et al. Citation2002). In addition, population-specific inbreeding coefficients (FIS) were estimated by an approximate Bayesian computation using the software ABC4 (Foll et al. Citation2008). The genetic relationships among populations were evaluated by generating an unweighted pair-group method using arithmetic average (UPGMA) tree using Phylip v3.695 software (Felsenstein Citation2013). We used the Bayesian clustering method to elucidate the genetic structure among populations using STRUCTURE v2.3 software (Pritchard et al. Citation2000). We assumed a pre-assigned number of genetic clusters (K) ranging from 1 to 11. The simulations were run 10 times for each value of K. All runs involved 20,000 Markov chain Monte Carlo (MCMC) sampling, after a burn-in period of 20,000 iterations. The optimum K values were evaluated by calculating ΔK. The values were calculated according to the method of Evanno et al. (Citation2005) using STRUCTURE HARVESTER program (Earl and vonHoldt Citation2012). Multiple runs for the optimum K value were aligned using CLUMPP v 1.1.2 (Jakobsson and Rosenberg Citation2007). Bar plots of the proportional memberships of the individuals were generated and visualized using DISTRUCT v1.1 software (Rosenberg Citation2004).
Results
Genetic diversity within a population
We observed a total of 184 polymorphic bands from seven endonuclease-primer combinations (). The mean numbers of effective alleles (Ae), percentage polymorphic loci (%P), Shannon diversity index (I), and estimated heterozygosity (He) were 1.38, 81.4%, 0.357, and 0.223, respectively (). The estimated heterozygosity (Hj) using a Bayesian method approach was 0.256. The highest level of genetic diversity was observed for the Mt. Seorak population (Ae = 1.53, I = 0.462, He = 0.308, Hj = 0.333). The Mt Cheonggye population had the lowest genetic diversity (Ae = 1.373, I = 0.351, He = 0.228, Hj = 0.257). The population-specific FIS obtained from an approximate Bayesian method (Foll et al. Citation2008) varied from 0.305 (Mt. Seorak) to 0.887 (Mt. Odae), with an average of 0.767.
Table 1. Number of AFLP amplified bands and polymorphic bands per primer-restriction enzyme combinations from Prunus padus populations.
Table 2. Genetic diversity parameters estimated from Prunus padus populations.
Genetic differentiation among populations
AMOVA analysis revealed genetic differentiation between the populations (). At the population level, 25% of the total molecular variation was attributed to inter-population differentiation, and 75% to individual differentiation within populations (ΦST = 0.245, p < 0.01). From Bayesian analysis (Holsinger et al. Citation2002), the smallest deviance information criterion (DIC = 8905.1) was obtained from the full model among the 4 different models, and the obtained f (analogous to FIS) was 0.963 and θII (analogous to FST) was 0.278, assuming the full model ().
Table 3. Distribution of genetic variations of Prunus padus populations from analysis of molecular variance (AMOVA).
Table 4. Inbreeding coefficient (f) and population differentiation (θII) of Prunus padus using different models based on Bayesian method.
Genetic relationships and enetic structure
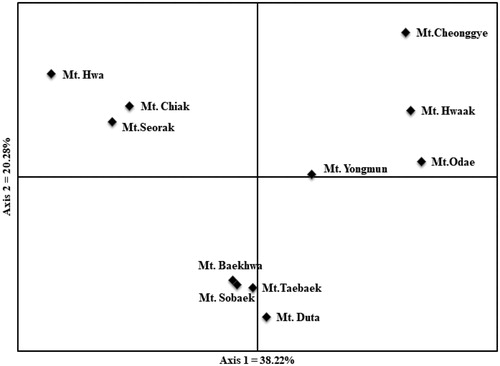
The genetic relationship was determined from UPGMA dendrogram based on Nei’s genetic distance (). Prunus padus populations in South Korea were divided into three groups. One genetic group was clustered with 5 populations (Mt. Sobaek, Mt. Taebaek, Mt. Baekhwa, Mt. Duta, and Mt. Yongmun) with minimum genetic distance between them. The second genetic group was clustered with 3 populations (Mt. Chiak, Mt. Seorak, and Mt. Hwa). Mt. Cheonggye, Mt. Hwaak, and Mt. Odae clustered into the third genetic group. We also present results in the form of a scatter diagram by principal component analysis (; Axis 1 = 38.22% and Axis 2 = 20.28%). Except for the Mt. Yongmun population, the cluster results were also supported by UPGMA analysis. Mt. Yongmun was scattered close to the genetic group containing Mt. Cheonggye, Mt. Hwaak and Mt. Odae. There was no significant correlation between the genetic distance and geographic distance based on Mentel test (r = 0.188, p = 0.08).
Figure 2. UPGMA dendrogram based on Nei's genetic distance of each Pruns padus population.
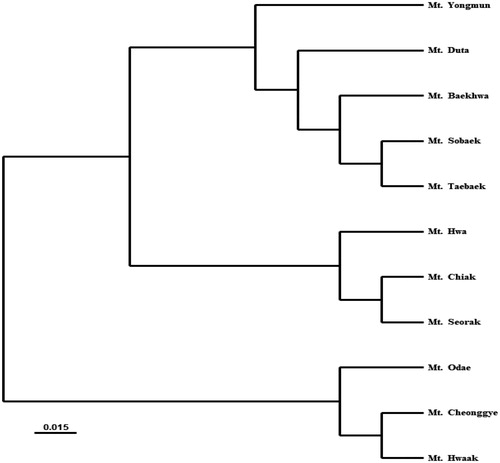
Figure 3. Principal components analysis (PCA) for Prunus padus populations. Axis 1 and axis 2 were explained 38.22 and 20.28% of genetic variation, respectively.
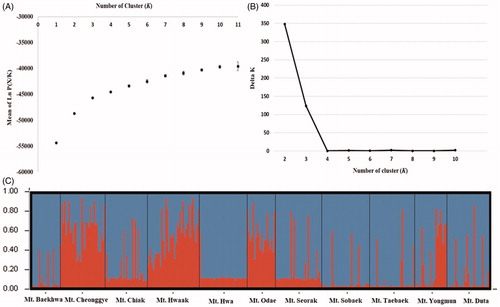
Using Bayesian clustering analysis, the mean value of Ln P(X/K) gradually increased with K=2 or greater by Pritchard et al (Citation2000) method (). The value of ΔK was the highest at K=2, based on the theory suggested by Evanno et al. (Citation2005) (). We visualized assignment probabilities from each population, in which all populations were classified into two genetic clusters (). Cluster I consisted of Mt. Cheonggye, Mt. Hwaak, and Mt. Odae. Cluster II contained other populations. Approximately 69% of the individuals in the Mt. Yongmun population belonged to cluster II and the other 31% belonged to cluster I.
Figure 4. Results of Bayesian clustering analysis. (A) The mean log-likelihood value (±standard deviation) of the data was ten repetitions for each K value. (B) The value of delta K (ΔK) was changed as each K value. (C) Assignment probabilities at the individual and population levels estimated using Bayesian clustering. Each individual is shown as a vertical line divided into segments representing the estimated membership proportion.
Discussion
Genetic diversity within a population
According to the AFLP metadata study, genetic diversity is influenced by the life history parameters of various species, such as, life span, frequency, mating system, and pollination vector (Reisch and Bernhardt-Römermann Citation2014). The level of genetic diversity in P. padus (He = 0.223, Hj = 0.256) was higher than that in perennial species (He = 0.160), common frequency species (He = 0.200), and insect-pollinated species (He = 0.190), which have similar life history traits to P. padus. However, the level of genetic diversity in P. padus (He = 0.223, Hj = 0.256) is lowest compared to Acer pseudosieboldianum (He = 0.231, Hj = 0.253; Ahn et al. Citation2016), Prunus mira (He = 0.374; Li et al. Citation2013) and Prunus lannesiana var. speciosa (He = 0.300, Kato et al. Citation2011). These species have similar life history traits and estimated genetic diversity based on AFLP markers. The estimated genetic diversity of P. padus is also lower than that of Carpinus laxiflora (He=0.241, Hj = 0.270; Ahn et al. Citation2019). This is consistent with the result that the level of genetic diversity in insect-pollinated species (He = 0.15) is lower than that of wind pollinated species (He = 0.19) based on the metadata study. Consequently, we conclude that the level of genetic diversity in P. padus is low compared to that in species with similar life history traits.
The inbreeding coefficient (FIS) estimated by an approximate Bayesian computation (Foll et al. Citation2008) is 0.767. Compared with the inbreeding coefficient of domestic deciduous broadleaf trees, this value was found to be relatively high. P. padus (FIS = 0.767) was smaller than that in Ulmus davidiana var. japonica (FIS = 0.822; Ahn et al. Citation2013) and larger than Phellodendron amurense (FIS = 0.628; Lee et al. Citation2014), Carpinus laxiflora (FIS = 0.618; Ahn et al. Citation2019), and Acer pseudosieboldianum (FIS = 0.712, Ahn et al. Citation2016). The estimated out-crossing rates in the genus Prunus varies within a range from 0.41 to 0.99 (Garcia et al. Citation2005; Cottrell et al. Citation2009). This indicated that Prunus species undergo place selfing, as well as out-crossing. Prunus padus is a plant which has both hermaphroditic flowers and is pollinated by insects. Hermaphroditic flower plants are known to have mixed mating and if insect visits fail, self-pollination will occur (Uusitalo Citation2004). On the other hand, Prunus genus species have self-incompatibility to minimize the effects of selfing (Potter Citation2013). Therefore, it is likely that there is predominantly outcrossing occurring in P. padus. Ulmus species, including U. davidiana, mainly undergo sexual reproduction, but sometimes they do undergo asexual reproduction to adapt to environmental changes (López-Almansa Citation2004). Prunus padus has also been reported to induce vegetative regeneration according to its environmental changes (Deiller et al. Citation2003). This research reported the regeneration strategies of native deciduous broadleaved tree species in the floodplains of forests which are upstream to rivers. Fraxinus excelsior, Carpinus betulus, and Acer pseudoplatanus produce many seeds and disperse seeds by wind. Seeds germinated abundantly from seedlings in the field, which is advantageous for seed reproduction. However, P. padus has developed vegetative propagation strategies to withstand prolonged inundation. Prunus avium is also insect-pollinated and reproduces sexually or asexually. In the mating system study, more than half of the pollen that contributes to mating originates from trees located within 100 m (Cottrell et al. Citation2009). If the pollen donor was maternal progeny by clonal propagation, they might be ramet in the clone group. It is possible that the highest kinship of pollen gametes are produced by individuals in the same clone group. Consequently, high outcrossing rate (tm=0.99) was estimated, but the effect of outcrossed mating might be reduced. In a study on the estimated genetic diversity of life stages (adult trees, seedlings, seeds) in P. avium stands, both seedling and seeds from sampling of ramet seed-trees showed a decrease in genetic diversity (Jolivet et al. Citation2013). They discussed that ramet-seed-trees or seed-trees surrounded by many clonal ramets might have affected the genetic composition of the offspring. In addition, it affects the quality of the seed material due to biparental inbreeding depression. Therefore, we consider the effect of asexual reproduction strategy on genetic diversity present in P. padus. The range of estimated inbreeding coefficient varies from 0.305 to 0.887 in our study. It will be necessary to carry out additional studies on clonality and mating systems.
Genetic differentiation among populations
Compared to the AFLP metadata study, which had similar life history trait species with P. padus (Reisch and Bernhardt-Römermann Citation2014), the level of genetic differentiation in P. padus (ΦST=0.245) was similar to that in perennial species (ΦST=0.270), common frequency species (ΦST=0.200), and insect-pollinated species (ΦST = 0.280). We compared the domestic deciduous broadleaved tree species and the genus Prunus. The level of genetic differentiation in P. padus (ΦST = 0.245) was intermediate compared to Acer pseudosieboldianum (ΦST = 0.107; Ahn et al. Citation2016), Phellodendron amurense (ΦST = 0.076; Lee et al. Citation2014), Stewartia koreana (ΦST = 0.118; Yang et al. Citation2006), P. lannesiana var. speciosa (ΦST = 0.150; Kato et al. Citation2011), P. mira (ΦST = 0.255; Li et al. Citation2014), Prunus sibirica (ΦST = 0.250; Li et al. Citation2013), and Prunus pseudocerasus (ΦST = 0.645; Li et al. Citation2009). A meta-analysis reported that the level of genetic differentiation in insect-pollinated species (ΦST = 0.280) is larger than that of wind-pollinated species (ΦST = 0.260). The level of genetic differentiation in P. padus (ΦST = 0.245) was larger than that in wind-pollinated Carpinus laxiflora (ΦST = 0.060; Ahn et al. Citation2019), Fraxinus chiisanesis (ΦST = 0.041; Cho et al. Citation2002), and U. davidiana (ΦST = 0.042; Ahn et al. Citation2013). We conclude that the level of genetic differentiation present in P. padus is large compared to that in species with similar life history traits.
The gene flow between populations is determined by pollen and seed dispersal. This significantly affects the distribution of genetic variability within species (Myking Citation2002). The magnitude of gene flow depends on the pollination vector and seed dispersal capability (Jordano and Godoy Citation2000). Prunus padus is insect-pollinated and undergoes seed dispersal by birds or mammals. The magnitude of gene flow in species by insect pollination and seed dispersal by animals is limited compared to that in species by wind pollination and seed dispersal by wind (García et al. Citation2005) as it is influenced by flowering time and animal behavior patterns. The flowering time of Prunus species is known to be short. If the insects that are pollen vectors cannot visit in time for the blooming, the efficiency of gene flow by pollen might be low. In studies on P. sibirica, seed dispersal depends on the migration habits and activity of animals. They discussed that it may confine their activities within the areas where ripe fruits are available. Therefore, animal behavior can be a limiting factor for seed migration. The study of P. pseudocerasus was focused on demographic factors. It was considered that the gene flow gradually decreased due to population fragmentation and geographical isolation. P. padus has a large genetic differentiation. It is thought to be influenced by various factors such as pollination vector, seed dispersal by animals, and population demographic factors.
Genetic relationships and enetic structure
The main distribution range of P. padus is known between latitude 65°−70° in the Northern Hemisphere (Uusitalo Citation2004). The distribution area in East Asia is limited to the central north of the Republic of Korea, the northeast of China, and Hokkaido, Japan. According to both molecular systematics and biogeography, P. padus originated from East Asia during the Middle Miocene and expanded to Europe (Chin et al. Citation2014). It was widespread in the Eurasia during the Pliocene. Through a molecular systematic diversification based on nuclear and plastid DNA studies, it was found that P. padus in the Republic of Korea has the same evolutionary lineage as native to China and Europe (Volkova et al. Citation2020). The population of this lineage survived from many periglacial microrefugia. Populations were expanded and declined during the glacial and interglacial periods. There was also admixing during the interglacial period. As a result, P. padus has a variety of genetic variations, such as cold-tolerance, and can adapt to various environments. Palynological analysis revealed that the last glacial and postglacial periods in the Korean Peninsula influenced the recent vegetation distribution (Lee et al. Citation2006). Prunus padus is a cold temperate deciduous broad-leaved species. The current distribution range is limited to the central north. Considering the main distribution range and the geographic studies and has expanded from the northern region in the glacial period and declined.
Prunus padus is divided into two genetic groups by combining the results of UPGMA, PCA, and Bayesian cluster analysis. Most populations showed a similar genetic structure. Most survey populations have expanded along the main mountain ranges, such as the Taebaek Mountain, Sobaek Mountain Range, and Chiak Mountain Range. However, Mt. Cheonggye, Mt. Hwaak, and Mt. Odae are divided into different genetic groups. There was no genetic structure according to geographic distribution ().
Figure 5. Geographic distribution pattern of two clusters estimated by using Bayesian clustering.
Prunus sibirica, native to northern China, is distributed in various environments from the lowlands to the high mountain (Wang et al. Citation2014). The genetic structures of populations located in the same mountain range were similar. However, some geographically close populations showed different genetic structures. It discussed that the human cultivation activities, genetic barriers between populations, and limited seed dispersion by the behavior of animals. Limited gene flow by genetic barriers between populations has affected the reduction of genetic diversity. Mt. Cheonggye, which has the lowest genetic diversity (He = 0.169), is located close to the city of Gyeonggi-do. Forests located near the city have weak seed fruiting, and soil acidification is severe due to acid rain (Ko and Shin Citation2009). In addition, there is greatly influenced by human disturbance, such as planting of exotic species Pinus rigida, harvesting forest products, and trampling effect. Unlike Mt. Hwa, which is also located in the city, it is relatively well preserved as a royal tomb forest, Mt. Cheonggye has low genetic diversity due to these factors. Mt. Odae also has the low genetic diversity (He = 0.199). It is dominated by Quercus mongolica, more than 80%, and the distribution area of P. padus was small (Han et al. Citation2014). Prunus padus is seed propagation, but it is also an asexual propagation strategy adapted to rapid environmental changes or forest succession. Therefore, it is asexually reproduced as a strategy in response to competition with other deciduous broad-leaved trees. Mt. Yongmun was observed that it is shared genetic variation of two genetic groups. The valley of Yongmun Temple, where survey P. padus, is observed succession from pine forest to deciduous broad-leaved forest dominated by Carpinus laxiflora and Carpinus cordata (Jang et al. Citation2013). However, vegetation management has been conducted to preserve the pine forests in the valley of the Yongmun Temple. Therefore, it is affected by forest succession and human disturbance.
Conclusions
In this study, AFLP markers were used to estimate the genetic diversity, genetic differentiation, and genetic structure of populations of P. padus in South Korea. There was low genetic variability in the species compared to other species of Prunus genus and those with similar life history traits. The value obtained for the inbreeding coefficient was smaller than that of Ulmus davidiana, which is sexually or asexually reproduced. However, it was larger than other species which undergo sexual reproduction, such as, Carpinus laxiflora, Phellodendron amurense, and Acer pseudosieboldianum. Therefore, the value is affected by inbreeding between clone individuals, which was asexually reproduced. The genetic differentiation among populations was larger than that of Prunus species and those with similar life history traits. Some populations were detected as weak genetic structures according to their geographical distribution. Genetic variation might be influenced by the fact that asexual propagation strategies need to adapt to local environmental changes, such as forest succession. It also might be affected from gene flow being gradually decreased due to population fragmentation by demographic disturbances. It is expected that information on the genetic diversity and genetic structure of P. padus will be useful in conservation, utilization, and breeding strategies.
Disclosure statement
No potential conflict of interest was reported by the author(s).
References
- Ahn JY, Hong KN, Lee JW, Yang BH. 2013. Population genetic variation of Ulmus davidiana var. japonica in South Korea based on ISSR markers. J Korean Forest Soc. 102(4):560–565.
- Ahn JY, Hong KN, Baek SH, Lee MW, Lim HY, Lee JW. 2016. Genetic diversity and genetic structure of Acer pseudosieboldianum populations in South Korea based on AFLP markers. J Korean For Soc. 105(04):414–421.
- Ahn JY, Lee JW, Lee MW, Hong KN. 2019. Genetic diversity and structure of Carpinus laxiflora populations in South Korea based on AFLP markers. J Forest Sci Technol. 15(4):192–201.
- Baliuckas V, Lagerström T, Norell L, Eriksson G. 2015. Genetic variation among and within populations in Swedish species of Sorbus aucuparia L. and Prunus padus L. assessed in Nursery Trial. Silvae Genet. 54(1–6):1–8.
- Chin S-W, Shaw J, Haberle R, Wen J, Potter D. 2014. Diversification of almonds, peaches, plums and cherries – molecular systematics and biogeographic history of Prunus (Rosaceae). Mol Phylogenet Evol. 76:34–48.
- Cho KJ, Jeong JM, Kim YY, Kim YM, Hong YP. 2002. Genetic diversity in the natural populations of Korean endermic tree species, Fraxinus chiisanensis Nakai (Oleaceae). Proceedings of Korean Forest Society; p. 99–101.
- Choi JH, Cha DS, Jeon H. 2012. Anti-inflammatory and anti-nociceptive properties of Prunus padus. J Ethnopharmacol. 144(2):379–386.
- Cottrell JE, Vaughan SP, Connolly T, Sing L, Moodley DJ, Russell K. 2009. Contemporary pollen flow, characterization of the maternal ecological neighbourhood and mating patterns in wild cherry (Prunus avium L.). Heredity (Edinb). 103(2):118–128.
- Deiller AF, Walter JMN, Trémolières M. 2003. Regeneration strategies in a temperate hardwood floodplain forest of the Upper Rhine: sexual versus vegetative reproduction of woody species. For Ecol Manage. 180(1–3):215–225.
- Donno D, Mellano MG, Biaggi MD, Riondato I, Rakotoniaina EN, Beccaro GL. 2018. New findings in Prunus padus L. fruits as a source of natural compounds: characterization of metabolite profiles and preliminary evaluation of antioxidant activity. Molecules. 23(4):718–725.
- Earl DA, vonHoldt BM. 2012. STRUCTURE HARVESTER: a website and program for visualizing STRUCTURE output and implementing the Evanno method. Conservation Genet Resour. 4(2):359–361.
- Evanno G, Regnaut S, Goudet J. 2005. Detecting the number of clusters of individuals using the software STRUCTURE: a simulation study. Mol Ecol. 14(8):2611–2620.
- Felsenstein J. 2013. PHYLIP (Phylogeny Inference Package) v3.695. Seattle, USA: Department of Genome Sciences and Department of Biology University of Washington.
- Foll M, Beaumont MA, Gaggiotti O. 2008. An Approximate Bayesian Computation approach to overcome biases that arise when using amplified fragment length polymorphism markers to study population structure. Genet. 179(2):927–939.
- García C, Arroy JM, Godoy JA, Jordano P. 2005. Mating patterns, pollen dispersal, and the ecological maternal neighborhood in a Prunus mahaleb L. population. Mol Ecol. (6)14:1821–1840.
- Han BH, Lee KJ, Choi JW, Yeom JH. 2014. Characteristics of vegetation distribution according to the growth environment of Odaesan (Mt.) National Park. Proc Korean Soc Environ Ecol. 24(1):21–22.
- Holsinger KE, Lewis PO, Dey DK. 2002. A Bayesian approach to inferring population structure from dominant markers. Mol Ecol. 11(7):1157–1164.
- Hwang D, Kim H, Shin H, Jeong H, Kim J, Kim D. 2014. Cosmetic effects of Prunus padus bark extract. Korean J Chem Eng. 31(12):2280–2285.
- Jakobsson M, Rosenberg NA. 2007. CLUMPP: a cluster matching and permutation program for dealing with label switching and multimodality in analysis of population structure. Bioinformatics. 23(14):1801–1806.
- Jang GS, Son DC, Lee DH, Choi K, Oh SH. 2017. Checklist of vascular plants in Korea. Pocheon: Korea National Arboretum; p. 243.
- Jang JH, Han BH, Choi TY, Lee KJ. 2013. Plant community structure and change of Pinus densiflora S. et Z. forest for twentytwo years (1988∼2010) in Yongmun sa (Temple) vally, Yangpyeong gun, South Korea. Korean J Environ Ecol. 27(3):369–380.
- Jolivet C, Rogge M, Degen B. 2013. Molecular and quantitative signatures of biparental inbreeding depression in the self-incompatible tree species Prunus avium. Heredity (Edinb). 110(5):439–448.
- Jordano P, Godoy JA. 2000. RAPD variation and population genetic structure in Prunus mahaleb (Rosaceae), an animal-dispersed tree. Mol Ecol. 9(9):1293–1305.
- Jung YH, Ko MH, Oh YS, Kim GO, Chung YC, Kim MH, Oh MY. 1997. Phylogenetic relationship among selected Taxa of Prunus in Mt. Halla and cultivated Prunus yedoensis by the RAPD analysis. Korean J Pl Taxon. 27(4):415–428.
- Kalkman C. 1965. The old world species of Prunus subg. Laurocerasus including those formerly referred to Pygeum. BLUMEA. XIII(I):20.
- Kato S, Iwata H, Tsumura Y, Mukai Y. 2011. Genetic structure of island populations of Prunus lannesiana var. speciosa revealed by chloroplast DNA, AFLP and nuclear SSR loci analyses. J Plant Res. 124(1):11–23.
- Korea Biodiversity Information System. 2020. [accessed 2020 March 10]. http://www.nature.go.kr.
- Ko SC, Shin YH. 2009. Flora of middle part in Gyeonggi Province. Korean J Plant Res. 22(1):49–70.
- Kumar A, Misra P, Dube A. 2013. Amplified fragment length polymorphism: an adept technique for genome mapping, genetic differentiation, and intraspecific variation in protozoan parasites. Parasitol Res. 112(2):457–466.
- Kucharska AZ, Oszmiański J. 2002. Anthocyanins in fruits of Prunus padus (bird cherry). J Sci Food Agric. (13)82:1483–1486.
- Lee SH, Kim JY, Oh KC, Yang DY, Ryu EY, Oh KJ. 2006. Late Pleistocene paleoenvironments of the Poonggi-dong area, Asan, inferred from pollen analysis. J Geo Soc Korea. 42(1):57–68.
- Lee JW, Hong KN, Kang JT. 2014. Genetic diversity and genetic structure of Phellodendron amurense populations in South Korea. J Korean Forest Soc. 103(1):51–58.
- Li M, Zhao Z, Miao X, Zhou J. 2013. Genetic diversity and population structure of Siberian apricot (Prunus sibirica L.) in China. Int J Mol Sci. 15(1):377–400.
- Li MM, Cai YL, Qian ZQ, Zhao GF. 2009. Genetic diversity and differentiation in Chinese sour cherry Prunus pseudocerasus Lindl., and its implications for conservation. Genet Resour Crop Evol. 56(4):455–464.
- Li T, Liu J, Xie Y, Wang Q, Meng F. 2014. Analysis of genetic diversity in Prunus mira Koehne ex Sargent populations using AFLP markers. Plant Syst Evol. 300(3):475–482.
- Liu XL, Wen J, Nie ZL, Johnson G, Liang ZS, Chang ZY. 2013. Polyphyly of the Padus group of Prunus (Rosaceae) and the evolution of biogeographic disjunctions between eastern Asia and eastern North America. J Plant Res. 126(3):351–361.
- López-Almansa JC. 2004. Review. Reproductive ecology of riparian elms. Sist Recur For. 13(1):17–27.
- Lynch M, Milligan B. 1994. Analysis of population genetic structure with RAPD markers. Mol Ecol. 3(2):91–99.
- Magiera A, Marchelak A, Michel P, Owczarek A, Olszewska MA. 2019. Lipophilic extracts from leaves, inflorescences and fruits of Prunus padus L. as potential sources of corosolic, ursolic and oleanolic acids with anti-inflammatory activity. Nat Prod Res. DOI:10.1080/14786419.2019.1666385.
- Mba C, Tohme J. 2005. Use of AFLP markers in surveys of plant diversity. Meth Enzymol. 395:177–201.
- Myking T. 2002. Evaluating genetic resources of forest trees by means of life history traits – a Norwegian example. Biodivers Conserv. 11(9):1681–1696.
- Na DS, Yang MC, Lee KH, Lee KR. 2006. Cerebrosides and phenolic constituents of Prunus padus L. Korean J Pharmacogn. 37(3):125–129.
- Peakall R, Smouse PE. 2006. GENEALEX 6: genetic analysis in Excel. population genetic software for teaching and research. Mol Ecol Notes. 6(1):288–295.
- Potter D. 2013. Prunus. wild Crop relatives: genomic and breeding resources. Berlin Heidelberg: Springer-Verlag; p. 129–145.
- Pritchard JK, Stephens M, Donnelly P. 2000. Inference of population structure using multilocus genotype data. Genet. 155:945–959.
- Rehder A. 1940. A manual of cultivated trees and shrubs hardy in North America exclusive of the subtropical temperate region. 2nd ed. New York: Macmillan; 451–478.
- Reisch C, Bernhardt-Römermann M. 2014. The impact of study design and life history traits on genetic variation of plants determined with AFLPs. Plant Ecol. 215(12):1493–1511.
- Rosenberg NA. 2004. Distruct: a program for the graphical display of population structure. Mol Ecol Notes. 4(1):137–138.
- Simon J, Blanché C. 2016. Karyological knowledge of the Catalan vascular flora inferred from “CromoCat” database; [accessed 2020 July 2]. http://biodiver.bio.ub.es/biocat/index.jsp#pas4.
- Tournefort JP. 1700. Institutiones rei herbariae. Parisiis: E Typographia Regia; 622–623.
- Uusitalo M. 2004. European bird cherry (Prunus padus L.) – a biodiverse wild plant for horticulture. Finland: MTT Agrifood Research Finland; p. 82.
- Vekemans X. 2002. AFLP-SURV 1.0: A program for genetic diversity analysis with AFLP (and RAPD) population data. Laboratoire de Génétique et d’Ecologie Végétales, Université Libre de Bruxelles. [accessed 2019 Dec 23]. http://www.ulb.ac.be/sciences/lagev/aflp-survhtml.
- Volkova PA, Burlakov YA, Schanzer IA. 2020. Genetic variability of Prunus padus (Rosaceae) elaborates “a new Eurasian phylogeographical paradigm. Plant Syst Evol. (1)306:1–9.
- Wang Z, Kang M, Liu H, Gao J, Zhang Z, Li Y, Wu R, Pang X. 2014. High-level genetic diversity and complex population structure of Siberian apricot (Prunus sibirica L.) in China as revealed by nuclear SSR markers. PLoS One. 9(2):e87381.
- Yang BH, Han SD, Koo YB, Park YG. 2006. Genetic variation in the natural populations Korean stewartia (Stewartia koreana Nakai) based on I-SSR analysis. Korean J Plant Resour. 19(1):189–195.
- Zhivotovsky LA. 1999. Estimating population structure in diploids with multilocus dominant DNA markers. Mol Ecol. 8(6):907–913.