
Abstract
Dalbergia cochinchinensisis a valuable tree species with good quality and unique timber color. The species is threatened to be extinct due to the over-exploration and climate changes of the natural habitats. We investigated the responses of this species to drought stress by measuring physiological parameters and using an infrared thermal imaging system. Physiological parameters are chlorophyll contents, transpiration rate (E), stomatal conductance (gs), net photosynthetic rate (A), water use efficiency (WUE), and chlorophyll fluorescence during the drought stress. Leave’s temperatures were measured by the infrared thermal imaging camera. Most photosynthetic parameters were decreased after drought except WUE. Under drought stress, E, gs, A, and chlorophyll content were decreased, whereas WUE was increased. The seedlings’ chlorophyll fluorescence (Fv/Fm) had declined significantly in all drought stress conditions. The temperature of the upper leaves increased more than the middle and the bottom leaves in all stress groups. Stress responses were detected by physiological parameters and thermal images representing the leaf temperature. While there were wide variations in the physiological parameters, thermal imaging could measure the broad range of plants and have less variation among the treatments. The combinations of physiological parameters and thermal images are more reliable in detecting water stress. Furthermore, it can be effectively used to determine plant water needs, which can be used in precision irrigation systems.
Introduction
The frequency and severity of drought are expected to increase shortly due to the decrease in regional precipitation and the increase in evapotranspiration driven by global warming (Sheffield and Wood Citation2008; Dai Citation2011; Sheffield et al. Citation2012; Stott Citation2016). As a result, natural droughts are expected to rise quicker, become more intense, and last longer (Trenberth et al. Citation2014; Zandalinas et al. Citation2021). Tropical species may be particularly vulnerable to future warming as they are already living closer to their absolute thermal limits, have narrower thermal niche breadth, and may be limited in their ability to acclimate to warmer temperatures (Deutsch et al. Citation2008; Doughty and Goulden Citation2008; Cheesman and Winter Citation2013; O'Sullivan et al. Citation2017). Within the tropic, water availability is the most important environmental factor determining tree species richness (Gentry Citation1988; Poorter et al. Citation2004; Ter Steege et al. Citation2006), composition (Hall and Swaine Citation1976; Bongers et al. Citation2004), and distribution (Swaine Citation1996; Bongers et al. Citation1999; Holmgren and Poorter Citation2007). In addition, exposure to extreme climatic events will increase cellular stress and damage, which in turn will decrease photosynthesis and growth and could ultimately result in the mortality of individuals (Niu et al. Citation2014; Teskey et al. Citation2015).
Seedlings are especially prone to dry season stress as young plants have had little time to develop extensive root systems (Condit et al. Citation1995; Poorter and Hayashida-Oliver Citation2000; Werden et al. Citation2022). Drought limits the potential range of many species by affecting plants’ seedling survival, growth, and development potential. They showed significant effects at the initial stages of plant growth (e.g. during the first year of cultivation) (Kozlowski Citation1997; Dünisch et al. Citation2003) and endangered plant survival. The effects of water stress by drought have been reported for many angiosperms and gymnosperms, resulting in considerable changes in plant physiology, morphology, and overall biochemical processes (Cernusak et al. Citation2007; Chaves et al. Citation2008; Cordeiro et al. Citation2009; Ditmarová et al. Citation2010; Yang and Miao Citation2010; Li et al. Citation2011; Xioling et al. Citation2011). Water stress is a major growth-limiting factor highlighting the need for selecting drought-resistant species for successful plantations (Ky-Dembele et al. Citation2010). However, little is known about species variations in adaptability to drought stresses in tropical forest trees. Some tropical tree species could satisfactorily tolerate or postpone droughts, such as Swietenia macrophylla (Cordeiro et al. Citation2009), Garcinia kola, and Garcinia afzelii (Peprah et al. Citation2009).
D. cochinchinensis is a tree of tropical lowland forests, listed as 'Vulnerable’ in the IUCN Red List of Threatened Species. It is a rather slow-growing evergreen tree, found sparsely in open and semi-deciduous forests of Cambodia (Fern Citation2014). This species has much potential and has recently become one of the most expensive woods in the world. However, it was threatened by overexploitation and illegal logging for its timber (Moritsuka et al. Citation2017). Due to the increase in the loss of this native species, restoration efforts are needed to solve the problem. Evaluating their suitability for re-vegetation programs is scarce. Knowledge of the eco-physiological responses of native species to drought stress is needed for the success of the forest restoration program.
Comprehensive knowledge about species’ responses to drought can become a reference in developing forest tree species transfer guidelines (Wang et al. Citation1998), selecting adaptive species, and a key adaptation strategy for climate change (Millar et al. Citation2007). Furthermore, the seedling stage of a forest tree is known to be the most vulnerable phase in its life cycle. Therefore, understanding the stress responses of seedlings is crucial for predicting forest tree growth and survival (Niinemets Citation2010; Pšidová et al. Citation2015). This research aimed to study the physiological changes in seedlings of D. cochinchinensis to drought duration applied. In addition, we used a nondestructive device to combine the typical physiological parameters to detect drought stress.
Material and method
Plant material and growth condition
Nine months old of 20 seedlings of D. cochinchinensis with an average height 47.8 cm and root collar diameter (RCD) 5.8 mm were grown in a plastic pot containing mixing sand and garden soil. Physiological measurements were performed to evaluate the response of these seedlings under different drought stress treatments. The experiment was carried out in a completely randomized design with five replicates per treatment in the greenhouse. The experiment was conducted for about two weeks, from 23rd October to 05th November 2019. All seedlings were kept in the 4-Tier mini-greenhouse (27″ Long × 18″ Wide × 63″ High) with a temperature 19 ± 3 °C at day time and 10 ± 2 °C at night time with a relative humidity of approximately 70–80% at day time and 84–97% at night time.
Drought stress treatment
Seedlings were divided into 4 sub-groups. The first sub-group (D5) was subjected to stop watering for 5 days. The second sub-group (D8) was subjected to stop watering 8 days. The third sub-group (D11) was subjected to stop watering for 11 days. The last sub-group (D14) was subjected to stop watering for 14 days. To maintain the same condition of the soil volumetric water content in a pot, before applying the drought stress, all seedling pots were weighed and watered with the same amount of water 300 ml, for four days. All groups stop watering on the same day. Temperature, related humidity in the chamber, and soil moisture of the pot were recorded every day by the HOBO Microstation device. The soil moisture sensor was inserted 2/3 of the way down into the soil. All measurements were carried out 14 days during treatment application. In addition, treatment and growth conditions are summarized in . The daily change of soil moisture of seedlings in different drought stress periods is shown in .
Figure 1. The daily change of soil moisture of seedlings in different drought stress periods.
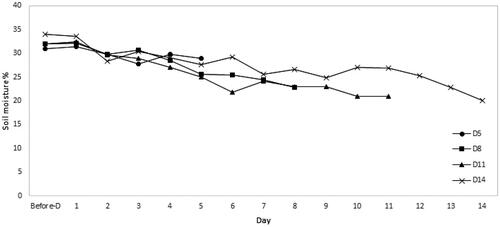
Table 1. Summary of treatment and growth condition of D. cochinchinensis seedlings.
Measurement of physiological and morphological characteristics
We measured the physiological characteristics such as chlorophyll fluorescence, chlorophyll content, and leaf gas exchange. The measurements were carried out at the mid-day between 10:00 a.m. and 3:00 p.m. (). Furthermore, the visual observation of the survival and wilting point of seedlings under drought stress was carried out during the experiment. The mean leaf temperature of stress was also estimated based on the thermal image records. Finally, the effect of the drought treatment was assessed every morning by assigning each seedling to visual wilting stages (Engelbrecht and Kursar Citation2003) based on easily observable characteristics, such as the leaf angle and necrosis.
Chlorophyll fluorescence
The investigation study was measured with fully expanded leaves. The measurements were done on mostly large green leaves. For instance, two random leaves (at the second or third pair from the top) of each seedling (5 seedlings per treatment) were selected for measurement. Fluorescence after 20 min dark-adapted to allow relaxation of fluorescence quenching associated with thylakoid membrane energization (Jung et al. Citation1998) quantum efficiency of open PSII reaction center [(Fm-Fo)/Fm or Fv/Fm] was measured. The Fv/Fm ratio parameter was determined following the procedures of Maxwell and Johnson (Citation2000), and used to quantify the degree of drought-induced photo-inhibition. Leaf samples were measured with FluorPen 100 MAX-LM.
Chlorophyll content
During the experiment, chlorophyll content (SPAD index) was nondestructively determined in the leaves selected for chlorophyll fluorescence measurement. The chlorophyll index was measured with the Chlorophyll Meter SPAD-502 (Minolta, Co., Spectrum Technologies, Inc., Japan). SPAD was read on each expanded leaf three times and averaged, then used for statistical analysis.
Leaf gas exchange
Gas exchange characteristics measurements of Net photosynthetic rate (A), Transpiration rate (E), and stomatal conductance (gs) were made from 10:00 to 3:00 on the same set of leaves used for the above measurement by using SC-1 Leaf Porometer device and ADC BioScientific LCpro+ gas analyzer device under the following conditions: 1500 μmol m−2 s−1 saturating light intensity, ambient CO2 concentration, 25 ± 1 °C leaf temperature, and 1012 mBar atmospheric pressure. The photosynthetic water use efficiency (WUE) was calculated as the ratio A/E.
Leaf temperature using thermal image
Leaf temperature and infrared thermal images were taken midday using an infrared camera Optris PI 160i, with a 160 × 120 pixels resolution. Leaf temperature and infrared thermal images were taken automatically every 20 s. The imaging camera was installed at a distance of 1.2 m from the plants. The camera measures temperature in the range of −20 °C to 900 °C (−4 °F to 1652 °F). The thermal sensitivity of the camera is 40 mK with a spatial range of 7.5 to 13 µm. Each pixel was considered an effective temperature in degree Celsius (°C). One thermal image from the leaf was taken from each treatment. Similar visible images were obtained with a normal camera, and thermal images were registered to differentiate between the leaf and the background by excluding the background and pot. While processing thermal photographs, the background pixels were eliminated by setting the highest and the lowest temperatures within the plant pixels in the thermal histogram. Finally, the plant pixels were averaged to obtain the leaf temperature (Jones et al. Citation2002; Fuentes et al. Citation2012).
Statistical analysis
Data were computed using MS Excel and International Rice Research Institute (IRRI, 2014) and analyzed using SPSS (IBM, ver 24). The statistically significant difference between before and after applied drought stress duration was determined by paired t-test at p < 0.05.
Results
Visual characteristics of wilting stage and mortality of seedlings under drought stress
The effects of the drought were visible within 3 days when all groups of individuals were slightly wilted, and few leaves started changing color: leaf angle changes, but no folding. On the 7 to 9 days, some leaves fall off. However, at the end of the experiment days 5, 8, 11, and 14 (indicated 5D, 8D, 11D, and 14D), seedlings in all groups neither severely wilted nor died.
Chlorophyll fluorescence
All rapid fluorescence induction kinetics exhibited a typical polyphasic OJIP curve, where O was the original fluorescence (initial fluorescence, Fo), and J and I sites were intermediate transients. P was the peak (maximal fluorescence, Fm). As a result, shows Fo in D5, D11, and D14 increased after the drought stress, but a decrease was observed in D8. The Fm in D8 and D14 was decreased after drought stress, while D5 and D11 were increased. The maximal efficiency of PSII (Fv/Fm) was decreased in all drought conditions, and significantly differed were observed before and after the drought.
Table 2. Mean different and standard deviation of minimum fluoresence (Fo), maximum fluoresence (Fm) and maximal PS II photochemical efficiency (Fv/Fm) before and after different drought stress period compared by paired t-test.
Interestingly, the value of Fv/Fm decreased similarly during the drought stress period. In this experiment, differences in Fv/Fm were not observed between the group. However, a significantly lower value was observed on day 1 in all groups. Fv/Fm value was stable on day 4 of the experiment in groups D5, D11, and D14, except for D8. Otherwise, seedlings in group stress D8, after which it sharply decreased on day 8, due to Fv/Fm value dropping by (0.651) from their initial values.
Chlorophyll contents
Estimated leaf chlorophyll content (SPAD index) declined progressively after drought exposure in all seedlings groups, as shown in (). There were significantly different between before and after drought stress was observed in drought stress groups D8 and D14. However, groups D5 and D11 did not significantly differ. Regarding the daily change of chlorophyll content among the drought stress groups, D11 retained high chlorophyll content compared to other drought stress groups, such as D5, D8, and D14. Observed throughout the days of drought, seedlings in group D11 started with the maximum chlorophyll content value (33.68) the day before stress. They were lower to (30.96) on day 10, followed by (30.01) on day 11. Chlorophyll content changed in the group stress D5, varying from value (31.84) on the day before drought followed by lower to (28.29) on day 3 and (27.77) on day 5. In group D8, the average value of chlorophyll content on the day before drought (35.92) significantly decreased to (31.09) on day 4 and (29.51) on day 8. The maximum average chlorophyll content value of D14 on the day before drought (33.40) significantly reduced to (28.59) on day 7 followed by (27.31) on day 14.
Table 3. Mean different and standard deviation of Chlorophyll content of seedlings before and after different drought stress period compared by paired t-test.
Leaf gas exchange
Some characteristic photosynthetic parameters, such as transpiration rate (E), stomatal conductance (gs), and photosynthetic rate (A), were reduced under drought stress. Of the variables monitored in our study, D14 showed the lowest value in E, gs, and A than other groups D5, D8, and D11. On the other hand, water use efficiency (WUE) increased in all drought stress periods (). Except for A, there were no statistically significant differences in some gas exchange parameters, such as E, WUE, and gs. In contrast, seedlings in group D14 showed no significant difference in E. However, the seedlings in groups D8 and D11 found all gas exchange variables in all parameters after drought duration was applied. Diurnal changing of leaf gas exchange parameters indicated that facing drought depended on the origin of the seedlings and varied during the experiment.
Table 4. Mean different and standard deviation of Transpiration rate (E), Stomatal conductance (gs), Net photosynthetic rate (A) and Water use efficiency (WUE) before and after different drought stress period compared by paired t-test.
The transpiration rate (E) decreased to the lower value (0.56 mmol m−2 s−1) was observed in D11 on (day 8), whereas D8 was decreased to (0.61 mmol m−2 s−1) on day 1 followed by (0.60 mmol m−2 s−1) at day 6. Group D5, E sharply decreased to (1.74 mmol m−2 s−1) from the initial value on day 2, while significantly increased to (2.89 mmol m−2 s−1) on day 3 and dropped down till day 5. Slightly changed from the day before drought with rang (1.23 mmol m−2 s−1) to day 4 (1.16 mmol m−2 s−1) of seedlings in group D14 and significantly increased up to (1.73 mmol m−2 s−1) at day 7, then decreased during the period from day 8 to 14.
The stomatal conductance (gs) from seedlings in group D11 showed an increase to the highest value (450.65 mmol m−2 s−1) on day 1 and started to decrease from (209.80 mmol m−2 s−1) on day 3 to (109.94 mmol m−2 s−1) at day 11. Seedlings from group D14 showed the lowest gs value (90.37 mmol m−2 s−1) on day 3 followed by (57.17 mmol m−2 s−1) on day 8, and a smaller change from day 9 to 14. In group D5, gs were kept stable from the day before the drought till day 3 and significantly decreased on day 4. By days 3 and 6, gs of seedlings in group D8 increased to (351.88 mmol m−2 s−1) followed by (319.15 mmol m−2 s−1), where the sharply decreased value is at day 5.
The relative photosynthetic rate (A) of seedlings in group D11 had the highest value (4.12 µmol m−2 s−1) on day 6 than other treatments and declined to the lowest value (0.94 µmol m−2 s−1) on day 8. Seedlings group D14 significantly dropped to the lowest value (0.45 µmol m-2 s-1) at the imposed stress period day 3 compared to the other groups, while increased on day 6, and the smaller change was observed during the drought period from day 7 to 14. On the other hand, group D5 decreased on day 1 and recovered from day 3 to 4. By days 1 and 8, the curve of seedlings from group D8 significantly decreased to (1.32 µmol m−2 s−1) followed by (1.34 µmol m−2 s−1) throughout the experiment, while there were no significant differences during the stress period from day 2 to 5.
Drought caused a considerable increase in water use efficiency (WUE), and a higher value was observed in D11 compared to other treatments. The significantly increased WUE in D11 (2.68 µmol mol−1 m−2 s−1) on day 1 followed by (3.52 µmol mol−1 m−2 s−1) on day 6 and declined on day 8, whereas The WUE was stabled up from day 9 to 11. Otherwise, the decrease to the lowest value of WUE (0.91 µmol mol−1 m−2 s−1) was observed from the seedlings in group D14 on day 3, while group stress D5 and D8 similarly changed the curve.
Leaf temperature
The leaf temperature was measured at three plant positions: upper, middle, and bottom leaves, and the summary result is shown in . Until the end of the drought, the period applied on day 5, 8, 11, and 14 seedlings seem not to be much different in visible. Still, the comparison of the mean values showed that after the drought, seedlings were increased leaf temperature than before the drought (∼ 4–5 °C). There were significantly different between before and after drought stress in all the leaf positions in stress groups D5, D8, and D14. No differences were observed in D11, even though the temperature increased after the drought. Leaf temperature at the upper leaves of all stress groups increased higher than in the middle and bottom leaves. A comparison of the mean values of the leaf temperature showed that seedlings in group D8 increased the highest temperature after drought in the upper leaves (31.14 °C) followed by (29.53 °C) in the middle leaves and (28.26 °C) compared to other groups treated D5, D11, and D14.
Table 5. Mean different and standard deviation of leaf temperature of seedlings before and after drought stress at different period compared by paired t-test.
The result of daily changing of leaf temperature in all leaf positions showed that the trend was similar in group stress D5, D11, and D14. On the contrary, increased leaf temperature after drought stress was observed in group D8. The leaf temperature of group D8 showed a significantly increased from day 1 to day 3 (23.38–33.80 °C) in upper leaves, followed by (23.33–31.43 °C) in middle leaves, and (23.32–30.10 °C) in the bottom leaves. The temperatures sharply dropped from the upper leaves (23.23 °C) to the middle leaves (23.06 °C), and the bottom leaves (23.08 °C) on day 4. The differences became greater from day 5 to 8 by (32.89–37.32 °C) in the upper leaves, followed by (28.99–34.83 °C) in the middle leaves and (26.51–33.98 °C) in the bottom leaves.
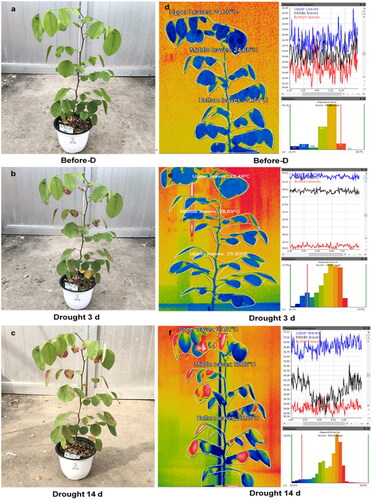
The common visible appearance and thermal image of D. cochinchinensis seedlings over the drought stress period applied on day 14 are shown in . The distribution of visible and thermal images of the other drought stress period was reported in Electronic Supplementary Material (Supplemental Figure S2, S3). The evident difference between the temperature reflectance of the soil and plants can be seen in the thermal images. Although seedlings could be easily segmented from the background soil in thermal images using a simple threshold on images, no segmentation was carried out to verify this method’s robustness to the field’s normal condition. The thermal imaging showed the changing temperatures before and after the drought 3 days and 14 days. The comparison between the graph’s leaf positions indicated that the highest temperature was observed in the upper leaves and the low temperature in the bottom leaves. Three distinct stages of the seedling’s response were recognized:
Stage 1: The day before drought stress, the visual image showed no change in the leaves’ color (leaves stay green) parallel to the thermal image, showing in dark-blue color without red spot color on leaves.
Stage 2: On day 3 of the drought, some leaves changed to dry, and the color went to yellow and brown, whereas the color in the thermal image became light blue/yellow due to the temperature in the leaves increasing.
Stage 3: The changes in leaf temperature and angle over the 14-day stress experiment are presented as significantly increased with higher than normal leaf temperature, particularly in the upper leaves. On the other hand, the increasing temperature leaves showed clearly the hot spot with the red color on the leaves due to the apparent visual difference.
Figure 2. Visual and thermal image of D. cochinchinensis seedlings over the drought period 14 days. (a), (b) (c) visual image and (d), (e), (f) Thermal image at day before drought, drought at day 3 and drought at day 14.
Discussion
Wilting under drought stress is a commonly observed phenomenon and probably the most widely used indicator of plant drought stress. This visual cue is used in agriculture and gardening and has also been used to assess plant drought resistance in ecological studies (Bannister Citation1986; Garg et al. Citation2020). Leaf angle changes and other visual signs of drought stress became progressively more pronounced with advancing drought conditions. During the first few days, plants remained visibly unaffected, but 3–4 days after the drought showed signs of wilting. Eventually, at the end of the experiment of drought duration, seedlings showed neither strongly wilted nor died. However, species with early leaf wilting are not always the first to succumb to drought when multiple species are evaluated since the responses to water stress vary among species (McDowell et al. Citation2008).
Chlorophyll fluorescence analysis is a popular technique to detect physiological conditions and investigate the mechanism of photosynthesis (Maxwell and Johnson Citation2000; Liu et al. Citation2015; Lee et al. Citation2021). When plants suffer from drought stress, the Fv/Fm of the leaves in the plants declines (Woo et al. Citation2008; Banks Citation2018; Liu et al. Citation2019). Drought stress significantly reduced Fv/Fm in this experiment between before and after drought treatment. This result indicates that the original light energy conversion efficiency was reduced, and the potential of active centers was damaged, suppressing the primary photosynthetic reaction of D. cochinchinensis seedlings.
The SPAD index was used preferentially because the strong relationship between readings of portable chlorophyll meter and leaf chlorophyll content has been demonstrated by several authors (Yadava Citation1986; Marquard and Tipton Citation1987; Markwell et al. Citation1995; Zhu et al. Citation2020). Chlorophyll degradation is one of the consequences of drought stress that may result from sustained photoinhibition and photo-bleaching (Long et al. Citation1994), even though other plant processes, such as cell division and cell expansion, are the earliest to respond to water deficit stress (Dale Citation1988). Similar to our findings, many other studies have shown that plants had reduced chlorophyll contents under drought stress (Cui et al. Citation2004; Pagter et al. Citation2005; Lei et al. Citation2006; Zhu et al. Citation2020). The decrease may be due to chlorophyll’s slow synthesis or fast breakdown (Mihailović et al. Citation1997). In this study, chlorophyll was a useful physiological indicator for detecting plant health. Furthermore, many pigments absorb light energy and protect chlorophylls and photodamage (Ramel et al. Citation2012). In the future study, measuring pigments by a nondestructive method such as visible/near-infrared spectra would support more physiological data specifically (Tilahun et al. Citation2018).
Photosynthesis is the primary process affected by water deficit. Plants can avoid drought stress by maximizing water uptake (e.g. tapping groundwater by deep roots) or minimizing water loss (e.g. stomatal closure, small leaves). This reduction is vital in maintaining the water status of woody plants (Kozlowski and Pallardy Citation2002). The high WUE is a direct consequence of the decrease in gs before the decrease in A, which is a typical response observed in other species when subjected to mild drought stress (Medrano et al. Citation2010) and also for the closely related Manihot sp. (Euphorbiaceae family) (El-Sharkawy Citation2007). The previous experiments showed that A decreases with gs dropping (Tenhunen et al. Citation1987; Jarvis and Davies Citation1998; Miyashita et al. Citation2005; Lee et al. Citation2022). Therefore, decreasing gs will reduce water loss under drought stress, generating a drop in CO2 uptake (Miyashita et al. Citation2005).
Among many, the application of infrared thermal imaging for finding canopy temperature as a screening parameter for biotic or abiotic stresses is widely studied and is a topic of active research (Nilsson Citation1995; Chaerle and Van Der Straeten Citation2001; Stoll and Jones Citation2007; Jones et al. Citation2009; Fuentes et al. Citation2012; Prashar and Jones Citation2014; Raza et al. Citation2014; Baranowski et al. Citation2015; Grant et al. Citation2016; Mahlein Citation2016; Mangus et al. Citation2016; Ortiz-Bustos et al. Citation2017). Leaf temperature is a physiological trait that can be used for monitoring plant water status (Jimenez-Bello et al. Citation2011). The temperatures of leaves or canopies can be used as indicators of stomatal closure in response to soil water stress (Jones et al. Citation2002; Citation2009). Stomatal regulation of leaf gas exchange (CO2 and H2O fluxes) in response to the environment plays a key role in this adaptation, allowing a compromise between photosynthetic gains and water loss as well as allowing regulation of canopy temperature (Tcanopy) (Jones Citation1992; Chaves et al. Citation2003). Reduced transpiration under water deficits and high irradiance raise the risk of leaf temperature (Tleaf) increasing above the optimum for a metabolic activity or above the threshold, leading to irreversible leaf tissue oxidative stress (Lee et al. Citation2022). Our result is similar to Surendar et al. (Citation2013), who reported that the cultivars of Matti, Matti x Anaikomban, Matti x cultivar rose, and Pisang jajee x Matti showed an increase in leaf temperature of 4 °C subjected to water stress conditions. These results are also strongly supported by Siddique et al. (Citation2000), who reported that the exposure of plants to water stress substantially decreased the leaf water potential, relative water content, and transpiration rate with a concomitant increase in leaf temperature. It has already been shown that thermal imaging effectively detects crop stress (Grant et al. Citation2007; Möller et al. Citation2007); here, we suggest that it also applies to environmental monitoring and ecosystem management, although in the particular environment studied. It gave results of the leaf temperature at the different parts of the leaf, such as the upper, middle, and bottom leaves. Besides assessing the other physiology parameters, monitoring leaf temperature at different positions should be useful to record the duration for which part of the leaves is above the optimal temperature for photosynthesis, which can be incorporated into model productivity predictions. We found that the highest temperature was recorded in the upper leaves compared to the other two positions. The result suggests that the increase may be related to the differences in leaf exhibit in physiological and anatomical adaptation to the drought. Leaf size, shape, and age may influence important physiological processes, including A, E, and thermoregulation, and vary with several environmental factors. Studies focusing on the characteristics of leaves of single individual species under different environmental conditions are important for revealing specific adaptive strategies at the species level (Zhu et al. Citation2012; Ramirez-Valiente et al. Citation2015; Liu et al. Citation2018). Several well-known compromises exist between allocation to size and the number of organs in plant bodies or individuals in plant populations (Yang et al. Citation2008; Whitman and Aarssen Citation2010; Scott and Aarssen Citation2012). Several previous studies have found that the remarkable variability in leaf size plays a prominent role in leaf thermal regulation (Givnish and Vermeij Citation1976; Ackerly et al. Citation2002; Jensen and Zwieniecki Citation2013; Wright et al. Citation2017). The different positions of a leaf may differ in leaf age and size. Mostly, the upper leaves are younger than the middle and bottom ones. The low temperature in the mature leaves may correlate to the leaf thickness, which regulates leaf temperature via a thickened leaf boundary layer while the seedlings were grown under drought stress (Ackerly et al. Citation2002; Niinemets et al. Citation2006). This is characteristic of the thickness of the boundary layer, where heat transfer is slower relative to the more turbulent air beyond the leaf (Givnish and Vermeij Citation1976; Jensen and Zwieniecki Citation2013).
Furthermore, Kerstetter and Poethig (Citation1998) and Tsukaya (Citation2013) also reported that depending on the age of the plant, the emerging leaves of Arabidopsis differ in shape, and the cells composing them differ in thickness and size. Thus increase in leaf thickness may increase the heat capacity, which can prevent a rapid rise in leaf temperature. Moreover, Wang et al. (Citation2011) found that a thicker leaf blade may increase leaf water content under dry conditions. Leaf anatomy influences the photosynthetic capacity by changing the mesophyll thickness and increasing the space for chloroplasts at the cell surface necessary for the gas exchange (Oguchi et al. Citation2003).
Although the effects of leaf temperature on photosynthesis have been extensively studied, most investigations have focused on the responses of fully expanded leaves (Sharkey Citation2005). Still, few reports show how the leaf development stage affects this interaction. In particular, the more immature leaf laminae exhibit far lower rates of photosynthesis as measured by gas exchange (Woodall et al. Citation1998; Hughes et al. Citation2007; Snider et al. Citation2009). The difference was attributable to lower transpiration rates in the younger leaves, which cannot dissipate excess heat via transpirational cooling in the absence of functional stomata. Thus, mature leaves may be able to control water loss through high A and rapid transpiration. Stomatal pores in the epidermis provide gates for two important plant processes, photosynthesis and transpiration. Open and close stomata to regulate CO2 uptake and water evaporation in response to environmental. Increasing gs, which regulates gas exchange (CO2 and water), can allow plants to increase their CO2 uptake and subsequently enhance photosynthesis. The Stomatal apparatus is determined by transpiration’s balance of CO2 uptake for photosynthesis against water loss (Hetherington and Woodward Citation2003). Increased CO2 uptake due to increased gs results in a higher E. Transpiring leaves is cooler than leaves with closed stomata (without transpirational cooling).
Leaves at different positions had different leaf areas and stomatal densities at different developmental stages. In many plants, stomatal density, defined as the number of stomata per unit leaf area, positively correlates with gs and WUE (Hetherington and Woodward Citation2003; Masle et al. Citation2005; Xu and Zhou Citation2008; Liu et al. Citation2012). A low leaf temperature phenotype can result from increased stomatal density via water loss through enhanced transpiration. Although, Leuzinger and Körner (Citation2007) have shown how average temperatures in forest trees leaf are strongly dependent on the density of leaves and branching habits as well as leaf dimensions and gs. In the long-term response to water deficit, gs can be influenced by leaf anatomical traits such as stomatal density and size, which can vary to acclimate to the environment (Xu and Zhou Citation2008; Franks and Beerling Citation2009).
As a result, D. cochinchinensis seedlings under drought stress on day 5, 8, 11, and 14 showed significant differences between before and after applied drought stress. Some photosynthetic parameters were decreased after drought except WUE. However, there were slight differences in some drought stress groups. Under drought stress, E, gs, A, and chlorophyll content were decreased, whereas WUE was increased to enhance drought resistance. On the other hand, Fv/Fm seedlings had declined significantly in all drought stress conditions. As stomata close, water loss induced by transpiration decreases, which increases leaf temperature. Therefore, increased leaf temperature could be related to increased stress.
Thermal imaging of leaf temperature change can be used as an indicator of stomatal closure in response to water deficit and seems to be a tool that could supplement tree physiology parameters. In this study, D. Cochinchinensis seedlings seemed to have to water 5 days after the drought. Thermal imaging of leaf temperature and chlorophyll fluorescence could detect significant responses to water deficit under 5 days before chlorophyll content and leaf gas exchange parameters. Therefore, it can be effectively used to determine plant water needs, which can be used in precision irrigation systems. In addition, this could be the reference for the drought hardening before out-planting, where it meets with the natural condition after experiencing drought.
Although this study provides valuable insights, one major limitation is the absence of control seedlings for comparison with drought-treated seedlings. The results obtained were similar to previous studies that found a significant decrease in Fv/Fm and an increase in leaf temperature in drought-treated Quercus acutissima seedlings (Lim et al. Citation2017), as well as a significant decrease in gs and an increase in leaf temperature in Grape vines (Vitis vinifera L) under greenhouse conditions (Grant et al. Citation2006). Another challenge was achieving precise environmental control, which could have impacted the results. To validate the effectiveness of thermal imaging, future studies should consider other specific factors such as solar radiation, soil water potential and vapor pressure deficit. Furthermore, future research will also benefit from examining other drought-tolerant strategies, such as prolonging the drought period, priming for drought and recovery stages.
Supplemental Material
Download Zip (1.7 MB)Disclosure statement
No potential conflict of interest was reported by the author(s).
Additional information
Funding
References
- Ackerly D, Knight C, Weiss S, Barton K, Starmer K. 2002. Leaf size, specific leaf area and microhabitat distribution of chaparral woody plants: contrasting patterns in species level and community level analyses. Oecologia. 130(3):449–457.
- Banks JM. 2018. Chlorophyll fluorescence as a tool to identify drought stress in Acer genotypes. Environ Exp Bot. 155:118–127.
- Bannister P. 1986. Observations on water potentials and drought resistance of trees and shrubs after a period of summer drought around Dunedin, New Zealand. NZ J Bot. 24(3):387–392.
- Baranowski P, Jedryczka M, Mazurek W, Babula-Skowronska D, Siedliska A, Kaczmarek J. 2015. Hyperspectral and thermal imaging of oilseed rape (Brassica napus) response to fungal species of the genus Alternaria. PLoS One. 10(3):e0122913.
- Bongers F, Poorter L, Hawthorne WD. 2004. The forests of Upper Guinea: gradients in large species composition. In: Poorter L, Bongers F, Kouamé FN, Hawthorne WD, editors. Biodiversity of West African forests: an ecological atlas of woody plant species. Wallingford: CABI International; p. 41–52.
- Bongers F, Poorter L, Rompaey R, Parren MPE. 1999. Distribution of twelve moist forest canopy tree species in Liberia and Cote d’Ivoire: response curves to a climatic gradient. J Veg Sci. 10(3):371–382.
- Cernusak LA, Aranda J, Marshall JD, Winter K. 2007. Large variation in whole-plant water-use efficiency among tropical tree species. New Phytol. 173(2):294–305.
- Chaerle L, Van Der Straeten D. 2001. Seeing is believing: imaging techniques to monitor plant health. Biochim Biophys Acta Gene Struct Expr. 1519(3):153–166.
- Chaves MM, Maroco JP, Pereira JS. 2003. Understanding plant responses to drought – from genes to the whole plant. Funct Plant Biol. 30(3):239–264.
- Chaves ARM, Ten-Caten A, Pinheiro HA, Ribeiro A, DaMatta FM. 2008. Seasonal changes in photoprotective mechanisms of leaves from shaded and unshaded field-grown coffee (Coffea arabica L.) trees. Trees. 22(3):351–361.
- Cheesman AW, Winter K. 2013. Growth response and acclimation of CO2 exchange characteristics to elevated temperatures in tropical tree seedlings. J Exp Bot. 64(12):3817–3828.
- Condit R, Hubbell SP, Foster RB. 1995. Mortality rates of 205 neotropical tree and shrub species and the impact of a severe drought. Ecol Monogr. 65(4):419–439.
- Cordeiro YEM, Pinheiro HA, dos Santos Filho BG, Corrêa SS, e Silva JRR, Dias-Filho MB. 2009. Physiological and morphological responses of young mahogany (Swietenia macrophylla King) plants to drought. For Ecol Manage. 258(7):1449–1455.
- Cui YY, Pandey DM, Hahn EJ, Paek KY. 2004. Effect of drought on physiological aspects of Crassulacean acid metabolism in Doritaenopsis. Plant Sci. 167(6):1219–1226.
- Dai A. 2011. Drought under global warming: a review. WIREs Clim Change. 2(1):45–65.
- Dale JE. 1988. The control of leaf expansion. Annu Rev Plant Physiol Plant Mol Biol. 39(1):267–295.
- Deutsch CA, Tewksbury JJ, Huey RB, Sheldon KS, Ghalambor CK, Haak DC, Martin PR. 2008. Impacts of climate warming on terrestrial ectotherms across latitude. Proc Natl Acad Sci USA. 105(18):6668–6672.
- Ditmarová L, Kurjak D, Palmroth S, Kmet J, Strelcová K. 2010. Physiological responses of Norway spruce (Picea abies) seedlings to drought stress. Tree Physiol. 30(2):205–213.
- Doughty CE, Goulden ML. 2008. Are tropical forests near a high temperature threshold? J Geophys Res. 113(G1):.
- Dünisch O, Erbreich M, Eilers T. 2003. Water balance and water potentials of a monoculture and an enrichment plantation of Carapa guianensis Aubl. in the Central Amazon. For Ecol Manage. 172(2-3):355–367.
- El-Sharkawy MA. 2007. Physiological characteristics of cassava tolerance to prolonged drought in the tropics: implications for breeding cultivars adapted to seasonally dry and semiarid environments. Braz J Plant Physiol. 19(4):257–286.
- Engelbrecht BMJ, Kursar TA. 2003. Comparative drought resistance of seedlings of 28 species of co-occurring tropical woody plants. Oecologia. 136(3):383–393.
- Fern K. 2014. Useful tropical plants database. http://tropical.theferns.info
- Franks PJ, Beerling DJ. 2009. Maximum leaf conductance driven by CO2 effects on stomatal size and density over geologic time. Proc Natl Acad Sci USA. 106(25):10343–10347.
- Fuentes S, De Bei R, Pech J, Tyerman S. 2012. Computational water stress indices obtained from thermal image analysis of grapevine canopies. Irrig Sci. 30(6):523–536.
- Garg A, Bordoloi S, Ganesan SP, Sekharan S, Sahoo L. 2020. A relook into plant wilting: observational evidence based on unsaturated soil–plant-photosynthesis interaction. Sci Rep. 10(1):1–15.
- Gentry AH. 1988. Changes in plant community diversity and floristic composition on environmental and geographical gradients. Ann Mo Bot Gard. 75(1):1–34.
- Givnish TJ, Vermeij GJ. 1976. Sizes and shapes of Liane leaves. Am Nat. 110(975):743–778.
- Grant OM, Chaves MM, Jones HG. 2006. Optimizing thermal imaging as a technique for detecting stomatal closure induced by drought stress under greenhouse conditions. Physiol Plant. 127(3):507–518.
- Grant OM, Ochagavía H, Baluja J, Diago M, Tardáguila J. 2016. Thermal imaging to detect spatial and temporal variation in the water status of grapevine (Vitis vinifera L.) J Hortic Sci Biotechnol. 91(1):43–54.
- Grant OM, Tronina Ł, Jones HG, Chaves MM. 2007. Exploring thermal imaging variables for the detection of stress responses in grapevine under different irrigation regimes. J Exp Bot. 58(4):815–825.
- Hall J, Swaine MD. 1976. Classification and ecology of closed-canopy forest in Ghana. J Ecol. 64(3):913–951.
- Hetherington AM, Woodward FI. 2003. The role of stomata in sensing and driving environmental change. Nature. 424(6951):901–908.
- Holmgren M, Poorter L. 2007. Does a ruderal strategy dominate the endemic flora of the West African forests? J Biogeogr. 34(6):1100–1111.
- Hughes NM, Morley CB, Smith WK. 2007. Coordination of anthocyanin decline and photosynthetic maturation in juvenile leaves of three deciduous tree species. New Phytol. 175(4):675–685.
- Jarvis AJ, Davies WJ. 1998. Modelling stomatal responses to soil and atmospheric drought. J Exp Bot. 49(Special):399–406.
- Jensen KH, Zwieniecki MA. 2013. Physical limits to leaf size in tall trees. Phys Rev Lett. 110(1):018104.
- Jimenez-Bello MA, Ballester C, Castel JR, Intrigliolo DS. 2011. Development and validation of an automatic thermal imaging process for assessing plant water status. Agric Water Manag. 98(10):1497–1504.
- Jones HG. 1992. Stomata. In: Jones HG, editor. Plants and microclimate: a quantitative approach to environmental plant physiology. Cambridge: Cambridge University Press; p. 122–152.
- Jones HG, Serraj R, Loveys BR, Xiong L, Wheaton A, Price AH. 2009. Thermal infrared imaging of crop canopies for the remote diagnosis and quantification of plant responses to water stress in the field. Funct Plant Biol. 36(11):978–989.
- Jones HG, Stoll M, Santos T, de Sousa C, Chaves MM, Grant OM. 2002. Use of infrared thermography for monitoring stomatal closure in the field: application to grapevine. J Exp Bot. 53(378):2249–2260.
- Jung S, Steffen KL, Lee HJ. 1998. Comparative photoinhibition of a high and a low altitude ecotype of tomato (Lycopersicon hirsutum) to chilling stress under high and low light conditions. Plant Sci. 134(1):69–77.
- Kerstetter RA, Poethig RS. 1998. The specification of leaf identity during shoot development. Annu Rev Cell Dev Biol. 14(1):373–398.
- Kozlowski TT. 1997. Responses of woody plants to flooding and salinity. Tree Physiol. 17(7):1–28.
- Kozlowski TT, Pallardy SG. 2002. Acclimation and adaptive responses of woody plants to environmental stresses. Bot Rev. 68(2):270–334.2.0.CO;2]
- Ky-Dembele C, Bayala J, Savadogo P, Tigabu M, Odén PC, Boussim IJ. 2010. Comparison of growth responses of Khaya senegalensis seedlings and stecklings to four irrigation regimes. Silva Fenn. 44(5):787–798.
- Lee JK, Kwak MJ, Jeong SG, Woo SY. 2022. Individual and interactive effects of elevated ozone and temperature on plant responses. Horticulturae. 8(3):211.
- Lee JK, Kwak MJ, Park SH, Kim HD, Lim YJ, Jeong SG, Choi YS, Woo SY. 2021. Ozone response of leaf physiological and stomatal characteristics in Brassica juncea L. at supraoptimal temperatures. Land. 10(4):357.
- Lee KC, Kweon H, Sung JW, Kim YS, Song YG, Cha S, Koo N. 2022. Physiological response analysis for the diagnosis of drought and waterlogging damage in Prunus yedoensis. Forest Sci Technol. 18(1):14–25.
- Lei Y, Yin C, Li C. 2006. Differences in some morphological, physiological, and biochemical responses to drought stress in two contrasting populations of Populus przewalskii. Physiol Plant. 127(2):182–191.
- Leuzinger S, Körner C. 2007. Tree species diversity affects canopy leaf temperatures in a mature temperate forest. Agric for Meteorol. 146(1-2):29–37.
- Li FL, Bao WK, Wu N. 2011. Morphological, anatomical and physiological responses of Campylotropis polyantha (Franch.) Schindl seedlings to progressive water stress. Sci Hortic. 127(3):436–443.
- Lim H, Kang JW, Lee S, Lee H, Lee WY. 2017. Growth and physiological responses of Quercus acutissima seedling under drought stress. Plant Breed Biotech. 5(4):363–370.
- Liu BB, Li M, Li QM, Cui QQ, Zhang WD, Ai XZ, Bi HG. 2018. Combined effects of elevated CO2 concentration and drought stress on photosynthetic performance and leaf structure of cucumber (Cucumis sativus L.) seedlings. Photosynt. 56(3):942–952.
- Liu B, Liang J, Tang G, Wang X, Liu F, Zhao D. 2019. Drought stress affects on growth, water use efficiency, gas exchange and chlorophyll fluorescence of Juglans rootstocks. Sci Hortic. 250:230–235.
- Liu MH, Yi LT, Yu SQ, Yu F, Yin XM. 2015. Chlorophyll fluorescence characteristics and the growth response of Elaeocarpus glabripetalus to simulated acid rain. Photosynt. 53(1):23–28.
- Liu J, Zhang F, Zhou J, Chen F, Wang B, Xie X. 2012. Phytochrome B control of total leaf area and stomatal density affects drought tolerance in rice. Plant Mol Biol. 78(3):289–300.
- Long SP, Humphries S, Falkowski PG. 1994. Photoinhibition of photosynthesis in nature. Annu Rev Plant Physiol Plant Mol Biol. 45(1):633–662.
- Mahlein AK. 2016. Plant disease detection by imaging sensors – parallels and specific demands for precision agriculture and plant phenotyping. Plant Dis. 100(2):241–251.
- Mangus DL, Sharda A, Zhang N. 2016. Development and evaluation of thermal infrared imaging system for high spatial and temporal resolution crop water stress monitoring of corn within a greenhouse. Comput Electron Agric. 121:149–159.
- Markwell J, Osterman JC, Mitchell JL. 1995. Calibration of the Minolta SPAD-502 leaf chlorophyll meter. Photosynth Res. 46(3):467–472.
- Marquard RD, Tipton JL. 1987. Relationship between extractable chlorophyll and an in situ method to estimate leaf greenness. horts. 22(6):1327.
- Masle J, Gilmore SR, Farquhar GD. 2005. The ERECTA gene regulates plant transpiration efficiency in Arabidopsis. Nature. 436(7052):866–870.
- Maxwell K, Johnson GN. 2000. Chlorophyll fluorescence—a practical guide. J Exp Bot. 51(345):659–668.
- McDowell N, Pockman WT, Allen CD, Breshears DD, Cobb N, Kolb T, Plaut J, Sperry J, West A, Williams DG, et al. 2008. Mechanism of plant survival and mortality during drought: why do some plants survive while others succumb to drought? New Phytol. 178(4):719–739.,.
- Medrano H, Flexas J, Ribas-Carbó M, Gulías J. 2010. Measuring water use efficiency in grapevines. In: Delrot S, Medrano H, Or E, Bavaresco L, Grando S, editors. Methodologies and results in grapevine research. Germany: Springer; p. 57–70.
- Mihailović N, Lazarević M, Dželetović Z˘, Vučković M, Đurđević M. 1997. Chlorophyllase activity in wheat, Triticum aestivum L. leaves during drought and its dependence on the nitrogen ion form applied. Plant Sci. 129(2):141–146.
- Millar CI, Stephenson NL, Stephens SL. 2007. Climate change and forests of the future: managing in the face of uncertainty. Ecol Appl. 17(8):2145–2151.
- Miyashita K, Tanakamaru S, Maitani T, Kimura K. 2005. Recovery responses of photosynthesis, transpiration, and stomatal conductance in kidney bean following drought stress. Environ Exp Bot. 53(2):205–214.
- Möller M, Alchanatis V, Cohen Y, Meron M, Tsipris J, Naor A, Ostrovsky V, Sprintsin M, Cohen S. 2007. Use of thermal and visible imagery for estimating crop water status of irrigated grapevine. J Exp Bot. 58(4):827–838.
- Moritsuka E, Chhang P, Tagane S, Toyama H, Sokh H, Yahara T, Tachida H. 2017. Genetic variation and population structure of a threatened timber tree Dalbergia cochinchinensis in Cambodia. Tree Genet Genomes. 13(6):1–11.
- Niinemets Ü. 2010. Responses of forest trees to single and multiple environmental stresses from seedlings to mature plants: past stress history, stress interactions, tolerance and acclimation. For Ecol Manage. 260(10):1623–1639.
- Niinemets Ü, Portsmuth A, Tobias M. 2006. Leaf size modifies support biomass distribution among stems, petioles and mid-ribs in temperate plants. New Phytol. 171(1):91–104.
- Nilsson HE. 1995. Remote sensing and image analysis in plant pathology. Annu Rev Phytopathol. 17(2):154–166.
- Niu S, Luo Y, Li D, Cao S, Xia J, Li J, Smith MD. 2014. Plant growth and mortality under climatic extremes: an overview. Environ Exp Bot. 98:13–19.
- O'sullivan OS, Heskel MA, Reich PB, Tjoelker MG, Weerasinghe LK, Penillard A, Zhu L, Egerton JJG, Bloomfield KJ, Creek D, et al. 2017. Thermal limits of leaf metabolism across biomes. Glob Change Biol. 23(1):209–223.
- Oguchi R, Hikosaka K, Hirose T. 2003. Does the photosynthetic light‐acclimation need change in leaf anatomy? Plant Cell Environ. 26(4):505–512.
- Ortiz-Bustos CM, Pérez-Bueno ML, Barón M, Molinero-Ruiz L. 2017. Use of Blue-Green fluorescence and thermal imaging in the early detection of sunflower infection by the root parasitic weed Orobanche cumana Wallr. Front Plant Sci. 8:833.
- Pagter M, Bragato C, Brix H. 2005. Tolerance and physiological responses of Phragmites australis to water deficit. Aquat Bot. 81(4):285–299.
- Peprah T, Kyereh B, Owusu KA, Adu-Bredu S. 2009. Drought tolerance of Garcinia kola and Garcinia afzelii at the seedlings stage. Gha J For. 25:13–27.
- Poorter L, Bongers F, Kouamé FN, Hawthorne WD. 2004. Biodiversity of West African forests: An ecological atlas of woody plant species. Wallingford: CABI International.
- Poorter L, Hayashida-Oliver Y. 2000. Effects of seasonal drought on gap and understory seedlings in a Bolivian moist forest. J Trop Ecol. 16(4):481–498.
- Prashar A, Jones HG. 2014. Infra-red thermography as a high-throughput tool for field phenotyping. Agronomy. 4(3):397–417.
- Pšidová E, Ditmarová Ľ, Jamnická G, Kurjak D, Majerová J, Czajkowski T, Bolte A. 2015. Photosynthetic response of beech seedlings of different origin to water deficit. Photosynt. 53(2):187–194.
- Ramel F, Birtic S, Ginies C, Soubigou-Taconnat L, Triantaphylidès C, Havaux M. 2012. Carotenoid oxidation products are stress signals that mediate gene responses to singlet oxygen in plants. Proc Natl Acad Sci USA. 109(14):5535–5540.
- Ramirez-Valiente JA, Koehler K, Cavender-Bares J. 2015. Climatic origins predict variation in photoprotective leaf pigments in response to drought and low temperatures in live oaks (Quercus series Virentes). Tree Physiol. 35(5):521–534.
- Raza SEA, Smith HK, Clarkson GJJ, Taylor G, Thompson AJ, Clarkson J, Rajpoot NM. 2014. Automatic detection of regions in spinach canopies responding to soil moisture deficit using combined visible and thermal imagery. PLoS One. 9(6):e97612.
- Scott SL, Aarssen LW. 2012. Within-species leaf size–number trade-offs in herbaceous angiosperms. Botany. 90(3):223–235.
- Sharkey TD. 2005. Effects of moderate heat stress on photosynthesis: importance of thylakoid reactions, rubisco deactivation, reactive oxygen species, and thermotolerance provided by isoprene. Plant Cell Environ. 28(3):269–277.
- Sheffield J, Wood EF. 2008. Projected changes in drought occurrence under future global warming from multi-model, multi-scenario, IPCC AR4 simulations. Clim Dyn. 31(1):79–105.
- Sheffield J, Wood EF, Roderick ML. 2012. Little change in global drought over the past 60 years. Nature. 491(7424):435–438.
- Siddique MRB, Hamid A, Islam MS. 2000. Drought stress effects on water relations of wheat. Bot Stud. 41:35–39.
- Snider JL, Choinski JS, Wise RR. 2009. Juvenile Rhus glabra leaves have higher temperatures and lower gas exchange rates than mature leaves in the field when compared during periods of high irradiance. J Plant Physiol. 166(7):686–696.
- Stoll M, Jones HG. 2007. Thermal imaging as a viable tool for monitoring plant stress. J Int Sci Vigne Vin. 41(2):77–84.
- Stott P. 2016. How climate change affects extreme weather events. Science. 352(6293):1517–1518.
- Surendar KK, Devi DD, Ravi I, Jeyakumar P, Velayudham K. 2013. Effect of water stress on leaf temperature, transpiration rate, stomatal diffusive resistance and yield of banana. Plant Gene Trait. 4(1):43–47.
- Swaine MD. 1996. Rainfall and soil fertility as factors limiting forest species distributions in Ghana. J Ecol. 84(3):419–428.
- Tenhunen JD, Pearcy RW, Lange OL. 1987. Diurnal variations in leaf conductance and gas exchange in natural environments. In: Zeiger E, Farquhar GD, Cowan IR editors. Stomatal Function. Stanford, CA: Stanford University Press; p. 323–351.
- Ter Steege H, Pitman NCA, Phillips OL, Chave J, Sabatier D, Duque A, Molino JF, Prévost MF, Spichiger R, Castellanos H, et al. 2006. Continental-scale patterns of canopy tree composition and function across Amazonia. Nature. 443(7110):444–447.
- Teskey R, Wertin T, Bauweraerts I, Ameye M, McGuire MA, Steppe K. 2015. Responses of tree species to heat waves and extreme heat events. Plant Cell Environ. 38(9):1699–1712.
- Tilahun S, Park DS, Seo MH, Hwang IG, Kim SH, Choi HR, Jeong CS. 2018. Prediction of lycopene and β-carotene in tomatoes by portable chroma-meter and VIS/NIR spectra. Postharvest Biol Technol. 136:50–56.
- Trenberth KE, Dai A, van der Schrier G, Jones PD, Barichivich J, Briffa KR, Sheffield J. 2014. Global warming and changes in drought. Nature Clim Change. 4(1):17–22.
- Tsukaya H. 2013. Leaf development. Arabidopsis Book. 11:e0163.
- Wang JR, Hawkins CDB, Letchford T. 1998. Photosynthesis, water and nitrogen use efficiencies of four paper birch (Betula papyrifera) populations grown under different soil moisture and nutrient regimes. For Ecol Manage. 112(3):233–244.
- Wang R, Huang W, Chen L, Ma L, Guo C, Liu X. 2011. Anatomical and physiological plasticity in Leymus chinensis (Poaceae) along large-scale longitudinal gradient in northeast China. PLoS One. 6(11):1–8.
- Werden LK, Averill C, Crowther TW, Calderón-Morales E, Toro L, Alvarado JP, Gutiérrez LM, Mallory DE, Powers JS. 2022. Below-ground traits mediate tree survival in a tropical dry forest restoration. Philos Trans R Soc Lond B Biol Sci. 378(1867):20210067.
- Whitman T, Aarssen LW. 2010. The leaf size/number trade-off in herbaceous angiosperms. J Plant Ecol. 3(1):49–58.
- Woo NS, Badger MR, Pogson BJ. 2008. A rapid, noninvasive procedure for quantitative assessment of drought survival using chlorophyll fluorescence. Plant Methods. 4(1):27.
- Woodall GS, Dodd IC, Stewart GR. 1998. Contrasting leaf development within the genus Syzygium. J Exp Bot. 49(318):79–87.
- Wright IJ, Dong N, Maire V, Prentice IC, Westoby M, Díaz S, Gallagher RV, Jacobs BF, Kooyman R, Law EA, et al. 2017. Global climatic drivers of leaf size. Science. 357(6354):917–921.,.
- Xioling L, Ning L, Jin Y, Fuzhou Y, Faju C, Fangqing C. 2011. Morphological and photosynthetic responses of riparian plant Distylium chinense seedlings to simulated autumn and winter flooding in three Gorges Reservoir Region of the Yangtze River, China. Sheng Tai Xue Bao. 31(1):31–39.
- Xu Z, Zhou G. 2008. Responses of leaf stomatal density to water status and its relationship with photosynthesis in a grass. J Exp Bot. 59(12):3317–3325.
- Yadava UL. 1986. A rapid and nondestructive method to determine chlorophyll in intact leaves. horts. 21(6):1449–1450.
- Yang DM, Li GY, Sun SC. 2008. The generality of leaf size versus number trade-off in temperate woody species. Ann Bot. 102(4):623–629.
- Yang F, Miao LF. 2010. Adaptive responses to progressive drought stress in two poplar species originating from different altitudes. Silva Fenn. 44(1):23–37.
- Zandalinas SI, Fritschi FB, Mittler R. 2021. Global warming, climate change, and environmental pollution: recipe for a multifactorial stress combination disaster. Trends Plant Sci. 26(6):588–599.
- Zhu Y, Kang H, Xie Q, Wang Z, Yin S, Liu C. 2012. Pattern of leaf vein density and climate relationship of Quercus variabilis populations remains unchanged with environmental changes. Trees. 26(2):597–607.
- Zhu Y, Luo X, Nawaz G, Yin J, Yang J. 2020. Physiological and biochemical responses of four cassava cultivars to drought stress. Sci Rep. 10(1):1–12.