
Abstract
Tumor associated macrophages and tumor infiltrating regulatory T cells greatly hamper host-protective antitumor responses. Therefore, we utilized a novel immunomodulator, heat-killed Mycobacterium indicus pranii (Mw), to repolarize TAM and an agonistic GITR antibody (DTA-1) to reduce intratumoral regulatory T cell frequency for generation of a host-protective antitumor response. Although, the combination of Mw and DTA-1was found to be effective against advanced stage tumors, however, Mw or DTA-1 failed to do so when administered individually. The presence of high level of regulatory T cells abrogated the only Mw induced antitumor functions, whereas only DTA-1 treatment was found to be ineffective due to its inability to induce TAM repolarization in vivo. The combination therapy was found to be effective since DTA-1 treatment reduced the frequency of regulatory T cells to such an extent where they could not attenuate Mw induced TAM repolarization in vivo. Therefore, the combination therapy involving Mw and DTA-1 may be utilized to the success of advanced stage solid tumor immunotherapies.
Introduction
Most of the solid tumors escape early detection and it is very difficult to recover patients from advanced stage tumors. Modern therapeutic approaches against advanced stage solid tumors include chemotherapy or radiotherapy, which are found to be very much detrimental to the host due to their non-specific action.Citation1-3 Moreover, most of the advanced stage solid tumors often metastasize from their site of origin to distant organs, thereby adding further complication to their treatment.Citation4 In this regard, immunotherapeutic approaches may be helpful due to their specific action on cancer cells.Citation5 However, the immune effector cells at the tumor microenvironment are alternatively polarized in such a way that they support tumor progression.Citation6,7 Among the tumor promoting immune cells, tumor associated macrophages (TAM) and regulatory T cells are found to be crucial due to their profound influence in the progression of most of the solid tumors.Citation8,9
Macrophages are the most abundant immune cells found within most of the solid tumors and are attracted by the chemokines secreted by the growing tumor.Citation10,11 Once within the tumor, the infiltrating macrophages, known as TAM, become alternatively polarized to a M2 phenotypeCitation12 and begin to secrete high level of anti-inflammatory cytokines,Citation13 growth factors,Citation14 angiogenic factorsCitation15 necessary for the growth and persistence of the tumor within the host. Moreover, TAM play a crucial role in cancer stem cell maintenanceCitation16 and help to initiate metastasis by inducing epithelial to mesenchymal transition in cancer cells.Citation17 Furthermore, TAM inhibit T cell proliferation either directlyCitation18 or via accumulation of regulatory T cells at the tumor microenvironment.Citation19 Regulatory T cells are essential for tumor progression in a host, since depletion of these cells in a host greatly hampers tumor progression.Citation20 Regulatory T cells are attracted to the growing tumor along a chemokine gradient produced by the TAMCitation19 and their precursor monocytic myeloid derived suppressor cells (MDSCs).Citation21 Accumulation of regulatory T cells at the tumor microenvironment attenuates the antitumor T cell responses.Citation22 Therefore, a possible immunotherapeutic approach would be to redirect the TAM from the pro-tumoral M2 to antitumoral M1 phenotype for the generation of a protective immune response against cancer.
Interestingly, we have recently shown that heat killed Mycobacterium indicus pranii (Mw) restores pro-inflammatory M1 function in Leishmania donovani infected macrophages.Citation23,24 Therefore, we examined whether Mw could repolarize the TAM in situ and generate a host protective antitumor response. In accordance with other studies,Citation25 Mw failed to generate host protective antitumor responses within the host against advanced stage tumors. However, the molecular mechanism for the failure of Mw in advanced tumor setting remains unexplored.
In the present study, we have observed that in advanced stage B16F10 melanoma, Mw alone fails to restrict regulatory T cell accumulation within the tumor mass and associated immune alterations in tumor microenvironment. However, combination of an agonistic antibody for GITR, DTA-1, with Mw has provided superior antitumor benefits by suppressing intratumoral regulatory T cell populations and by restoration of the compromised pro-inflammatory and antigen presentation function of TAM. Therefore, the combination therapy involving Mw and DTA-1 supports its translational utility in the management of advanced stage solid tumors.
Results
Mw induced repolarization of TAM toward M1 phenotype in vitro
We first investigated whether the immunomodulator, Mw, could re-educate TAM toward immunostimulatory M1 form of macrophages in vitro. We observed that Mw induced significantly higher level of IL-12 and NO along with a marked reduction in IL-10 and TGF-β production in TAM compared to that of their untreated counterparts (). Moreover, Mw treatment augmented MHC-II surface expression () and restored the MHC-II dependent antigen presentation function in TAM compared to that of the untreated TAM (). Since, Mw induced IFN-γ dependent antitumor function,Citation25 we checked whether Mw could enhance IFN-γ responsiveness in TAM by upregulating the IFN-γ receptor surface expression. Interestingly, Mw treatment significantly augmented IFN-γ receptor surface expression in TAM compared to that of the untreated TAM ().
Figure 1. Mw induced functional reprogramming of TAM in p38 MAPK and NF-κB dependent manner. Control macrophages or TAM (105 cells / 200 μL) plated in a 96 well plate were left untreated or treated with LPS (100 ng/mL) or Mw (1:10 to TAM) for 4 h. (A) The cell free supernatant collected at 24 h was subjected to ELISA to detect the presence of IL-10, TGF-β,TNF-α, IL-12 whereas; the cell free supernatant collected at 48 h was subjected to Griess Method assay for the detection of nitrite generationas discussed in Materials and Methods. (B, D) In a separate set of experiments, control macrophages or TAM were treated as mentioned above were subjected to FACS for detection of MHC-II and IFN-γ receptor surface expression. (C) In another set of experiments, control macrophages or TAM were treated as mentioned above were subjected to MHC-II dependent antigen presentation assay as described in the Materials and Methods. (E) In a separate set of experiments, control macrophages or TAM (2 x 10⁶ cells) were left untreated or treated with LPS (100 ng/mL) or Mw (1:10 ratio to TAM) for 30 min, the cells were then lysed and subjected to western blot analysis with anti-phospho p38, ERK-1/2 and dephospho p38 and ERK-1/2 antibodies. (E) In another set of experiments, control macrophages or TAM (2 x 10⁶ cells) were left untreated or treated with LPS (100 ng/mL) or Mw (1:10 ratio to TAM) for 60 min and subjected to western blot analysis with anti-NF-κBp65, phospho or dephospho STAT3 antibodies. (F) In a separate set of experiments, control macrophages or TAM (105 cells) pretreated with SB203580 (1μM) or p65 siRNA or the control siRNA were left untreated or treated with LPS (100 ng/mL) or Mw (1:10 ratio to TAM) for 4 h, the cell free supernatants collected at 24 h or 48 h, the cell free supernatant collected at 24 h were subjected to ELISA for detection of IL-10, TGF-β, TNF-α, IL-12, whereas the cell free supernatant collected at 48 h was subjected to Griess Method assay for the detection of nitrite generation. (G, I) In a separate set of experiments, control macrophages or TAM were treated as mentioned above and subjected to FACS for detection of MHC-II and IFN-γ receptor surface expression. (H) In another set of experiments, control macrophages or TAM were treated as mentioned above and subjected to MHC-II dependent antigen presentation assay. The data shown here are mean ± standard deviation of three independent experiments, a value of p < 0.05 (* or τ ) was considered to be significant, whereas the FACS data and blots shown here are the best representative among three independent experiments.
It has been found that lack of NF-κBp65 nuclear translocation and p38 MAPK activation along with high level of STAT3 and ERK-1/2 MAPK activation in TAM are the principal reasons for their immunosuppressive phenotype.Citation26,29,34 Therefore, we investigated the activation of these transcription factors and MAPKs in TAM following Mw treatment. We observed significantly higher level of p38 MAPK activation and NF-κBp65 nuclear translocation along with a marked decrease in STAT3 and ERK-1/2 MAPK activation in Mw treated TAM compared to that of the untreated TAM (). Moreover, inhibition of NF-κBp65 and p38MAPK activation significantly attenuated Mw induced reprogramming of TAM to a M1 phenotype (). Collectively, these findings clearly suggested that Mw induced NF-κB nuclear translocation and p38MAPK activation were responsible for the restoration of M1 phenotype of TAM in vitro.
Mw failed to restrict advanced stage tumor progression and induce TAM repolarization in vivo
Next, we examined whether Mw could repolarize the TAM in vivo and restrict the progression of advanced stage solid tumors. In consistent with other studies,Citation25 we observed that Mw failed to restrict advanced stage solid tumor growth (). Moreover, TAM from Mw treated mice exhibited a highly immunosuppressive phenotype with a high level of IL-10 and TGF-β and no detectable IL-12, NO or TNF-α production either in resting condition or when activated with LPS (). In addition, MHC-II surface expression () as well as MHC-II dependent antigen presentation function () and IFN-γ receptor surface expression () were found to be very much abrogated in TAM isolated from both the untreated and Mw treated tumor bearing mice. Furthermore, we observed very high level of STAT3 and ERK-1/2 MAPK activation with no significant p38 MAPK activation or NF-κBp65 nuclear translocation in TAM from Mw treated as well as untreated tumor bearing mice (). In addition, TAM from both untreated and Mw treated tumor bearing mice were found to inhibit T cell proliferation (), IFN-γ () and IL-2 production (). Accordingly, we observed very low level of IFN-γ+ T cell frequency within the tumor mass of both Mw treated and untreated tumor bearing mice (). Therefore, these findings clearly depicted that Mw failed to induce repolarization of TAM isolated from advanced stage solid tumors in vivo, which might be the possible reason for the failure of Mw in controlling the progression of advanced stage solid tumors.
Figure 2. Mw treatment failed to generate protective antitumor response against late stage tumors. (A) 10Citation5 B16F10 melanoma cells were injected subcutaneously into the right flank of female C57BL/6 mice and were left untreated or treated with Mw (108 cells/mouse) on day 9 post-tumor challenge. The tumor volumes were monitored on every two days and the final tumor volume was determined at 21 d post-tumor challenge. The data shown here are representative of three independent experiments with n = 4/ mice group. TAM (105 cells) isolated from untreated and Mw treated mice were plated in a 96 well plate were left untreated or treated with LPS (100 ng/mL) or Mw (1:10 ratio to TAM) for 4 h. (B) The cell free supernatant collected at 24 h was subjected to ELISA to detect the presence of IL-10, TGF-β, TNF-α, IL-12 whereas; the cell free supernatant collected at 48 h was subjected to Griess Method assay for the detection of nitrite generation. (C, E) In a separate set of experiments, TAM (105 cells) isolated from untreated and Mw treated mice were left untreated or treated as mentioned above were subjected to FACS for detection of MHC-II and IFN-γ receptor surface expression. (See previous page) (D) In another set of experiments, TAM (105 cells) isolated from untreated and Mw treated mice were left untreated or treated as mentioned above were subjected to MHC-II dependent antigen presentation assay as described in the Materials and Methods. (F) In a separate set of experiments, TAM (2 x 10⁶ cells) isolated from untreated and Mw treated mice were left untreated or treated with LPS (100 ng/mL) or Mw (1:10 ratio to TAM) for 30 min, the cells were then lysed and subjected to western blot analysis with anti-phospho p38, ERK-1/2 and dephospho p38 and ERK-1/2 antibodies. (F) In another set of experiments, control macrophages or TAM (2 x 10⁶ cells) were left untreated or treated with LPS (100 ng/mL) or Mw (1:10 ratio to TAM) for 60 min and subjected to western blot analysis with anti- NF-κBp65, phospho or dephospho STAT3 antibodies. (G) In a separate set of experiments, CD25- T cell isolated from both the untreated and Mw treated tumor bearing mice were co-cultured with DC pre-activated with whole tumor lysate pulsed and TAM isolated from untreated and Mw treated tumor bearing mice were added to the culture at 1:1 ratio (DC:TAM) and T cell proliferation was determined. (H, I) The cell free supernatant was collected and subjected to ELISA for detection of IFN-γ and IL-2. In a separate experimental set, tumors from both untreated and Mw treated mice were subjected to enzymatic digestion to generate a single cell suspension as described in the Materials and Methods and the tumor infiltrating CD4+ and CD8+ T cells were purified by MACS using CD4 and CD8 magnetic beads. (J, K) The isolated tumor infiltrating CD4+ and CD8+ T cells were then subjected to FACS for determination of the proportion of CD4+ IFN-γ+ and CD8+ IFN-γ+ T cells. The data shown here are mean ± standard deviation of three independent experiments, a value of p < 0.05 (* or τ ) was considered to be significant, whereas the FACS data and blots shown here are the best representative among three independent experiments.
Regulatory T cells abrogated Mw induced M2 to M1 transformation of TAM in vitro
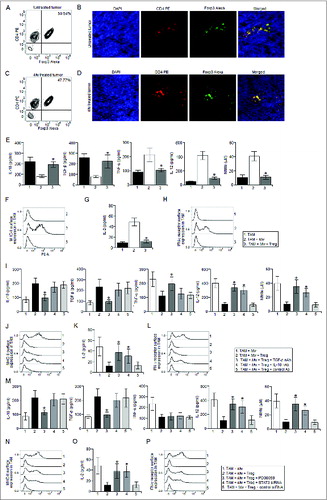
Regulatory T cells, in addition to their direct suppressive effect on T cells, may inhibit T cell responses indirectly by preventing the activation of antigen presenting cells.Citation28,29 Therefore, we examined regulatory T cell frequency within the tumor mass isolated from Mw treated and untreated mice. Surprisingly, we observed very high level of regulatory T cell frequency within the tumor isolated from both the Mw treated and untreated mice (). Therefore, we hypothesized that regulatory T cells might have abrogated the Mw induced reprogramming of TAM. Accordingly, co-culture of Mw activated TAM with regulatory T cells according to the physiological ratio (Fig. S2) found in Mw treated tumor completely abrogated Mw induced reprogramming of TAM (). Since, regulatory T cells utilize IL-10 and TGF-β for their suppressive modalities,Citation30 we examined whether IL-10 and TGF-β were involved in this case. We observed that blocking TGF-β and IL-10 significantly attenuated the suppressive action of regulatory T cells on Mw treated TAM compared to that of the control antibody treated sets (). Moreover, inhibition of ERK-1/2 MAPK or STAT3 activation nullified the suppressive effects of regulatory T cells on Mw activated TAM (). Therefore, these findings indicated that regulatory T cells suppressed Mw induced reprogramming of TAM via TGF-β and IL-10 dependent ERK-1/2 MAPK and STAT3 activation.
Figure 3. Regulatory T cells abrogated Mw induced reprogramming of TAM. The tumor from untreated and Mw treated mice were subjected to enzymatic digestion to generate a single cell suspension as described in the Materials and Methods and the tumor infiltrating CD4+ T cells were purified by MACS using CD4 magnetic bead. (A, C) The isolated tumor infiltrating CD4+ T cells were then subjected to FACS for determination of the proportion of CD4+ Foxp3+ regulatory T cells. (B, D) In a separate set of experiments, tumors were cryo-sectioned and subjected to immunofluorescence studies with CD4 PE and Foxp3 Alexa Fluor 647 conjugated antibodies for the detection of tumor infiltrating regulatory T cells and DAPI was used for nuclear staining. TAM from Mw treated tumor bearing mice were left untreated or restimulated with Mw (1:10 ratio to TAM) and co-cultured with regulatory T cells isolated from Mw treated tumor bearing mice in a 1:10 (regulatory T cell:TAM) ratio for 24 h. The culture medium was then replace with fresh medium and kept for another 24 h or 48 h. (E) The cell free supernatant was then collected and subjected to ELISA and Griess Method assay for detection of IL-10, TGF-β, TNF-α, IL-12 production and nitrite generation respectively. (See previous page). (F, H) In a separate set of experiments, TAM (105 cells) from Mw treated tumor bearing mice were left untreated or treated as mentioned above were subjected to FACS for detection of MHC-II or IFN-γ receptor surface expression. (G) In another set of experiments, TAM (105 cells) from Mw treated tumor bearing mice were left untreated or treated as mentioned above were subjected to MHC-II dependent antigen presentation assay as described in the Materials and Methods. In a separate experiment, TAM from Mw treated tumor bearing mice were restimulated with Mw and subjected to co-culture with Regulatory T cells (1:10 ratio) in presence of TGF-β neutralizing antibody(10 μg/mL), IL-10 neutralizing antibody or control antibody(10 μg/mL). The culture medium was then replace with fresh medium and kept for another 24 h or 48 h. (I) The cell free supernatant was then collected and subjected to ELISA and Griess Method assay for detection of IL-10, TGF-β, TNF-α, IL-12 production and nitrite generation respectively. (J, L, K) In a separate set of experiments, TAM (105 cells) from Mw treated tumor bearing mice were left untreated or treated as mentioned above were subjected to FACS for detection of MHC-II and IFN-γ receptor surface expression. In another set of experiments, TAM (105 cells) from Mw treated tumor bearing mice were left untreated or treated as mentioned above were subjected to MHC-II dependent antigen presentation assay. In another set of experiments, TAM from Mw treated tumor bearing mice were restimulated with Mw and treated with PD98059 (10 μM), STAT3 siRNA or control siRNA before co-culture with regulatory T cells (1:10 ratio). The culture medium was then replace with fresh medium and kept for another 24 h or 48 h. (M) The cell free supernatant was then collected and subjected to ELISA and Griess Method assay for detection of IL-10, TGF-β, TNF-α, IL-12 production and nitrite generation respectively. (N, P) In a separate set of experiments, TAM (105 cells) from Mw treated tumor bearing mice were left untreated or treated as mentioned above were subjected to FACS for detection of MHC-II and IFN-γ receptor surface expression. (O) In another set of experiments, TAM (105 cells) from Mw treated tumor bearing mice were left untreated or treated as mentioned above were subjected to MHC-II dependent antigen presentation assay. The immunofluorescence and FACS data shown here are the best representatives among three independent experiments. The data shown here are mean ± standard deviation of three independent experiments, a value of p < 0.05 (*) was considered to be significant.
Mw in combination with DTA-1 repolarized TAM toward M1 phenotype in vivo and restricted the progression advanced stage tumors
Next, we thought that reduction in regulatory T cell frequency within the tumor mass could restore the immunomodulatory potential of Mw in vivo. Therefore, we utilized an agonistic GITR antibody, DTA-1, to counteract the suppressive effects of regulatory T cells in vivo.Citation27 Interestingly, the combination therapy involving Mw and DTA-1 exhibited marked reduction in advanced stage solid tumor progression compared to that of the untreated or only DTA-1 treated tumor bearing mice. However, in accordance with other studies, mice receiving only DTA-1 treatment failed to restrict the progression of advanced stage solid tumor (). Moreover, TAM isolated from tumors receiving the combination therapy exhibited marked upregulation of IL-12, NO (), MHC-II dependent antigen presentation function (), MHC-II () and IFN-γ receptor surface expression () compared to that of the TAM from untreated or only DTA-1 treated tumors. Furthermore, TAM isolated from the tumor receiving the combination therapy induced significantly higher level of T cell proliferation (), IFN-γ () and IL-2 production () compared to that of the TAM isolated from untreated or only DTA-1 treated tumors. Accordingly, we observed significantly higher level of IFN-γ+ T cell frequency () within the tumor mass of mice receiving the combination therapy compared to that of the untreated tumor bearing mice. Whereas, we observed a moderate increase in intratumoral IFN-γ+ T cell frequency in only DTA-1treated tumor bearing mice compared to that of the untreated tumor bearing mice. Therefore, these findings suggested that the combination therapy involving Mw and DTA-1 reprogrammed TAM toward M1 phenotype in vivo to generate a host protective antitumor response.
Figure 4. The combination therapy involving Mw and DTA-1 restricted the progression of advanced stage tumors. (A) 105 B16F10 melanoma cells were injected subcutaneously into the right flank of female C57BL/6 mice and were left untreated or treated with only DTA-1 (1 mg/mouse) or Mw (108 cells/mouse) and DTA-1 (1 mg/mouse) on day 9 post-tumor challenge. The tumor volumes were monitored on every 2 d and the final tumor volume was determined at 21 d post-tumor challenge. The data shown here representative of three independent experiments with n = 4/ mice group. TAM (105 cells) isolated from untreated and only DTA-1 or Mw and DTA-1 treated mice were plated in a 96 well plate were left untreated or treated with LPS (100 ng/mL) for 4 h. (B) The cell free supernatant collected at 24 h was subjected to ELISA to detect the presence of IL-10, TGF-β, TNF-α, IL-12 whereas; the cell free supernatant collected at 48 h was subjected to Griess Method assay for the detection of nitrite generation. (C) In a separate set of experiments, TAM (105 cells) isolated from untreated and only DTA-1 or Mw and DTA-1 treated mice were left untreated or treated as mentioned above were subjected to MHC-II dependent antigen presentation assay as described in the Materials and Methods. (D, E) In another set of experiments, TAM (105 cells) isolated from untreated and only DTA-1 or Mw and DTA-1 treated mice were left untreated or treated as mentioned above were subjected to FACS for detection of MHC-II and IFN-γ receptor surface expression. (F) In a separate set of experiments, CD25– T cell isolated from both the untreated and only DTA-1 or Mw and DTA-1 treated tumor bearing mice were co-cultured with DC pre-activated with whole tumor lysate pulsed and TAM isolated from untreated and DTA-1 or Mw and DTA-1 treated tumor bearing mice were added to the culture at 1:1 ratio (DC:TAM) and T cell proliferation was determined. (G, H) The cell free supernatant was collected and subjected to ELISA for detection of IFN-γ and IL-2. In a separate experimental set, tumors from untreated and DTA-1 or Mw and DTA-1 treated mice were subjected to enzymatic digestion to generate a single cell suspension as described in the Materials and Methods and the tumor infiltrating CD4+ and CD8+ T cells were purified by MACS using CD4 and CD8 magnetic beads. (I–K) The isolated tumor infiltrating CD4+ and CD8+ T cells were then subjected to FACS for determination of the proportion of CD4+ IFN-γ+ and CD8+ IFN-γ+ T cells. The data shown here are mean ± standard deviation of three independent experiments, a value of p < 0.05 (*, τ or ι ) was considered to be significant, whereas the FACS data shown here are the best representative among three independent experiments.
DTA-1 induced reduction in regulatory T cell frequency failed to prevent Mw induced reprogramming of TAM toward a M1 phenotype in vitro
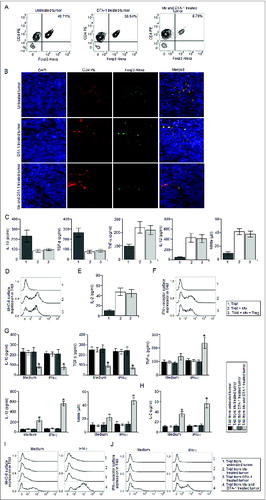
Next, we checked regulatory T cell frequency within the tumor mass of untreated mice, DTA-1treated mice and Mw and DTA-1 treated mice. Interestingly, we observed a very significant reduction in intratumoral regulatory T cell frequency in mice receiving combination therapy compared to that of the untreated tumor bearing mice (). Whereas, only DTA-1 treatment resulted in a moderate decrease in intratumoral regulatory T cell frequency compared to that of the untreated tumor bearing mice. Moreover, co-culture of Mw treated TAM with regulatory T cells with the physiological ratio (Fig. S3) found in the DTA-1 treated tumor failed to abrogate Mw induced reprogramming of TAM (). In addition, the IFN-γ responsiveness of TAM was found to be significantly higher in mice receiving the combination therapy compared to that of the untreated and only Mw or DTA-1 treated mice (). Therefore, these findings clearly indicated that although DTA-1 treatment reduced intratumoral regulatory T cell frequency, it failed to repolarize TAM in vivo as indicated by the abrogated IFN-γ responsiveness in TAM isolated from DTA-1 treated tumor. However, DTA-1 treatment reduced intratumoral frequency to such an extent where regulatory T cells failed to attenuate the Mw induced reprogramming of TAM toward a M1 phenotype and this was probably the reason for the success of the combination therapy involving Mw and DTA-1 against advanced stage solid tumors.
Figure 5. DTA-1 treatment restored Mw induced reprogramming of TAM inside advanced stage tumors. Tumors from untreated, DTA-1 or Mw and DTA-1 treated mice were subjected to enzymatic digestion to generate a single cell suspension as described in the Materials and Methods and the tumor infiltrating CD4+ T cells were purified by MACS using CD4 magnetic bead. (A) The isolated tumor infiltrating CD4+ T cells were then subjected to FACS for determination of the proportion of CD4+ Foxp3+ regulatory T cells. (B) In a separate set of experiments, tumors were cryo-sectioned and subjected to immunofluorescence studies with CD4 PE and Foxp3 Alexa Fluor 647 conjugated antibodies for the detection of tumor infiltrating regulatory T cells and DAPI was used for nuclear staining. TAM from DTA-1 treated tumor bearing mice were left untreated or stimulated with Mw and co-cultured with regulatory T cells isolated from DTA-1 treated tumor bearing mice in a 1:20 (regulatory T cell:TAM) ratio for 24 h. The culture medium was then replaced with fresh medium and kept for another 24 h or 48 h. (C) The cell free supernatant was then collected and subjected to ELISA and Griess Method assay for detection of IL-10, TGF-β, TNF-α, IL-12 production and nitrite generation respectively. (D, F) In a separate set of experiments, TAM (105 cells) from Mw treated tumor bearing mice were left untreated or treated as mentioned above were subjected to FACS for detection of MHC-II and IFN-γ receptor surface expression. (E) In another set of experiments, TAM (105 cells) from Mw treated tumor bearing mice were left untreated or treated as mentioned above were subjected to MHC-II dependent antigen presentation assay as described in the Materials and Methods. In another set of experiments, TAM (105 cells) isolated from untreated, only Mw treated, only DTA-1 treated or Mw and DTA-1 treated mice were stimulated with recombinant IFN-γ (50 ng/mL). (G) The cell free supernatant collected at 24 h was subjected to ELISA to detect the presence of IL-10, TGF-β, TNF-α, IL-12 whereas, the cell free supernatant collected at 48 h was subjected to Griess Method assay for the detection of nitrite generation. (I, J) In a separate set of experiments, TAM (105 cells) from Mw treated tumor bearing mice were left untreated or treated with recombinant IFN-γ (50 ng/mL) were subjected to FACS for detection of MHC-II and IFN-γ receptor surface expression. (H) In another set of experiments, TAM (105 cells) from Mw treated tumor bearing mice were left untreated or treated with recombinant IFN-γ (50 ng/mL) were subjected to MHC-II antigen presentation assay. The data shown here are mean ± standard deviation of three independent experiments, a value of p < 0.05 (*) was considered to be significant, whereas the immunofluorescence and FACS data shown here are the best representative among three independent experiments.
Discussion
In the present study, we have shown that Mw in combination with an agonistic GITR antibody (DTA-1) regress advanced stage B16F10 tumors. Previously, it was observed that Mw could provide protection against solid tumors via activation of IFN-γ+ T cells when given 3 d post-tumor challenge, however, it failed to do so when given 7 d post-tumor challenge.Citation25 The activation of T cells is intricately associated with the activation antigen presenting cells, therefore, we thought that TAM, being the most abundant APC at the tumor microenvironment,Citation10 could play a pivotal role in regulating the outcome of Mw mediated antitumor T cell responses in vivo.
Therefore, we first examined whether Mw could restore the M1 phenotype of TAM in vitro. Although, Mw restored the M1 phenotype of TAM in vitro, however; it failed to do so in vivo and thereby failed to restrict tumor growth. Therefore, we thought that some tumor microenvironment residing factors might have abrogated the immunomodulatory action of Mw on TAM in vivo. Among the possible factors, regulatory T cells might be a crucial candidate due to their suppressive action on APCs.Citation28,29 Accordingly, the regulatory T cell frequency was found to be very much augmented in Mw treated tumor and was very much similar to that of the untreated tumor. Moreover, co-culture of the regulatory T cells with Mw treated TAM according to their physiological frequency found in the tumor mass completely abrogated Mw induced reprogramming of TAM toward M1 phenotype in vitro. In addition, it was observed that regulatory T cells neutralized the immunomodulatory action of Mw via TGF-β and IL-10 dependent ERK-1/2 MAPK and STAT3 activation in TAM. Therefore, it was obvious that Mw treatment failed to reduce regulatory T cell accumulation within the tumor mass and the elevated regulatory T cells might have abrogated the Mw induced reprogramming of TAM to the M1 phenotype and that could be the possible reason why Mw failed to induce host-protective antitumor responses in vivo.
Next, we thought that Mw could activate host protective antitumor immune responses in conditions where regulatory T cell frequency was reduced; however, depletion of regulatory T cells might not be useful, since it could ultimately result in autoimmune condition. Therefore, we selected an agonistic GITR antibody (DTA-1) for the treatment purpose, because it was well known for its ability to induce relative reduction in regulatory T cell frequency by activating the IFN-γ+ T cells within the tumor.Citation32 Interestingly, the combination therapy involving Mw and DTA-1 prevented tumor growth even after 9 d of tumor challenge, whereas only DTA-1 treated mice failed to do so. Moreover, the combination therapy completely repolarized the TAM to a M1 phenotype, whereas TAM from only DTA-1 treated mice were found to retain their pro-tumoral and anti-inflammatory M2 phenotype. Moreover, regulatory T cell frequency was found to be slightly reduced in the tumor mass of DTA-1 treated mice, whereas DTA-1 and Mw treated mice exhibited marked reduction in regulatory T cell frequency within the tumor mass. Furthermore, co-culture of Mw treated TAM with regulatory T cells according to their physiological frequency found in the only DTA-1 treated tumor failed to attenuate Mw induced restoration of M1 phenotype in TAM. Although, only DTA-1 treatment failed to repolarize TAM and regress tumor growth, it reduced regulatory T cell frequency inside the tumor mass to such an extent where the regulatory T cells could no longer abrogate Mw induced reprogramming of TAM.
Although, DTA-1 treatment induced relatively higher number of IFN-γ+ T cells compared to the untreated tumor, it failed to restore IFN-γ responsiveness in TAM. Therefore, it was quite obvious that DTA-1 induced IFN-γ+ T cell activation was APC independent and the lack of APC activation in DTA-1 treated tumor bearing mice might be the reason why DTA-1 failed to restrict advanced stage tumor progression. Moreover, the IFN-γ responsiveness was found to be very much abrogated in DTA-1 treated mice compared to the mice receiving combination therapy. The abrogated IFN-γ responsiveness was found to be due to the lower IFN-γ receptor expression in TAM from DTA-1 treated mice compared to the mice receiving combination therapy. Therefore, the combination therapy involving Mw and DTA-1 complemented each other's function in vivo for the generation of an efficient host protective antitumor immune response to regress advanced stage solid tumors and this immunotherapeutic approach could be utilized for the treatment of other advanced stage murine as well as human tumors.
Materials and Methods
Reagents and chemicals
RPMI-1640 medium (R8758), penicillin and streptomycin (P4333), PD098059 (P215), SB203580 (S8307), LPS (L2654), collagenase (S5138) and TRI Reagent (15596018) were from Sigma. Fetal calf serum (16140071) was purchased from Gibco BRL. ELISA Assay Kit (Quantikine M) for mouse IL-12 (555256), IL-10 (555252), TNF-α, IFN-γ, IL-2 (555148), CD4 PE (553730), CD8 PerCP (553036) and Foxp3 Alexa Fluor 647 (560401) conjugated antibodies and IMag Anti-Mouse CD4 (551539), CD8 (551516) and CD25 (553070) Particles, DTA-1 (558213) antibody and cytofix / cytoperm reagent (554714) were obtained from BD Biosciences. Mouse TGF-β ELISA kit (MB100B) and TGF-β neutralizing antibody (MAB240), IL-10 neutralizing antibody (MAB417), control IgG (MAB002) and recombinant IFN-γ (485MI100) were obtained from R&D Systems. NF-κB p65 (sc-372), IFN-γ receptor (sc-74449), MHC-II (sc-32247) phosphorylated p38 (sc-7973) and p38 (sc-7972), phospho ERK-1/2 (sc-7383), ERK-1/2 (sc-135900), phospho STAT3 (sc-21876) and STAT3 (sc-482) antibodies and NF-κB p65 (sc-29411), STAT3 (sc-29494) small interfering RNA (siRNA) and control siRNA (sc-35449) were obtained from Santa Cruz Biotechnology.
Mice
Six- to eight-week-old female C57BL/6 mice were purchased from National Institute of Nutrition (Hyderabad, India). These mice were housed in specific pathogen-free conditions and all experiments were conducted in compliance with Institutional Animal Ethics Committee regulations.
Tumor induction and treatment
For tumor development, mice were inoculated subcutaneously with 10Citation5 B16F10 melanoma cells (purchased from National Centre for Cell Sciences, Pune, India) as described elsewhere.Citation31 Tumor size was measured bi-dimensionally with calipers every 2 d, and tumor volume was calculated using the formula: (a × b2)/2, where a is the largest diameter and b is its perpendicular. In general, mice were euthanized 21 d after tumors were surgically excised.Citation25 Mice showing discomfort or difficulty in walking were sacrificed irrespective of the tumor size. In some experiments, tumor bearing mice were treated with PBS, Mw (108 cells/ mice), DTA-1 (1 mg/ mice)Citation32 or a single dose of DTA-1 and Mw at 9 d post-tumor challenge respectively.
Isolation of tumor associated macrophages and peritoneal macrophages
Tumor associated macrophages were isolated from B16F10 tumors as described elsewhere.Citation33,34 Peritoneal macrophages were isolated on the same day under similar treatment conditions from control C57BL/6 mice as described elsewhere.Citation35
Isolation of tumor infiltrating CD4+, CD8+ T cells, and regulatory T cells
For isolation of tumor infiltrating CD4+ and CD8+ T cells, tumors were subjected to enzymatic digestion to generate a single cell suspension and the CD4+ and CD8+ T cells were positively selected from using BD IMag Anti-Mouse CD4 or CD8 Particles. Flow cytometric analysis confirmed the purity of cells to be > 95%. For isolation of tumor infiltrating regulatory T cells, CD4+ T cells isolated from tumors as mentioned above were positively selected from using BD IMag Anti-Mouse CD25 Particles.
Cell culture
TAM and peritoneal macrophages were cultured in complete RPMI-1640 medium containing 10% FCS (v/v), 2 mmol/L glutamine and 100 units/mL penicillin and streptomycin. TAM or control macrophages were stimulated with LPS (100 ng/mL) or Mw (107 cells/10Citation6 TAM or control macrophages) (Fig. S1) in complete RPMI-1640 medium. For different treatments, PD98059 (a specific pharmacological inhibitor of ERK-1/2 MAPK) (10 μM) or SB203580 (a specific pharmacological inhibitor of p38MAPK) (1 μM), NF-κB p65 siRNA, STAT3 siRNA or control siRNA were used.
Flow cytometric staining
Flow cytometric analysis for cell-surface phenotypic markers was performed after labeling of 1 × 10⁶ cells with different fluorescently labeled anti-mouse Abs and their corresponding isotype controls as per the manufacturer's recommendations. Intracellular IFN-γ, Foxp3 was stained with anti-mouse fluorescence-labeled Abs using Cytofix/Cytoperm reagents per the manufacturer's instructions. For all immunofluorescence analyses, cells were fixed with 1% paraformaldehyde in PBS and screening was performed using a FACS VERSE (Becton Dickinson) and suitable negative isotypecontrols were used to establish background staining profiles.
Western blot
Cell lysates and nuclear extract were prepared as described elsewhere.Citation36,24 Equal amounts of protein (40 μg) were subjected to 10% sodium dodecyl sulfate polyacrylamide gel electrophoresis, and were subsequently transferred to a nitrocellulose membrane. The membrane was blocked overnight with 3% bovine serum albumin in Tris-saline buffer (pH 7.5), and immunoblotting was performed to detect NF-κB, phosphorylated or dephosphorylated forms of p38MAPK, ERK-1/2 and STAT3 as described elsewhere.Citation37
Antigen presentation assay
TAM or control peritoneal macrophages were incubated with anti-Ova T-cell hybridoma 13.8 (a kind gift from Prof. Syamal Roy, IICB, Kolkata, India), with for 16–20 h at a fixed ratio of 1:10 APC:T cell in complete RPMI 1640 medium. The culture supernatants were analyzed for the presence of IL-2 by ELISA as described elsewhere.Citation38
T cell immunosuppression assay
Dendritic cells (DCs) were generated from bone marrow (BM) precursors isolated from the tibias/femurs of C57BL/6 mice, as previously described.Citation39 At days 7–10 of culture, BM derived DCs were stimulated to mature by addition of 200 ng/mL LPS (Sigma-Aldrich) for 48 h.40 DCs were loaded with freeze-thawed whole tumor lysate and were used to activate tumor infiltrating CD25− T cells (105 cells/mL). Tumor associated macrophages were then added to the culture at 0:1 or 1:1 ratio to tumor antigen pulsed DC and T cell proliferation, IFN-γ and IL-2 production were determined as described elsewhere.Citation41
Enzyme-linked immunosorbent assay (ELISA)
The cell free supernatant from control peritoneal macrophages and TAM were assayed for mouse IL-12, IL-10, TNF-α, IFN-γ, TGF-β and IL-2 cytokines with use of the sandwich ELISA kit. The assay was performed according to the manufacturer's instructions.
Nitrite generation
Nitrite level in culture was measured using the Nitric Oxide (NO) Colorimetric Assay kit (Boehringer Mannheim Biochemicals).Citation42 Cell-free supernatants were collected from different experimental sets and nitrite levels were estimated in accordance with the manufacturer's instructions. Data were expressed in micromoles of nitrite.
Fluorescence imaging of tumor sections
Tumor tissue samples were prepared and 6-μm sections were stained as previously reportedCitation43 and CD4 PE and Foxp3 Alexa conjugated antibodies were used for determination of tumor infiltrating regulatory T cells. Imaging was performed under fluorescence microscope (Leica DM4000B; Leica, Wetzlar, Germany).
Statistics
All reported results represent the mean ± SD of data obtained of three independent experiments. For in vivo studies, we repeated the experiments three times with n = 4 per mice group. Statistical significance was established by one way ANOVA using GraphPad prism software, with differences between groups attaining a value of p < 0.05 (* , τ or ι) was considered to be significant.
Ethics statement
This study was carried out in strict accordance with the recommendations in the Guide for the Care and Use of Laboratory Animals of the National Institutes of Health. All experimental animal protocols received prior approval from the Institutional Animal Ethical Committee (Bose Institute, Registration Number: 95/99/CPCSEA).
Disclosure of Potential Conflicts of Interest
No potential conflicts of interest were disclosed.
Supplemental Materials
Supplemental data for this article can be accessed on the publisher's website.
995559_Supplementary_Materials.zip
Download Zip (141.9 KB)995559_Supplementary_Materials.zip
Download Zip (147.2 KB)Acknowledgments
We are grateful to the Director, Bose Institute (Kolkata, India) for his continuous encouragement. We thank Mr. Prabal Gupta for his technical assistance.
Funding
The work was supported by the Council of Scientific and Industrial Research (CSIR), India (Grant No: 09/015(0381)/2009-EMR-I).
References
- Bahirwani R, Reddy KR. Drug-induced liver injury due to cancer chemotherapeutic agents. Semin Liver Dis 2014; 34:162-71; PMID:24879981; http://dx.doi.org/10.1055/s-0034-1375957
- Shaikh AY, Shih JA. Chemotherapy-induced cardiotoxicity. Curr Heart Fail Rep 2012; 9:117-27; PMID:22382639; http://dx.doi.org/10.1007/s11897-012-0083-y
- François S, Bensidhoum M, Mouiseddine M, Mazurier C, Allenet B, Semont A, Frick J, Saché A, Bouchet S, Thierry D et al. Local irradiation not only induces homing of human mesenchymal stem cells at exposed sites but promotes their widespread engraftment to multiple organs: a study of their quantitative distribution after irradiation damage. Stem Cells 2006; 24:1020-9; PMID:16339642; http://dx.doi.org/10.1634/stemcells.2005-0260
- Bacac M, Stamenkovic I. Metastatic cancer cell. Annu Rev Pathol 2008; 3:221-47; PMID:18233952; http://dx.doi.org/10.1146/annurev.pathmechdis.3.121806.151523
- Lizée G, Overwijk WW, Radvanyi L, Gao J, Sharma P, Hwu P. Harnessing the power of the immune system to target cancer. Annu Rev Med 2013; 64:71-90; PMID:23092383; http://dx.doi.org/10.1146/annurev-med-112311-083918
- Quail DF, Joyce JA. Microenvironmental regulation of tumor progression and metastasis. Nat Med 2013; 19:1423-37; PMID:24202395; http://dx.doi.org/10.1038/nm.3394
- Flavell RA, Sanjabi S, Wrzesinski SH, Licona-Limón P. The polarization of immune cells in the tumour environment by TGFbeta. Nat Rev Immunol 2010; 10:554-67; PMID:20616810; http://dx.doi.org/10.1038/nri2808
- Pollard JW. Tumour-educated macrophages promote tumour progression and metastasis. Nat Rev Cancer 2004; 4:71-8; PMID:14708027; http://dx.doi.org/10.1038/nrc1256
- Mougiakakos D, Choudhury A, Lladser A, Kiessling R, Johansson CC. Regulatory T cells in cancer. Adv Cancer Res 2010; 107:57-117; PMID:20399961; http://dx.doi.org/10.1016/S0065-230X(10)07003-X
- Takaishi K, Komohara Y, Tashiro H, Ohtake H, Nakagawa T, Katabuchi H, Takeya M. Involvement of M2-polarized macrophages in the ascites from advanced epithelial ovarian carcinoma in tumor progression via Stat3 activation. Cancer Sci 2010; 101:2128-36; PMID:20860602; http://dx.doi.org/10.1111/j.1349-7006.2010.01652.x
- Qian BZ, Li J, Zhang H, Kitamura T, Zhang J, Campion LR, Kaiser EA, Snyder LA, Pollard JW. CCL2 recruits inflammatory monocytes to facilitate breast-tumourmetastasis. Nature 2011; 475:222-5; PMID:21654748; http://dx.doi.org/10.1038/nature10138
- Mantovani A, Sozzani S, Locati M, Allavena P, Sica A. Macrophage polarization: tumor-associated macrophages as a paradigm for polarized M2 mononuclear phagocytes. Trends Immunol 2002; 23:549-55; PMID:12401408; http://dx.doi.org/10.1016/S1471-4906(02)02302-5
- Sica A, Saccani A, Bottazzi B, Polentarutti N, Vecchi A, van Damme J, Mantovani A. Autocrine production of IL-10 mediates defective IL-12 production and NF-kappa B activation in tumor-associated macrophages. J Immunol 2000; 164:762-67; PMID:10623821; http://dx.doi.org/10.4049/jimmunol.164.2.762
- Lamagna C, Aurrand-Lions M, Imhof BA. Dual role of macrophages in tumor growth and angiogenesis. J Leukoc Biol 2006; 80:705-13; PMID:16864600; http://dx.doi.org/10.1189/jlb.1105656
- Schoppmann SF, Birner P, Stöckl J, Kalt R, Ullrich R, Caucig C, Kriehuber E, Nagy K, Alitalo K, Kerjaschki D. Tumor-associated macrophages express lymphatic endothelial growth factors and are related to peritumoral lymphangiogenesis. Am J Pathol 2002; 161:947-56; PMID:12213723; http://dx.doi.org/10.1016/S0002-9440(10)64255-1
- Jinushi M, Chiba S, Yoshiyama H, Masutomi K, Kinoshita I, Dosaka-Akita H, Yagita H, Takaoka A, Tahara H. Tumor-associated macrophages regulate tumorigenicity and anticancer drug responses of cancer stem/initiating cells. Proc Natl Acad Sci USA 2011; 108:12425-30; PMID:21746895; http://dx.doi.org/10.1073/pnas.1106645108
- Su S, Liu Q, Chen J, Chen J, Chen F, He C, Huang D, Wu W, Lin L, Huang W et al. A positive feedback loop between mesenchymal-like cancer cells and macrophages is essential to breast cancer metastasis. Cancer Cell 2014; 25:605-20; PMID:24823638; http://dx.doi.org/10.1016/j.ccr.2014.03.021
- Lepique AP, Daghastanli KR, Cuccovia IM, Villa LL. HPV16 tumor associated macrophages suppress antitumor T cell responses. Clin Cancer Res 2009; 15:4391-400; PMID:19549768; http://dx.doi.org/10.1158/1078-0432.CCR-09-0489
- Liu J, Zhang N, Li Q, Zhang W, Ke F, Leng Q, Wang H, Chen J, Wang H. Tumor-associated macrophages recruit CCR6+ regulatory T cells and promote the development of colorectal cancer via enhancing CCL20 production in mice. PLOS ONE 2011; 6: e19495; PMID:21559338; http://dx.doi.org/10.1371/journal.pone.0019495
- Li X, Kostareli E, Suffner J, Garbi N, Hämmerling GJ. Efficient Regulatory T cell depletion induces T-cell infiltration and rejection of large tumors. Eur J Immunol 2010; 40:3325-35; PMID:21072887; http://dx.doi.org/10.1002/eji.201041093
- Schlecker E, Stojanovic A, Eisen C, Quack C, Falk CS, Umansky V, Cerwenka A. Tumor-infiltrating monocytic myeloid-derived suppressor cells mediate CCR5-dependent recruitment of regulatory T cells favoring tumor growth. J Immunol 2012; 189:5602-11; PMID:23152559; http://dx.doi.org/10.4049/jimmunol.1201018
- Facciabene A, Motz GT, Coukos G. T-regulatory cells: key players in tumor immune escape and angiogenesis. Cancer Res 2012; 72:2162-71; PMID:22549946; http://dx.doi.org/10.1158/0008-5472.CAN-11-3687
- Adhikari A, Gupta G, Majumder S, Banerjee S, Bhattacharjee S, Bhattacharya P, Kumari S, Haldar S, Majumdar SB, Saha B et al. Mycobacterium indicus pranii (Mw) re-establishes host protective immune response in Leishmania donovani infected macrophages: critical role of IL-12. PLOS ONE 2012; 7: e40265
- Adhikari A, Majumder S, Banerjee S, Gupta G, Bhattacharya P, Majumdar SB, Saha B, Majumdar S. Mycobacterium indicus pranii (Mw) mediated protection against visceral leishmaniasis: involvement of TLR4 signalling. J Antimicrob Chemother 2012; 67:2892-902; PMID:22879460
- Rakshit S, Ponnusamy M, Papanna S, Saha B, Ahmed A, Nandi D. Immunotherapeutic efficacy of Mycobacterium indicus pranii in eliciting anti-tumor T cell responses: critical roles of IFN-γ. Int J Cancer 2012; 130:865-75; PMID:21455983; http://dx.doi.org/10.1002/ijc.26099
- Saccani A, Schioppa T, Porta C, Biswas SK, Nebuloni M, Vago L, Bottazzi B, Colombo MP, Mantovani A, Sica A. p50 nuclear factor-kappa B overexpression in tumor-associated macrophages inhibits M1 inflammatory responses and antitumorresistance. Cancer Res 2006; 66:11432-40; PMID:17145890; http://dx.doi.org/10.1158/0008-5472.CAN-06-1867
- Soki FN, Koh AJ, Jones JD, Kim YW, Dai J, Keller ET, Pienta KJ, Atabai K, Roca H, McCauley LK. Polarization of prostate cancer associated macrophages is inducedby milk-fat globule-EGF factor 8 (MFG-E8) mediated efferocytosis. J BiolChem 2014; 289:24560-72 [Epub ahead of print]; PMID: 25006249; http://dx.doi.org/10.1074/jbc.M114.571620
- Cederbom L, Hall H, Ivars F. CD4+CD25+ regulatory T cells down-regulateco-stimulatory molecules on antigen-presenting cells. Eur J Immunol 2000; 30:1538-43; PMID:10898488; http://dx.doi.org/10.1002/1521-4141(200006)30:6%3c1538::AID-IMMU1538%3e3.0.CO;2-X
- André S, Tough DF, Lacroix-Desmazes S, Kaveri SV, Bayry J. Surveillance of antigen-presenting cells by CD4+ CD25+ regulatory T cells in autoimmunity: immunopathogenesis and therapeutic implications. Am J Pathol 2009; 174:1575-87; PMID:19349365; http://dx.doi.org/10.2353/ajpath.2009.080987
- Taylor A, Verhagen J, Blaser K, Akdis M, Akdis CA. Mechanisms of immunesuppression by interleukin-10 and transforming growth factor-beta: the role of T regulatory cells. Immunology 2006; 117:433-42; PMID:16556256; http://dx.doi.org/10.1111/j.1365-2567.2006.02321.x
- Kortylewski M, Xin H, Kujawski M, Lee H, Liu Y, Harris T, Drake C, Pardoll D, Yu H. Regulation of the IL-23 and IL-12 balance by Stat3 signaling in the tumor microenvironment. Cancer Cell 2009; 15:114-23; PMID:19185846; http://dx.doi.org/10.1016/j.ccr.2008.12.018
- Turk MJ, Guevara-Patiño JA, Rizzuto GA, Engelhorn ME, Sakaguchi S, Houghton AN. Concomitant tumor immunity to a poorly immunogenic melanoma is prevented by regulatory T cells. J Exp Med 2004; 200:771-82; PMID:15381730; http://dx.doi.org/10.1084/jem.20041130
- Duff MD, Mestre J, Maddali S, Yan ZP, Stapleton P, Daly JM. Analysis of gene expression in the tumor-associated macrophage. J Surg Res 2007; 142:119-28; PMID:17597158; http://dx.doi.org/10.1016/j.jss.2006.12.542
- Banerjee S, Halder K, Bose A, Bhattacharya P, Gupta G, Karmahapatra S, Das S, Chaudhuri S, Bhattacharyya Majumdar S, Majumdar S. TLR signaling-mediated differential histone modification at IL-10 and IL-12 promoter region leads to functional impairments in tumor-associated macrophages. Carcinogenesis 2011; 32:1789-97; PMID:21926109; http://dx.doi.org/10.1093/carcin/bgr208
- Fahey TJ, Tracey KJ, Tekamp-Olson P, Cousens LS, Jones WG, Shire GT, Cerami A, Sherry B. Macrophage inflammatory protein 1 modulates macrophage function. J Immunol 1992; 148:2764-9; PMID:1573267
- Majumdar S, Kane LH, Rossi MW, Volpp BD, Nauseef WM, Korchak HM. Protein kinase C isotypes and signal-transduction in human neutrophils: selective substrate specificity of calcium-dependent beta-PKC and novel calcium-independent nPKC. Biochim Biophys Acta 1993; 1176:276-86; PMID:8471629; http://dx.doi.org/10.1016/0167-4889(93)90056-U
- Towbin H, Staehelin T, Gordon J. Electrophoretic transfer of proteins from polyacrylamide gels to nitrocellulose sheets: procedure and some applications. Proc Natl Acad Sci USA 1979; 76:4350-4; PMID:388439
- Ghosh J, Das S, Guha R, Ghosh D, Naskar K, Das A, Roy S. Hyperlipidemia offers protection against Leishmania donovani infection: role of membrane cholesterol. J Lipid Res 2012; 53:2560-72; PMID:23060454; http://dx.doi.org/10.1194/jlr.M026914
- Bose A, Taylor JL, Alber S, Watkins SC, Garcia JA, Rini BI, Ko JS, Cohen PA, Finke JH, Storkus WJ. Sunitinib facilitates the activation and recruitment of therapeutic anti-tumor immunity in concert with specific vaccination. Int J Cancer 2011; 129:2158-70; PMID:21170961; http://dx.doi.org/10.1002/ijc.25863
- Bose A, Barik S, Banerjee S, Ghosh T, Mallick A, Bhattacharyya Majumdar S, Goswami KK, Bhuniya A, Banerjee S, Baral R et al. Tumor-derived vascular pericytes anergize Th cells. J Immunol 2013; 191:971-81; PMID:23785117; http://dx.doi.org/10.4049/jimmunol.1300280
- Kryczek I, Zou L, Rodriguez P, Zhu G, Wei S, Mottram P, Brumlik M, Cheng P, Curiel T, Myers L et al. B7-H4 expression identifies a novel suppressive macrophage population in human ovarian carcinoma. J Exp Med 2006; 203:871-81; PMID:16606666; http://dx.doi.org/10.1084/jem.20050930
- Green LC, Wagner DA, Glogowski J, Skipper PL, Wishnok JS, Tannenbaum SR. Analysis of nitrate, nitrite, and [15N] nitrate in biological fluids. Anal Biochem 1982; 126:131-8; PMID:7181105; http://dx.doi.org/10.1016/0003-2697(82)90118-X
- Zhao X, Bose A, Komita H, Taylor JL, Kawabe M, Chi N, Spokas L, Lowe DB, Goldbach C, Alber S. Intratumoral IL-12 gene therapy results in the crosspriming of Tc1 cells reactive against tumor-associated stromal antigens. Mol. Ther 2011; 19:805-14; PMID:21189473; http://dx.doi.org/10.1038/mt.2010.295