
Abstract
CD4+ type 1 T regulatory (Tr1) cells have a crucial role in inducing tolerance. Immune regulation by these cells is mainly mediated through the secretion of high amounts of IL-10. Several studies have suggested that this regulatory population may be involved in tumor-mediated immune-suppression. However, direct evidence of a role for Tr1 cells in human solid tumors is lacking. Using ex vivo isolated cells from individuals with hepatocellular carcinoma (HCC; n = 39) or liver metastases from colorectal cancer (LM-CRC; n = 60) we identify a CD4+FoxP3−IL-13−IL-10+ T cell population in tumors of individuals with primary or secondary liver cancer that is characterized as Tr1 cells by the expression of CD49b and the lymphocyte activation gene 3 (LAG-3) and strong suppression activity of T cell responses in an IL-10 dependent manner. Importantly, the presence of tumor-infiltrating Tr1 cells is correlated with tumor infiltration of plasmacytoid dendritic cells (pDCs). pDCs exposed to tumor-derived factors enhance IL-10 production by Tr1 cells through up-regulation of the inducible co-stimulatory ligand (ICOS-L). These findings suggest a role for pDCs and ICOS-L in promoting intra-tumoral immunosuppression by Tr1 cells in human liver cancer, which may foster tumor progression and which might interfere with attempts of immunotherapeutic intervention.
Introduction
The two most common types of cancer affecting the liver are HCC and colorectal cancer liver metastasis.Citation1,2 For the majority of patients, curative treatments are not available and alternative treatments like immunotherapy have so far shown limited efficacy.Citation3,4 One of the main obstacles for immunotherapy is the immunosuppressive environment within tumors.Citation5,6 In support of this, we recently described the accumulation of CD4+FoxP3+ regulatory T cells (Tregs) that are potent suppressors of antitumor immunity at the tumor site of patients with liver cancer.Citation7,8 However, other types of inhibitory T cells may also be involved in local immunosuppression inside the tumor.
Tr1 cells were initially described in individuals who developed long-term tolerance after allogenic transplantation.Citation9 Since then Tr1 cells have proven to be important in promoting and maintaining tolerance in autoimmunity, allergy and transplantation.Citation10 There is experimental evidence suggesting a putative role for Tr1 cells in tumor escape from immune surveillance.Citation11,12 However, the absence of a defined cell surface signature and the reliance on a cytokine profile to distinguish Tr1 cells from other T cell subsets complicated their identification and study.Citation9 It was shown that exposure of dendritic cells to tumor-derived factors favors the induction of Tr1-like cells from naive CD4+ T cells.Citation13 Additionally, tumor-infiltrating lymphocytes (TILs) of patients with head and neck squamous cell carcinoma were shown to contain more Tr1 precursors than peripheral blood.Citation14 These findings suggest that this regulatory T cell population could be involved in tumor-mediated immune-suppression. However, direct evidence for the presence of Tr1 cells and their role in solid tumor development remained elusive. Now, using recently described surface markers for the identification of Tr1 cells,Citation15 we report that TILs in patients with liver cancer contain a subset of suppressive CD4+Foxp3− T cells with the phenotypic and functional characteristics of Tr1 cells. In addition, we provide evidence suggesting that intra-tumoral immunosuppression by Tr1 cells is promoted by tumor-infiltrating pDCs.
Results
IL-10-producing CD4+Foxp3− T cells accumulate in human liver tumors
In order to characterize the CD4+ T cell subsets present in liver tumors we compared pairwise the cytokine profile of CD4+ TILs isolated from individuals with HCC or liver metastasis from CRC (LM-CRC) to the cytokines produced by CD4+ T cells from the tumor-free area of the liver (TFL) and peripheral blood ( Fig. S1). Freshly isolated single cell suspensions were activated with PMA and Ionomycin in the presence of protein transporter inhibitors and analyzed by flow cytometry. Compared to TFL and blood, CD4+ TILs contained significantly higher frequencies of IL-10-producing cells in both groups of patients (). In contrast, the frequencies of IFNγ, TNFα and IL-13 producing CD4+ T cells were similar in TFL and tumors.
Figure 1. Accumulation of IL-10-producing CD4+FoxP3− T cells in liver tumors. PBMCs or MNCs isolated from tissues of HCC (n = 8–9) and LM-CRC (n = 5–14) patients were stimulated in vitro for 5 h with PMA/Ionomycin in the presence of protein transport inhibitors. IFNγ, TNFα, IL-13 and IL-10 were measured by intracellular staining by flow cytometry. (A) The percentages of cytokine-producing cells among total CD3+CD4+ T cells in blood, TFL and tumor. (B) IL-13 expression in viable tumor-derived CD3+CD4+IL-10+ T cells of HCC and LM-CRC patients stimulated with PMA/Ionomycin. FoxP3 and IL-10 expression in CD3+CD4+ T cells isolated from HCC (C) or LM-CRC tumors (D). (E) Frequencies of CD4+CD3+IL-13−FoxP3−IL-10+ T cells among CD4+ T cells. Red dots correspond to HCC and blue open dots are for LM-CRC (displayed as LMC in graphs). Values are means ± SEM, *p < 0.05, **p < 0.01, ***p< 0.001.
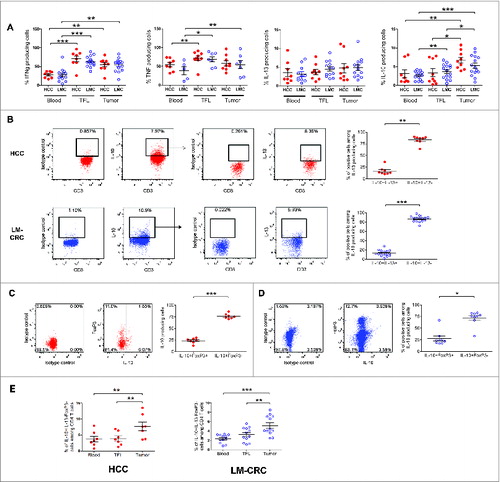
To further characterize these IL-10-producing CD4+ T cells, we analyzed their expression of IL-13 and FoxP3, and we observed that the majority of IL-10+ cells did not produce IL-13 nor expressed FoxP3 (). These cells were also negative for IL-4 (Fig. S1B). Therefore, only a minor proportion of tumor-infiltrating IL-10-producing CD4+ T cells correspond to FoxP3+ Tregs or Th2 cells. Instead, the large majority of IL-10-producing CD4+ T cells are FoxP3-negative and IL-13-negative, and these cells are enriched at the tumor site (). Moreover, an important proportion of these cells produced IFNγ without significant differences between blood, TFL and tumor (Fig. S1C).
Tumor-infiltrating CD4+FoxP3−IL-10+ T cells are potent suppressors of T cell function in an IL-10 dependent mechanism
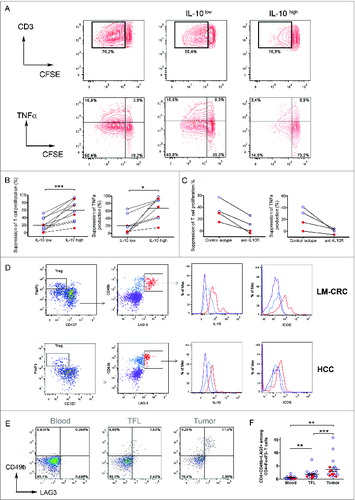
To investigate the functional properties of tumor-infiltrating CD4+FoxP3−IL-13-IL-4-IL-10+ cells, we isolated CD4+CD25- T cells, which are FoxP3− (Fig. S2A), from TILs and activated them with antibodies to CD3 and CD46 Citation16 or ICOS,Citation17 two co-stimulatory molecules that have been described to stimulate IL-10 production (Fig. S2B). Importantly, we activated these cells for only 24–48 h to prevent de novo generation of IL-10-producing cells from naive T cells. Similar to what we had observed upon short-term stimulation with PMA and Ionomycin, this stimulation also revealed higher proportions of IL-10-producing CD4+ cells in tumor tissue than in TFL or blood, (Figs. S2C, D). After activation IL-10+ cells were enriched by magnetic sorting (Fig. S3). We investigated the immunosuppressive potential of tumor-infiltrating IL-10-producing CD4+CD25- T cells by assessing their capacity to suppress T-cell proliferation and cytokine production in vitro (). CFSE-labeled PBMCs from healthy donors were stimulated with PHA and co-cultured in the presence of the IL-10+ enriched fraction (IL-10high) or the remaining fraction (IL-10low). Notably, both cell fractions suppressed proliferation and cytokine production of responder CD3+ T cells (), but the degree of suppression differed considerably. Whereas the IL-10low fraction suppressed moderately (20.4 ± 5.5 %; mean ± SE), the IL-10high fraction strongly suppressed T cell proliferation (60.2 ± 9.2 %, p = 0.005). No difference in suppression between cells stimulated with CD46 or anti-ICOS antibodies was observed (Fig. S3B). Similar findings were observed in the setting of CMV-specific CD4+ T cell responses (Fig. S4). To investigate whether the suppression was mediated by IL-10, we administered a neutralizing anti-IL-10R antibody to the co-cultures. As expected, suppression by the high IL-10 producing CD4+ T cells was prevented when IL-10R was blocked, in all patients tested (). Thus, these data show that liver tumors are infiltrated by IL-10-producing CD4+FoxP3− T cells which are potent suppressors of T cell responses in an IL-10 dependent manner. The limited suppression observed when the IL-10low fraction was added to the T-cell culture is likely a consequence of IL-10-producing cells remaining in this fraction after enrichment of the IL-10high fraction by magnetic sorting (Fig. S5A), and could also be blocked by neutralizing anti-IL-10R antibodies (data not shown). In support of this explanation, there is a positive correlation (p = 0.023) between the frequencies of IL-10+ cells present in the IL-10 high or low fractions obtained after magnetic sorting and their degree of T cell suppression observed in the co-cultures (Fig. S5B).
Figure 2. (See previous page). Tumor-infiltrating CD4+FoxP3−IL-10+ T cells are potent suppressors of T cell function and their phenotype corresponds to Tr1 cells. Tumor-infiltrating CD4+CD25− T cells were activated with anti-CD3/CD46 or anti-CD3/ICOS antibodies for 24–48 h, then stained for IL-10 and magnetically sorted into IL-10low and IL-10high fractions, which were both co-cultured at a 1:10 ratio with CFSE-labeled PBMCs from healthy donors stimulated with phytohemagglutinin (PHA) for 5 d (A) T cell proliferation and TNFα production measured by flow cytometry in PHA-stimulated PBMCs cultured alone or in the presence of IL-10low or IL-10high fractions of tumor infiltrating CD4+CD25− T cells. (B) Collective analysis of the percentages of suppression of T cell proliferation and TNFα production from eight patients. (C) Effect of blocking IL-10R on the suppressive capacity of CD4+IL-10high cells. Cells were cultured as described above in the presence of 30 μg/mL of neutralizing anti-IL-10R antibody or an irrelevant isotype control antibody. (D) Expression of CD49b and LAG-3 on tumor-infiltrating CD4+ T cells activated with antibodies to CD3 and ICOS for 24 h. Cells were gated on viable CD3+CD4+ T cells and FoxP3+CD127− Tregs were excluded from the analysis. Histograms show the expression of IL-10 and ICOS in different populations based on the expression of CD49b and LAG-3. (E) CD49b and LAG-3 expression in blood, TFL and TILs isolated from a representative patient with HCC. Cells were gated on viable CD3+CD4+FoxP3− T cells. (F) Collective percentages of CD49b+LAG-3+ cells within CD4+Foxp3− T cells in 21 patients analyzed (HCC n = 8 and LM-CRC n = 13). HCC (red dots) and LM-CRC (blue open dots).
Tumor-infiltrating CD4+FoxP3−IL-10+ T cells display phenotypic characteristics corresponding to Tr1 cells
A recent study has identified that CD49b and LAG-3 are stably and selectively co-expressed on Tr1 cells.Citation15 Because Tr1 cells are functionally characterized by the production of high levels of IL-10 and T-cell suppressive capacity, we examined the expression of these markers on the tumor-infiltrating IL-10+CD4+ T cells that we described above. Notably, the liver tumor-infiltrating CD4+FoxP3− T cells that produced the highest amounts of IL-10 co-expressed CD49b and Lag-3 () and we observed that CD4+FoxP3−CD49b+LAG-3+ T cells were selectively enriched in the tumor bed in both types of liver tumors (). Therefore, taken together we conclude that the majority of the CD4+FoxP3−IL-10-producing cells infiltrating liver tumors correspond to Tr1 cells and that they are strongly immunosuppressive in an IL-10-dependent manner.
Tumor-exposed pDCs promote immune suppression through activation of Tr1 cells
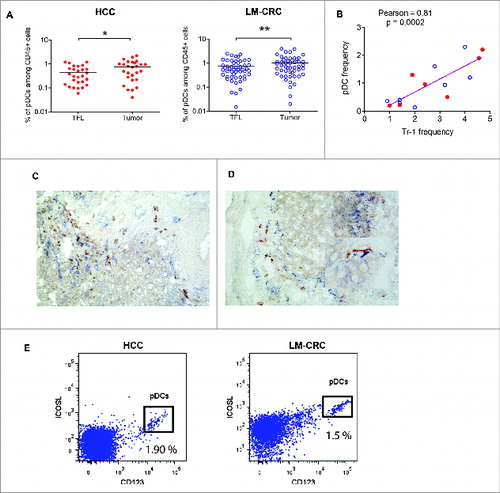
Given that pDCs have been reported to prime CD4+IL-10-producing T regulatory cells through ICOSL,Citation18 and in ovarian Citation19,20 and breast cancer Citation21 expand CD4+FoxP3+ Tregs, as well as stimulate production of IL-10 in these cells, we explored tumor infiltration of pDCs in our patients. We observed that pDCs infiltrate liver tumors ( Fig. S6A), and in both groups of patients liver tumors contained higher frequencies compared to TFL. We hypothesized that in liver tumors infiltrating pDCs may promote the differentiation and/or activation of tumor-infiltrating Tr1 cells, as has been observed for CD4+FoxP3+ Tregs.Citation22 Supporting this hypothesis, the frequencies of tumor-infiltrating pDCs and those of Tr1 cells as determined by flow cytometry, showed a highly significant positive correlation (). Also, by immunohistochemistry analysis we observed co-localization of CD303+ pDCs and LAG-3+ cells in the tumor milieu of both types of liver tumors () which was substantiated by a significant positive correlation in co-localization (Pearson r = 0.78; p = 0.03) after counting multiple microscopic fields (200x magnifications, two independent observers). Such correlation was absent in TFL (r = −0.2; p= 0.49), and moreover less LAG-3+ and CD303+ cells were detected by immunohistochemistry in TFL than in tumors (per microscopic field of 200x magnification: LAG-3+ cells 3.4 ± 1.0 vs. 6.6 ± 1.9 (mean ± SEM); and CD303+ cells 1.2 ± 0.4 vs. 5.3 ± 1.6). Furthermore, analysis of the expression of ICOS-L in total cell suspensions obtained from tumors of HCC and LM-CRC patients demonstrated that the main cell population expressing this molecule corresponded to CD123+ pDCs (), while Tr1 in tumors express high levels of ICOS (). We therefore hypothesized that pDCs in liver tumors may induce or activate Tr1 cells through ICOSL in liver tumors.
Figure 3. Plasmacytoid DCs are enriched at the tumor site and correlate with the frequencies of Tr1 cells. (A) Percentages of pDCs (CD123+HLA-DR+LIN-) among CD45+ leukocytes from paired samples of TFL and tumor tissue from 78 patients tested (HCC = 27 and LM-CRC = 51). Tumor leukocytes contain significantly higher numbers of pDCs than TFL (on the average 0.74 ± 0.6 % pDCs in HCC tumors and 1.01 ± 0.9 % in LM-CRC tumors, compared to 0.45 % and 0.75 ± 0.6 % in TFL, respectively). (B) Pearson correlation analysis between the frequencies of tumor-infiltrating pDCs and CD4+FoxP3−CD49b+LAG-3+ Tr1 cells in liver tumors (n = 15). Red dots are HCC and blue open dots represent LM-CRC. (C and D) Immunohistochemistry analysis shows co-localization of CD303+ pDCs (red brown) and LAG-3+ cells (blue) in LM-CRC (C) and HCC (D) tumors. Magnification 200x. An insert at higher magnification showing the close localization of CD303+ and Lag-3+ cells in HCC is displayed in D. (E) Expression of ICOSL and CD123 analyzed by flow cytometry in total cell suspensions from liver tumors.
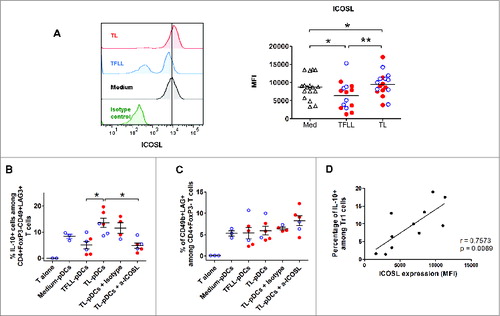
To test this hypothesis, pDCs isolated from blood of healthy donors were exposed to lysates of tumor or TFL and then used to stimulate autologous naive CD4+ T cells. pDCs exposed to tumor lysates (TL-pDCS) up-regulated ICOS-L expression (), whereas TFL lysates (TFLL) induced a significant down-regulation of ICOS-L. In contrast, exposure of pDCs to tumor lysate or TFL lysate did not affect expression of the co-stimulatory molecule CD83 and CD86 was upregulated only in TL-pDCs (Fig. S6B). pDCs induced Tr1 from naive CD4+ T cells and stimulated IL-10 production in these cells (). Interestingly, in parallel with their increased expression of ICOS-L, TL-pDCs induced higher numbers of IL-10-producing CD4+FoxP3−CD49+LAG-3+ Tr1 cells from naive CD4+ T cells compared to pDCs treated with TFL lysate (TFLL-pDCs)(), but their capacity to induce CD49b and LAG-3 expression did not differ significantly (). The ability of TL-pDCs to promote IL-10 production by Tr1 cells was dependent on ICOS-ICOS-L co-stimulation, as it was blocked by addition of a neutralizing antibody against ICOS-L (). Furthermore, there is a positive correlation (r = 0.75, p = 0.006) between the level of expression of ICOS-L on pDCs after exposure to medium, TFLL or tumor lysate, and the frequency of IL-10-producing Tr1 cells induced in the co-culture (). In contrast, the expression of CD49b and LAG-3 was not affected by ICOS-L blocking (). Thus, ICOS-ICOSL signaling seems to be unnecessary for the induction of the Tr1 phenotype by pDCs, but it is critical for the production of IL-10.
Figure 4. Tumor-derived pDCs induce the production of IL-10 by Tr1 cells through ICOS-ligand-ICOS signaling. (A) Blood pDCs isolated from healthy donors after overnight culture in the presence of lysates from TFL (TFLL-pDCs) or tumor tissue (TL-pDCs) were analyzed for the expression of ICOS-L. pDCs exposed to tissue lysates were used to stimulate autologous naive CD4+ T cells. The expression of IL-10 (B) and CD49b and Lag-3 (C) were analyzed on CD4+ T cells after co-culture with pDCs and re-stimulation with PMA/Ionomycin. IL-10 production was analyzed in CD3+CD4+FoxP3−CD49b+LAG-3+ T cells. To evaluate the impact of ICOS-ICOS-L signaling, cells were co-cultured in the presence of 50 ug/mL of control isotype antibody or anti-ICOS-L neutralizing antibody. Values are means ± SEM, *p < 0.05, **p < 0.01. Red dots represent HCC lysates and blue open dots LM-CRC lysates. (D) Pearson correlation analysis of the expression of ICOSL on pDCs cultured with medium, TFLL or TL, and the percentage of IL-10+ Tr1 cells detected after co-culture.
Discussion
At the time of diagnosis the majority of HCC patients are not candidates for curative therapy, and in CRC patients with liver metastasis there is a high rate of recurrence after treatment.Citation1,2 For these groups of patients, immunotherapy aimed at stimulating the local antitumor immune response might present an attractive alternative. However, immunotherapeutic attempts have so far shown poor clinical responses and this might be related to the inhibition of tumor-specific immunity by immune regulatory mechanism present in the tumor microenvironment.Citation3,8 Detailed insight into the complex nature of intra-tumoral immune regulation is essential for the design of immunotherapeutic strategies, and the findings of this study may contribute to development of such strategies.
TILs in liver tumors are composed mainly of CD4+ T cells that are hypo-responsive to tumor antigens.Citation7 We previously showed that an important fraction of the CD4+ T cells in these tumors correspond to CD4+FoxP3+ Tregs that are potent suppressors of antitumor immunity.Citation7,8 There is accumulating evidence for the role of CD4+Foxp3+ Tregs in the development and progression of cancer.Citation23,24 Several studies have shown that the presence of increased numbers of these cells in different tumors contributes to the suppression of antitumor immunity and correlates to decreased survival.Citation23-26 Over the years, several types of Tregs have been identified (reviewed in 9). Whereas CD4+FoxP3+ Tregs are probably the best characterized Treg type, Tr1 cells were until recently a subset of T cells that lacked a defined cell surface signature, and could therefore only be characterized by the production of high levels of IL-10, low levels of IL-2, variable levels of IFNγ and the absence of IL-4 and absence of high and constitutive expression of FoxP3.Citation9 The reliance on a cytokine profile to distinguish Tr1 cells complicated their identification and study, since these cells are not the only T cell subset that secretes IL-10. Still, experimental evidence suggested that exposure of dendritic cells to tumor derived factors favors the induction of Tr1-like cells from naive T cells,Citation13 arguing for a role of Tr1 cells in cancer immunology. Later on, in head and neck carcinoma a suppressive role for in vitro generated CD4+CD25−FoxP3lowIL-10+TGFb+ cells was described.Citation27 Moreover, in Hodgkin lymphoma the presence of CD4+CD25−IL-10+ regulatory T cells has been described Citation12 and more recently a study described the presence of CD4+FoxP3−CD127− regulatory T cells in blood and tumors from HCC patients. Although they did not show regulatory functionality of the tumor-infiltrating CD4+FoxP3−CD127− cells, the circulating phenotypically counterpart suppressed T cell responses through an IL-10-dependent mechanism,Citation11 suggesting a Tr1-like cell type.
However, until now direct evidence for a role of Tr1 cells in human solid tumors is lacking. The recent description of co-expression of CD49b and LAG-3 as markers that can specifically identify this population of cells,Citation15 enabled us to show that the majority of liver tumor-infiltrating IL-10-producing CD4+ T cells consists of Tr1 cells and only a minor proportion corresponded to Th2 cells or FoxP3+ Tregs. Compared to TFL, higher numbers of these Tr1 cells are present in the liver tumors of both HCC-patients and metastatic CRC-patients, indicating selective accumulation in the tumor tissues. In functional assays the tumor-infiltrating Tr1 cells demonstrated a potent suppressive activity mediated by IL-10. Therefore, these cells represent a suppressive population in the tumor environment potentially contributing to the impaired antitumor immunity observed in patients with liver cancer.
Our data suggest that tumor-infiltrating Tr1 cells may be activated by pDCs present in the tumor microenvironment. Using immunohistochemistry analysis pDCs could be identified in the vicinity of Lag3+ cells. Lag3 may also be expressed on CD4+Foxp3+ Tregs,Citation9 but by flow cytometry we observed that on the average only 6% of HCC or LM-CRC-derived CD4+Foxp3+ Tregs express Lag3 (data not shown). Therefore, this co-localization, together with the correlation between the frequencies of tumor-infiltrating pDCs and Tr1 cells observed in flow cytometric analysis (), suggests a possible interaction between both cell types, but further experiments are needed to confirm this in situ interaction. Furthermore, the main population expressing ICOSL in tumor tissues are CD123+ pDCs. In vitro exposure of immature pDCs to tumor lysates, but not lysates of normal liver tissue, conditioned pDCs to upregulate the expression of ICOS-L and induce the production of IL-10 by Tr1 cells in a mechanism mediated by ICOS-ICOS-L signaling. There is substantial evidence suggesting that pDCs have a specialized role in the induction of peripheral tolerance by inducing IL-10-production by Tregs through ICOS-L-ICOS signaling.Citation18,28 Both in breast and in ovarian cancer stimulation of CD4+FoxP3+ Tregs to produce IL-10 by pDCs has been described.Citation19,22 Our results are consistent with a role for pDCs to stimulate IL-10 production by Tr1 cells in the tumor microenvironment of patients with liver cancer. Altogether, these data suggest that ICOS co-stimulation represents a potential target for immunotherapeutic intervention, affecting tumor-specific immunosuppression mediated by both CD4+Foxp3+ Tregs and Tr1 cells.
In summary, in patients with primary and secondary liver cancer we identified a population of tumor-infiltrating Tr1 cells that contributes to local immune suppression in an IL-10 dependent manner. pDCs may drive intra-tumoral immunosuppression by these Tr1 cells by stimulating IL-10 production via ICOS-ICOS-L signaling. Consequently, as has been shown for CD4+FoxP3+ Tregs,Citation7,29 Tr1 cells may inhibit antitumor immunity at the tumor site in liver cancer and thereby promote tumor development. This knowledge is critical for the design of new immunotherapeutic interventions for patients with liver cancer and other solid cancers in which IL-10-producing CD4+ T cells are present, and blockade of the engagement of ICOS-ICOS-L may provide alleviation of this intra-tumoral immunosuppressive mechanism.
Patients and Methods
Patients
Between September 2009 and July 2013, a total of 99 individuals who were eligible for surgical resection of HCC (n = 39) or LM-CRC (n = 60) were enrolled. Paired samples of fresh liver tumor tissue and tumor-free liver tissue (TFL) obtained at the maximum distance (at least 1 cm) from the tumor, were used for isolating TILs and intra-hepatic lymphocytes. In addition, peripheral blood was collected. None of the patients was treated with chemotherapy or radiation prior to resection. The clinical characteristics of the patients are summarized in . The study was approved by the local ethics committee and all patients in the study gave informed consent before tissue donation.
Table 1. Patient characteristics
Cell preparation, flow cytometric analysis, antigen-specific T-cell activation, immunohistochemistry
Detailed descriptions of these methods are provided in the Supplementary Information.
Activation and isolation of IL-10-producing cells
CD4+CD25- T cells were isolated from TILs of patients with liver cancer by magnetic sorting as previously reported.Citation7 Briefly, the non-CD4+ cells were removed by a magnetically labeled cocktail of antibodies followed by depletion of CD25+ cells (Cat. 130-091-301, Miltenyi Biotec). CD4+CD25− T cells were stimulated with Dynabeads that were coupled to anti-CD3 (OKT-3, Cat. 314304, Biolegend) alone or in combination with anti-CD46 (TRA-2-10, Cat.352404, Biolegend) or anti-ICOS (ISA-3; Cat. 16-9948-82, ebiosciences) antibodies using the Dynabeads antibody coupling kit (Cat. 143.11D, Invitrogen). The bead to cell ratio was 0.5:1. Cells were cultured in the presence of 250 U/mL IL-2 (Cat. 130-097, Miltenyi Biotec) for 24–48 h. Then, cells were magnetically sorted into IL-10low and IL-10high fractions using the secretion assay-cell enrichment kit from Miltenyi (Fig. S2).
Suppression assays
The suppressive effect of IL-10-producing CD4+ T cells was assessed by co-culture with PBMCs from healthy donors that were labeled with 0.1 μM of carboxyfluorescein diacetate succinimidyl ester (CFSE, C34554, Invitrogen), and activated with 6 μg/mL of phytohemagglutinin (PHA, Remel-Thermo Fisher Scientific) for 5 d The ratio of cells was 1:10 (Tr1:PBMCs) with at least 5 × 10⁴ responder cells. Proliferation and cytokine production were measured by flow cytometry after re-stimulation with PMA/Ionomycin. Inhibition of T cell proliferation or cytokine production was determined by comparison with culture conditions without IL-10-producing CD4+ T cells, and reported as percentage of suppression of T cell proliferation or cytokine production. To analyze the role of IL-10 in the suppressive capacity of Tr1 cells, 30 ug/mL of neutralizing anti-IL-10R antibody (3F9 Cat. 308806) or isotype-matched control antibody (both from Biolegend) were added to some co-cultures.
In vitro activation and co-culture of pDCs and naive T cells
pDCs were enriched from PBMCs of healthy donors by positive immunomagnetic selection using anti-BDCA-4 antibodies (Cat. 130-090-532, Miltenyi Biotec). Purity of pDCs as determined by CD123 labeling was 92 ± 2.5 %. pDCs were seeded at 105 cells/well in 200 μL of sRPMI medium (details can be found in Supplementary Methods) with 10% human AB serum in the presence of 10 ng/mL of IL-3 (Cat. 130-093, Miltenyi Biotec). pDCs were cultured with medium alone or in the presence of liver tissue lysates (200 μg/mL of total protein). After 18 h pDCs were harvested and washed. Then pDCs were stained for phenotypic analysis or co-cultured in a ratio 1:5 with autologous naive CD4+ T cells, which were purified with the naive CD4+ T cell enrichment kit from Stemcell technologies (Cat. 19155). Cells were co-cultured for 7 d. Thereafter the cells were washed and re-stimulated 5 h with PMA and Ionomycin. The immunophenotype of CD4+ T cells and their cytokine profile were measured by flow cytometry. Tissue lysates were prepared from freshly dissected paired TFL and tumor tissues by five cycles of freezing and thawing in PBS, followed by filtration (0.2 μm). The total protein level was determined by BCA assay (Thermo Scientific), and the lysates were stored at −80°C before use. To determine involvement of ICOS-L in activation of Tr1, 50 μg/mL neutralizing anti-ICOS-L antibody (MIH12, Cat. 16-5889) or isotype-matched control antibody (both from e-Biosciences) were added to the co-cultures.
Statistical analysis
The differences between paired groups of data were analyzed according to their distribution by either t-test or Wilcoxon matched pairs test. Differences between different groups of patients were analyzed by either t-test or Mann–Whitney test, using GraphPad Prism Software (version 5.0). p-values less than 0.05 were considered statistically significant (*p < 0.05; **p < 0.01; ***p < 0.001).
Disclosure of Potential Conflicts of Interest
No potential conflicts of interest were disclosed.
Supplemental Material
Supplemental data for this article can be accessed on the publisher's website.
1008355_Supplementary_Materials.zip
Download Zip (6.7 MB)Acknowledgments
A. Woltman, A. Boonstra and M.P. Peppelenbosch for their helpful discussions and K. Sideras, G. van Oord and S. Pal Sing for technical assistance.
Funding
This work was supported by grants to D.S. (Erasmus MC Fellowship) and A.P.-G. (Erasmus MC Grant 2011) from Erasmus MC.
References
- Mazzanti R, Gramantieri L, Bolondi L. Hepatocellular carcinoma: epidemiology and clinical aspects. Mol Aspects Med 2008; 29:130-43; PMID:18061252; http://dx.doi.org/10.1016/j.mam.2007.09.008
- Kemeny N. The management of resectable and unresectable liver metastases from colorectal cancer. Curr Opin Oncol 2010; 22:364-73; PMID: 20520544; http://dx.doi.org/10.1097/CCO.0b013e32833a6c8a
- Pardee AD, Butterfield LH. Immunotherapy of hepatocellular carcinoma: Unique challenges and clinical opportunities. Oncoimmunology 2012; 1:48-55; PMID:22720211; http://dx.doi.org/10.4161/onci.1.1.18344
- Mazzolini G, Ochoa MC, Morales-Kastresana A, Sanmamed MF, Melero I. The liver, liver metastasis and liver cancer: a special case for immunotherapy with cytokines and immunostimulatory monoclonal antibodies. Immunotherapy 2012; 4:1081-5; PMID:23194355; http://dx.doi.org/10.2217/imt.12.99
- Pedroza-Gonzalez A, Xu K, Wu TC, Aspord C, Tindle S, Marches F, Gallegos M, Burton EC, Savino D, Hori T, et al. Thymic stromal lymphopoietin fosters human breast tumor growth by promoting type 2 inflammation. J Exp Med 2011; 208:479-90; PMID:21339324; http://dx.doi.org/10.1084/jem.20102131
- Palucka K, Banchereau J. Cancer immunotherapy via dendritic cells. Nat Rev Cancer 2012; 12:265-77; PMID:22437871; http://dx.doi.org/10.1038/nrc3258
- Pedroza-Gonzalez A, Verhoef C, Ijzermans JN, Peppelenbosch MP, Kwekkeboom J, Verheij J, Janssen HL, Sprengers D. Activated tumor-infiltrating CD4+ regulatory T cells restrain antitumor immunity in patients with primary or metastatic liver cancer. Hepatology 2013; 57:183-94; PMID:22911397; http://dx.doi.org/10.1002/hep.26013
- Pedroza-Gonzalez A, Kwekkeboom J, Sprengers D. T-cell suppression mediated by regulatory T cells infiltrating hepatic tumors can be overcome by GITRL treatment. Oncoimmunology 2013; 2:e22450; PMID:23483229; http://dx.doi.org/10.4161/onci.22450
- Gregori S, Goudy KS, Roncarolo MG. The cellular and molecular mechanisms of immuno-suppression by human type 1 regulatory T cells. Front Immunol 2012; 3:30; PMID:22566914; http://dx.doi.org/10.3389/fimmu.2012.00030
- Roncarolo MG, Gregori S, Lucarelli B, Ciceri F, Bacchetta R. Clinical tolerance in allogeneic hematopoietic stem cell transplantation. Immunol Rev 2011; 241:145-63; PMID:21488896; http://dx.doi.org/10.1111/j.1600-065X.2011.01010.x
- Kakita N, Kanto T, Itose I, Kuroda S, Inoue M, Matsubara T, Higashitani K, Miyazaki M, Sakakibara M, Hiramatsu N, et al. Comparative analyses of regulatory T cell subsets in patients with hepatocellular carcinoma: a crucial role of CD25(−) FOXP3(−) T cells. Int J Cancer 2012; 131:2573-83; PMID:22419479; http://dx.doi.org/10.1002/ijc.27535
- Marshall NA, Christie LE, Munro LR, Culligan DJ, Johnston PW, Barker RN, Vickers MA. Immunosuppressive regulatory T cells are abundant in the reactive lymphocytes of Hodgkin lymphoma. Blood 2004; 103:1755-62; PMID:14604957; http://dx.doi.org/10.1182/blood-2003-07-2594
- Lundqvist A, Palmborg A, Pavlenko M, Levitskaya J, Pisa P. Mature dendritic cells induce tumor-specific type 1 regulatory T cells. J Immunother 2005; 28:229-35; PMID:15838379; http://dx.doi.org/10.1097/01.cji.0000158854.15664.c2
- Bergmann C, Strauss L, Zeidler R, Lang S, Whiteside TL. Expansion of human T regulatory type 1 cells in the microenvironment of cyclooxygenase 2 overexpressing head and neck squamous cell carcinoma. Cancer Res 2007; 67:8865-73; PMID:17875728; http://dx.doi.org/10.1158/0008-5472.CAN-07-0767
- Gagliani N, Magnani CF, Huber S, Gianolini ME, Pala M, Licona-Limon P, Guo B, Herbert DR, Bulfone A, Trentini F, et al. Coexpression of CD49b and LAG-3 identifies human and mouse T regulatory type 1 cells. Nat Med 2013; 19:739-46; PMID:23624599; http://dx.doi.org/10.1038/nm.3179
- Kemper C, Chan AC, Green JM, Brett KA, Murphy KM, Atkinson JP. Activation of human CD4+ cells with CD3 and CD46 induces a T-regulatory cell 1 phenotype. Nature 2003; 421:388-92; PMID:12540904; http://dx.doi.org/10.1038/nature01315
- Hutloff A, Dittrich AM, Beier KC, Eljaschewitsch B, Kraft R, Anagnostopoulos I, Kroczek RA. ICOS is an inducible T-cell co-stimulator structurally and functionally related to CD28. Nature 1999; 397:263-6; PMID:9930702; http://dx.doi.org/10.1038/16717
- Ito T, Yang M, Wang YH, Lande R, Gregorio J, Perng OA, Qin XF, Liu YJ, Gilliet M. Plasmacytoid dendritic cells prime IL-10-producing T regulatory cells by inducible costimulator ligand. J Exp Med 2007; 204:105-15; PMID:17200410; http://dx.doi.org/10.1084/jem.20061660
- Conrad C, Gregorio J, Wang YH, Ito T, Meller S, Hanabuchi S, Anderson S, Atkinson N, Ramirez PT, Liu YJ, et al. Plasmacytoid dendritic cells promote immunosuppression in ovarian cancer via ICOS costimulation of Foxp3(+) T-regulatory cells. Cancer Res 2012; 72:5240-9; PMID:22850422; http://dx.doi.org/10.1158/0008-5472.CAN-12-2271
- Labidi-Galy SI, Sisirak V, Meeus P, Gobert M, Treilleux I, Bajard A, Combes JD, Faget J, Mithieux F, Cassignol A, et al. Quantitative and functional alterations of plasmacytoid dendritic cells contribute to immune tolerance in ovarian cancer. Cancer Res 2011; 71:5423-34; PMID:21697280; http://dx.doi.org/10.1158/0008-5472.CAN-11-0367
- Faget J, Bendriss-Vermare N, Gobert M, Durand I, Olive D, Biota C, Bachelot T, Treilleux I, Goddard-Leon S, Lavergne E, et al. ICOS-ligand expression on plasmacytoid dendritic cells supports breast cancer progression by promoting the accumulation of immunosuppressive CD4+ T cells. Cancer Res 2012; 72:6130-41; PMID:23026134; http://dx.doi.org/10.1158/0008-5472.CAN-12-2409
- Sisirak V, Faget J, Gobert M, Goutagny N, Vey N, Treilleux I, Renaudineau S, Poyet G, Labidi-Galy SI, Goddard-Leon S, et al. Impaired IFN-alpha production by plasmacytoid dendritic cells favors regulatory T-cell expansion that may contribute to breast cancer progression. Cancer Res 2012; 72:5188-97; PMID:22836755; http://dx.doi.org/10.1158/0008-5472.CAN-11-3468
- Chen KJ, Lin SZ, Zhou L, Xie HY, Zhou WH, Taki-Eldin A, Zheng SS. Selective recruitment of regulatory T cell through CCR6-CCL20 in hepatocellular carcinoma fosters tumor progression and predicts poor prognosis. PLoS One 2011; 6:e24671; PMID:21935436; http://dx.doi.org/10.1371/journal.pone.0024671
- Nishikawa H, Sakaguchi S. Regulatory T cells in tumor immunity. Int J Cancer 2010; 127:759-67; PMID:20518016
- Yang XH, Yamagiwa S, Ichida T, Matsuda Y, Sugahara S, Watanabe H, Sato Y, Abo T, Horwitz DA, Aoyagi Y. Increase of CD4+ CD25+ regulatory T-cells in the liver of patients with hepatocellular carcinoma. J Hepatol 2006; 45:254-62; PMID:16600416; http://dx.doi.org/10.1016/j.jhep.2006.01.036
- Salama P, Phillips M, Grieu F, Morris M, Zeps N, Joseph D, Platell C, Iacopetta B. Tumor-infiltrating FOXP3+ T regulatory cells show strong prognostic significance in colorectal cancer. J Clin Oncol 2009; 27:186-92; PMID:19064967; http://dx.doi.org/10.1200/JCO.2008.18.7229
- Bergmann C, Strauss L, Wang Y, Szczepanski MJ, Lang S, Johnson JT, Whiteside TL. T regulatory type 1 cells in squamous cell carcinoma of the head and neck: mechanisms of suppression and expansion in advanced disease. Clin Cancer Res 2008; 14:3706-15; PMID:18559587; http://dx.doi.org/10.1158/1078-0432.CCR-07-5126
- Akbari O, Freeman GJ, Meyer EH, Greenfield EA, Chang TT, Sharpe AH, Berry G, DeKruyff RH, Umetsu DT. Antigen-specific regulatory T cells develop via the ICOS-ICOS-ligand pathway and inhibit allergen-induced airway hyperreactivity. Nat Med 2002; 8:1024-32; PMID:12145647; http://dx.doi.org/10.1038/nm745
- Le Mercier I, Poujol D, Sanlaville A, Sisirak V, Gobert M, Durand I, Dubois B, Treilleux I, Marvel J, Vlach J, et al. Tumor promotion by intratumoral plasmacytoid dendritic cells is reversed by TLR7 ligand treatment. Cancer Res 2013; 73:4629-40; PMID:23722543; http://dx.doi.org/10.1158/0008-5472.CAN-12-3058