
ABSTRACT
Loss of expression of calreticulin (CALR) has been detected by immunohistochemistry in a fraction of non-small cell lung cancers (NSCLC) and has been demonstrated to have a major negative prognostic impact on overall patient survival. Here, we analyzed the impact of CALR expression levels detected by microarray finding a positive correlation between CALR and the expression of a metagene indicating the presence of cytotoxic T lymphocytes (CTL) in NSCLC and ovarian cancer. In addition, we detected a positive correlation with a metagene suggestive of activated dendritic cell (aDC) infiltration in ovarian cancer. Combination of two parameters (CALR + DC (dendritic cell) in NSCL and CALR + aDC in ovarian cancer) or three parameters (CALR + CTL + DC in NSCL and CALR + CTL + aDC in ovarian cancer) had a significant impact on overall patient survival in NSCL (Adenoconsortium) and ovarian cancer (TCGA collection), allowing the stratification of patients in high-risk and low-risk groups. In addition, CALR and aDC alone have a significant impact on overall survival in ovarian cancer. In contrast, in mammary, colorectal and prostate cancer, CALR had no impact on patient survival if analyzed alone or in combination with the immune infiltrate. In addition, CALR correlates with CTL infiltrate in three cancer types (colorectal, breast, ovarian). Altogether, these results support the contention that, at least in some cancers, loss of CALR expression may negatively affect immunosurveillance, thereby reducing patient survival.
Introduction
In normal cells, calreticulin (CALR) is the most abundant intraluminal endoplasmic reticulum (ER) protein. CALR has multiple, phylogenetically conserved functions on the homeostasis of the ER, such as local Ca2+ buffering, as well as on the function of the ER as a protein-synthesizing organelle. This latter function also involves the role of CALR as a local chaperone, facilitating correct protein folding.Citation1 CALR knockout compromises multiple cellular function including integrin-mediated Ca2+ fluxes and adhesionCitation2 and Wnt signaling.Citation3 Mouse embryos lacking CALR expression die early during development due to cardiac malfunctionCitation4 as they exhibit omphalocele (failure of absorption of the umbilical hernia) and exencephaly (secondary to a defect in neural tube closure).Citation5 Heart-specific overexpression of activated calcineurin rescues the phenotype of CALR−/− mice with regard to embryonic lethality.Citation6
Beyond these general functions in cell physiology, CALR also affects immune responses, at two levels, namely, immune cells, as well as in cells that should be recognized by immune effectors. CALR has been described to be essential for the loading of antigenic peptides into MHC class I proteins, meaning that CALR-deficient cells express little or no MHC class I on their surface.Citation7 Moreover, CALR is contained in granules of cytotoxic T lymphocytes (CTL) where it interacts with perforin,Citation8 and CTL from CALR−/− mice exhibit a defect in the interaction with target cells and reduced lysis.Citation9
In addition, CALR can determine the recognition of target cells by the immune system. Indeed, in conditions of cellular stress, CALR can be translocated from the lumen of the ER to the cell surface, where CALR acts as an “eat-me” signal, hence facilitating the recognition and phagocytosis of the CALR exposing cells by macrophagesCitation10 and dendritic cell (DC) precursors.Citation11-14 This phenomenon has been speculated to contribute to “phagoptosis,” i.e. the removal of live cells by phagocytosis (shown for CD47 KO of knock-down cells).Citation15 In the context of anticancer chemotherapies causing ER stress, CALR exposure can stimulate the transfer of tumor antigens from dying tumor cells into the DC compartment, thereby stimulating anticancer immune responses that determine the long-term fate of patients.Citation16-20
Two papers have described defective CALR expression in human cancers by immunohistochemistry, one in colorectal cancerCitation21 and one in non-small cell lung cancer (NSCL).Citation22 The authors of these two studied concordantly concluded that (i) absence of CALR expression correlates with a reduced T cell infiltrate of the tumor, and (ii) that low CALR expression has a negative prognostic impact. Based on these reports, we decided to investigate the impact of CALR expression at the mRNA level on the immune infiltrate and patient survival in multiple distinct, socioeconomically important cancers, namely breast cancer, colorectal cancer, NSCL cancer, ovarian cancer and prostate cancer. Here, we report a significant correlation between CALR mRNA expression and the immune infiltrate in three cancer types, namely breast, colorectal and ovarian cancer. In addition, CALR mRNA expression is significantly related to patient survival for two cancer types, namely NSCL cancer and ovarian cancer.
Results and discussion
CALR mRNA expression correlates negatively with the CTL infiltrate and impacts patient survival in NSCLC
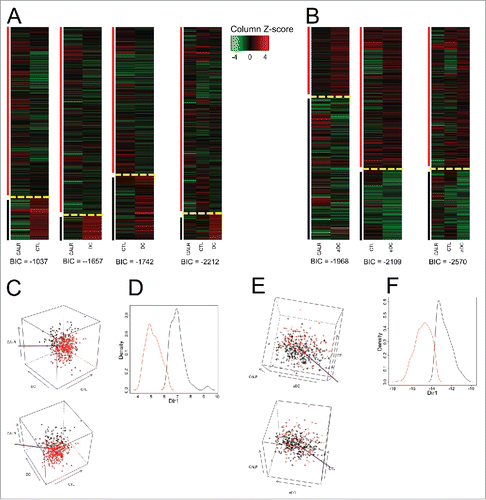
As a first approach to investigate the impact of CALR mRNA expression on cancer immunosurveillance, we chose to classify NSCLC samples from the AdenoconsortiumCitation23 according to their expression levels of mRNAs indicating the presence of CALR, CTL, DC and aDC. For the determination of CALR levels, only one probe set was available. As an indirect measurement of the density of the CTL, DC and aDC infiltrate, we took advantage of metagenes that have previously been constructed,Citation24 using genes identified in the context of human colorectal cancer (for each metagene, the set of genes is based on cell line transcriptome classification; but the gene components are different for each different cancer, see Materials and Methods).Citation25 Unsupervised clustering yielded two groups of patients in each case (CALR + CTL, CALR + DC, CALR + aDC, ). A positive correlation between CTL and DC (or aDC) density was detected in NSCLC (Fig. S2A). In contrast, low CALR levels correlated with high CTL infiltration (Fig. S2A). Classification of patients according to the three parameters (CALR + CTL + DC and CALR + CTL + aDC) by unsupervised clustering also yielded two clusters (). Indeed, the three parameters allowed for improved separation of the patient population in two groups, as illustrated by three-dimensional representation of the data () or cluster dimension reduction representation (). In contrast, in three other cancer types, namely, colorectal cancer, mammary carcinoma and ovarian cancer, only positive associations between CALR and CTL were observed. In prostate cancer, no significant correlation was observed between CALR and CTL, DC or aDC (Figs. S2A and B).
Figure 1. Clustering of non-small cell lung cancers (NSCLC) according to the mRNA expression levels of CALR and that of metagenes indicating the presence of cytotoxic T cells (CTL) and dendritic cells (DC) and activated DC (aDC). (A) Expression z-scores of CALR, CTL and DC (combined in a pairwise fashion or combined altogether followed by clustering). (B) DC is replaced by aDC. Yellow dashed lines separate clusters and vertical color lines (black, red) define the clusters. BIC (Bayesian Information Criterion, defined as (−2) times the logarithm of the maximum likelihood, corrected by a factor that depends on the number of clusters and on the size of data) is indicated for each multidimensional clustering. (C) Three-dimensional representation of clusters obtained for the combined analysis of CALR, CTL and DC. The purple line represents the axis obtained by cluster dimension reduction (“MclustDR” function of R package Mclust). (D) Density plot representation of clusters, in the direction defined by purple axis in (C). (E) Three-dimensional representation of clusters obtained for the combined analysis of CALR, CTL and aDC. The purple line represents the axis obtained by cluster dimension reduction. (F) Density plot representation of clusters, in the direction defined by the purple axis in (F).
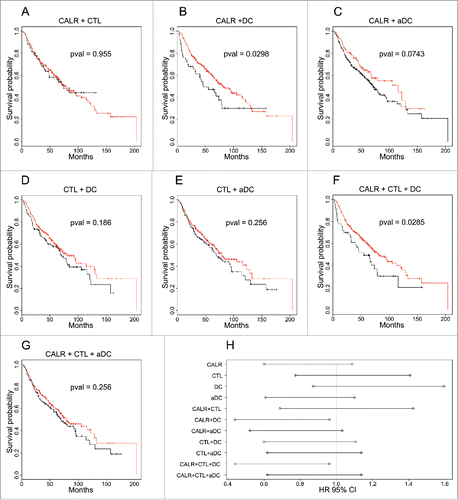
Next, we investigated the impact of each of these parameters, alone or in combination, on patient survival in the large NSCLC cohort. Importantly, the level of mRNA expression of CALR or metagenes reflecting the presence of CTL or DC, each taken alone, had no significant effect on overall patient survival, when patients were separated into two groups of equal size, separated by the median of CALR, CTL and DC respectively (Fig. S1). The combined clustering of CTL and DC (or aDC) () or that of CTL and CALR () did not yield any useful risk stratification. However, simultaneous assessment of CALR and DC (or aDC) () allowed for the separation of the patients into two groups with good prognosis and poor prognosis (p = 0.0298 and p = 0.0743 for CALR + DC or CALR + aDC, respectively). This classification was slightly improved when three parameters (CALR, CTL, DC but not aDC) were simultaneously used for the classification, yielding a good prognosis group and a poor prognosis group (p = 0.0285) (). In sharp contrast to NSCLC, in colorectal and mammary carcinoma, the analyses of these expression parameters, alone or in combination, failed to yield a separation of patients into risk groups, at least in the cohorts analyzed in this paper (Table S2).
Figure 2. Survival curves and associated hazard ratios in NSCLC. The colors of the curves are related to the clusters indicated in . p values of survival curves were calculated by means of the log-rank test (A–G). Hazard ratios were obtained using the Cox model (H) for clusters defined by single (meta-)genes or their combination, as represented in Fig. S1.
Impact of CALR mRNA expression on the immune infiltrate and overall survival of ovarian cancer patients
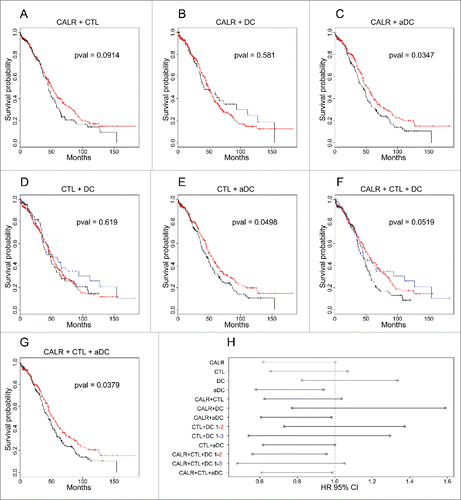
As mentioned above, in ovarian cancer, a clear correlation between CALR and CTL can be seen (Fig. S2). In addition, aDC (but not DC) correlates with CALR and CTL. The unsupervised clustering of the combination of data, however, yielded different results from NSCLC, namely a classification in two groups for (CALR + CTL, CALR + DC, CALR + aDC, CTL + aDC and CALR + CTL + aDC), but in three categories for (CTL + DC and CALR + CTL + DC) (). When the impact of these parameters on patient survival was assessed, CALR alone yielded a borderline effect (p = 0.053) with a negative effect of low CALR expression on overall survival; immune infiltrate with aDC alone positively correlates with overall survival (Fig. S1B). However, the best classifications (p = 0.0347) was obtained when information on CALR expression and the density of the aDC infiltrate was combined, yielding two groups, one with good prognosis (CALRhighaDChigh) and another one with poor overall survival (CALRlowaDClow). In contrast, inclusion of the CTL metagene did not improve the classification (). Altogether, these results indicate that CALR expression does affect immunosurveillance in ovarian cancer.
Figure 3. Clustering of ovarian cancers according to the mRNA expression levels of CALR and that of metagenes indicating the presence of cytotoxic T cells (CTL) and dendritic cells (DC) and activated DC (aDC). (A) Expression z-scores of CALR, CTL and DC (combined in a pairwise fashion or combined altogether followed by clustering). (B) DC is replaced by aDC. Yellow dashed lines separate clusters and vertical color lines (black, red, blue) define the clusters. BIC (Bayesian Information Criterion, defined as (−2) times the logarithm of the maximum likelihood, corrected by a factor that depends on the number of clusters and on the size of data) are indicated for each multidimensional clustering. (C) (respectively, E) Three-dimensional representation of clusters obtained for the combined analysis of CALR, CTL and DC (respectively, aDC). Purple lines represent the axes obtained by cluster dimension reduction (“MclustDR” function of R package mclust), the thick line for the first axis, the thin line for the second. (D) (respectively, F) scatter plot representation of clusters, in the directions defined by purple axes in (C) (respectively, F).
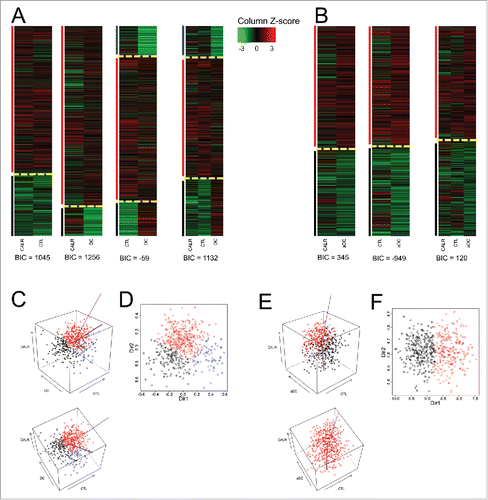
Figure 4. Survival curves and associated hazard ratios in ovarian cancer. The colors of curves are related to the clusters indicated in . p values of survival curves were calculated by means of the log-rank test (A–G). Hazard ratios were obtained using the Cox model (H) (including also cluster defined by single (meta-)gene, represented in Fig. S1). In the case of three clusters, the type of one-by-one comparison is indicated.
Concluding remarks
The results obtained in this bioinformatic study suggest that CALR expression by tumors may affect the density and composition of the local immune infiltrate. In several cancer types (breast, colorectal, ovarian) CALR mRNA expression positively correlated with that of the metagene reflecting CTL infiltration, while this correlation was negative in NSCL. In addition, CALR mRNA expression and the metagene indicating the local presence of DC (or aDC) positively correlated in all four cancer cell types. Only in NSCL and ovarian cancer, CALR expression could be used to classify patients into high-risk and low-risk groups, provided that this information was combined with the analysis of the presence of DC (in NSCLC) or aDC (in ovarian cancer). However, adding information about the CTL-related metagene did not yield a major improvement of the classification.
As compared to immunohistochemical measurements; mRNA expression data have two major limitations, namely the lack of spatial information (meaning that the cell type expressing the gene of interest cannot be determined) and the risk that post-transcriptional and post-translational regulation of gene expression will not be reflected, leading to a discrepancy between mRNA and protein expression levels. As a result, it is difficult to compare the results of the present study to immunohistochemical data. While we were not able to validate the results published on colorectal cancerCitation21 with regard to the impact of CALR expression on patient survival, the present data do confirm the clinical correlation between low CALR expression and poor prognosis in NSCLC.Citation22 In this latter disease, CALR expression by malignant cells positively correlated with CTL infiltration and DC infiltration, as determined by immunohistochemistry.Citation22 The present bioinformatic study has only confirmed the correlation of CALR with DC or aDC, not that with CTL. However, CTL and DC were defined as CD8+ and DC-LAMP+ cells, respectively, by immunohistochemistry, while they are defined as aggregates of multiple genes (metagenes) in the present study (Fig. S4), underscoring again the difficulty of comparing results obtained with completely different methods.
How could low CALR expression subvert immunosurveillance? As a first possibility, it is possible that the level of CALR expression might reflect cell-intrinsic properties of malignancy, as illustrated by the fact that the promoter of the retinoblastoma (RB) gene drives the expression of long non-coding RNA that stimulates CALR expression, meaning that tumors that delete RB should exhibit lower CALR expression.Citation26 However, we have been unable to confirm an association between RB and CALR mRNA levels in lung caner (not shown). In addition, CALR expression modulates multiple intracellular signaling mechanisms, as briefly outlined in the Introduction of this paper. Hence, CALR expression might affect (or reflect) the general cell biology of cancer cells, which then indirectly shapes the relationship of such cells with their microenvironment. As a second possibility, CALR expression might directly influence the dialog of tumor cells with immune effectors. Immunohistochemical studies ruled out that low CALR expression would cause a drastic loss of MHC class I by NSCLC cells.Citation22 Hence, the possibility remains (yet remains to be proven) that surface exposure of CALR correlating with the level of total CALR expression would determine the interaction of malignant cells with the cellular immune system.Citation22 In favor of this latter possibility, it has been found that stable expression of a CALR variant that is tethered to the cell surface stimulates immunosurveillance, causing a reduction or even abolition of tumor growth in a T cell-dependent fashion.Citation19 Such CALR-expressing cells also have an improved capacity to stimulate anticancer immune responses in vaccination assays.Citation19,27 It has been proposed that mRNA CALR expression only affects the prognosis of NSCLC and ovarian cancer patients who are treated with immunogenic cell death inducers (radiotherapy in NSCLC and paclitaxel in ovarian cancer), while it would not affect the overall or progression-free survival of patients who are left untreated (in the case of NSCLC) or are treated with a non-immunogenic cell death inducer, namely, topotecan (in the case of ovarian cancer), according to the analysis by Garg et al.Citation27 This latter finding further comforts the idea that CALR expression may influence cancer patient survival through immunological effects.
In conclusion, the present study lends strong support for a role of CALR in anticancer immunosurveillance in four human cancers (correlation with CTL and/or stratification of patient survival). It will be interesting to study this parameter together with others that potentially determine cancer cell immunogenicity such as autophagic flux and HMGB1 expression,Citation28,29 as well as mutational load.Citation30 Such a combined analysis might lead to a further refinement of risk stratification and hence yield clinical useful prognostic and predictive biomarkers.
Materials and methods
Public transcriptome datasets (microarray and RNA-seq)
Human tissue transcriptomes of NSCL (microarrays), colorectal (microarrays), breast (microarrays), ovarian (microarrays) and prostate (RNA-seq) cancer were considered. Data sets with clinical annotation including overall survival were chosen and listed in Table S1. All datasets were downloaded from TCGA (http://cancergenome.nih.gov/), except for the lung microarrays (Adenoconsortium,Citation23). All data were processed by means of the R environment.Citation31 Normalized microarrays were used (“level 3” for TCGA data sets, RMA for Adenoconsortium within R package affyCitation32). For RNA-seq, R package DESEQ2Citation33 was used for processing; data were then normalized using the “voom” function in R package limma.Citation34 CALR- and immune-related genes (for metagene construction) expressions were taken directly from microarray data (normalized on a log scale) or from RNA-seq data (using the “voom” normalization).
Metagenes
CTL (CD8+_T_cells) and DC metagene expressions were computed using a published methodCitation24,35: a metagene is defined by a normalized vector in an abstract space, where each dimension coincides with one of its constitutive gene. NSCL, colorectal and breast cancer metagenes were taken directly from a previous publicationCitation24; the negative components of each metagene were removed (in the case of CTL in NSLC, all component signs were inverted, then negative components were removed, in order to keep CD8A, PRF1 and GZMM inside the CTL metagene). For ovarian and prostate cancer, metagenes were constructed from expression in their respective TCGA datasets, using a previously described method,Citation24,35 and negative components were removed. The metagenes are indicated in Fig. S4 for each cancer type. For each tumor sample, the expression of a metagene is the scalar product between its vector and the expression of its constitutive genes (orthogonal projection).
Clusters
Clusters in a two-dimensional expression space (CALR × CTL, CALR × DC, CTL × DC) and in a three-dimensional expression space (CALR × CTL × DC) were constructed by means of the “Mclust” function of the mclust R package,Citation36 using the default input parameters. If a single cluster was produced, the G parameter (the numbers of clusters for which the BIC is to be calculated) was set to two. This applies to the cluster for CTL + CALR in ovarian cancer, as well as to all clusters in colorectal and prostate cancer. In the case of prostate cancer, in the CTL × DC expression space, the clustering method was imposed (cluster model of ellipsoidal, varying volume, shape and orientation), in order to avoid incoherent clustering. For one-dimensional clustering (CALR, CTL, DC, aDC), data was separated in two equal size clusters, using median expression as the threshold.
Survival analysis
Survival analyses were carried out using the survival R package.Citation37,38 Overall survival time was extracted from the clinical annotation of the different data sets. For testing cluster dependent survival curves, log-rank (Mantel–Haenszel) test was used (“survdiff” function). For computing hazard ratio, the Cox proportional hazards regression model was applied (function “coxph” of the survival R package).
Correlations
Pearson's correlations were calculated (correlation coefficient or R value and p value of correlation test), because data were Gaussian. In the correlation figures, gray axes represent the first principal component.
Disclosure of potential conflicts of interest
No potential conflicts of interest were disclosed.
KONI_A_1177692_s02.zip
Download Zip (2 MB)Acknowledgments
GK is supported by the Ligue contre le Cancer (équipe labelisée); Agence National de la Recherche (ANR)—Projets blancs; ANR under the frame of E-Rare-2, the ERA-Net for Research on Rare Diseases; Association pour la recherche sur le cancer (ARC); Cancéropôle Ile-de-France; Institut National du Cancer (INCa); Institut Universitaire de France; Fondation pour la Recherche Médicale (FRM); the European Commission (ArtForce); the European Research Council (ERC); the LeDucq Foundation; the LabEx Immuno-Oncology; the SIRIC Stratified Oncology Cell DNA Repair and Tumor Immune Elimination (SOCRATE); the SIRIC Cancer Research and Personalized Medicine (CARPEM); and the Paris Alliance of Cancer Research Institutes (PACRI). We thank also TCGA Research Network for generating TCGA datasets.
References
- Wang WA, Groenendyk J, Michalak M. Calreticulin signaling in health and disease. Int J Biochem Cell Biol 2012; 44:842-6; PMID:22373697; http://dx.doi.org/10.1016/j.biocel.2012.02.009
- Coppolino MG, Woodside MJ, Demaurex N, Grinstein S, St-Arnaud R, Dedhar S. Calreticulin is essential for integrin-mediated calcium signalling and cell adhesion. Nature 1997; 386:843-7; PMID:9126744; http://dx.doi.org/10.1038/386843a0
- Groenendyk J, Michalak M. Disrupted WNT signaling in mouse embryonic stem cells in the absence of calreticulin. Stem Cell Rev 2014; 10:191-206; PMID:24415131; http://dx.doi.org/10.1007/s12015-013-9488-6
- Mesaeli N, Nakamura K, Zvaritch E, Dickie P, Dziak E, Krause KH, Opas M, MacLennan DH, Michalak M. Calreticulin is essential for cardiac development. J Cell Biol 1999; 144:857-68; PMID:10085286; http://dx.doi.org/10.1083/jcb.144.5.857
- Rauch F, Prud'homme J, Arabian A, Dedhar S, St-Arnaud R. Heart, brain, and body wall defects in mice lacking calreticulin. Exp Cell Res 2000; 256:105-11; PMID:10739657; http://dx.doi.org/10.1006/excr.2000.4818
- Guo L, Lynch J, Nakamura K, Fliegel L, Kasahara H, Izumo S, Komuro I, Agellon LB, Michalak M. COUP-TF1 antagonizes Nkx2.5-mediated activation of the calreticulin gene during cardiac development. J Biol Chem 2001; 276:2797-801; PMID:11106640; http://dx.doi.org/10.1074/jbc.C000822200
- Sadasivan B, Lehner PJ, Ortmann B, Spies T, Cresswell P. Roles for calreticulin and a novel glycoprotein, tapasin, in the interaction of MHC class I molecules with TAP. Immunity 1996; 5:103-14; PMID:8769474; http://dx.doi.org/10.1016/S1074-7613(00)80487-2
- Andrin C, Pinkoski MJ, Burns K, Atkinson EA, Krahenbuhl O, Hudig D, Fraser SA, Winkler U, Tschopp J, Opas M et al. Interaction between a Ca2+-binding protein calreticulin and perforin, a component of the cytotoxic T-cell granules. Biochemistry 1998; 37:10386-94; PMID:9671507; http://dx.doi.org/10.1021/bi980595z
- Sipione S, Ewen C, Shostak I, Michalak M, Bleackley RC. Impaired cytolytic activity in calreticulin-deficient CTLs. J Immunol 2005; 174:3212-9; PMID:15749851; http://dx.doi.org/10.4049/jimmunol.174.6.3212
- Gardai SJ, McPhillips KA, Frasch SC, Janssen WJ, Starefeldt A, Murphy-Ullrich JE, Bratton DL, Oldenborg PA, Michalak M, Henson PM. Cell-surface calreticulin initiates clearance of viable or apoptotic cells through trans-activation of LRP on the phagocyte. Cell 2005; 123:321-34; PMID:16239148; http://dx.doi.org/10.1016/j.cell.2005.08.032
- Obeid M, Tesniere A, Ghiringhelli F, Fimia GM, Apetoh L, Perfettini JL, Castedo M, Mignot G, Panaretakis T, Casares N et al. Calreticulin exposure dictates the immunogenicity of cancer cell death. Nat Med 2007; 13:54-61; PMID:17187072; http://dx.doi.org/10.1038/nm1523
- Obeid M, Tesniere A, Panaretakis T, Tufi R, Joza N, van Endert P, Ghiringhelli F, Apetoh L, Chaput N, Flament C et al. Ecto-calreticulin in immunogenic chemotherapy. Immunol Rev 2007; 220:22-34; PMID:17979837; http://dx.doi.org/10.1111/j.1600-065X.2007.00567.x
- Panaretakis T, Joza N, Modjtahedi N, Tesniere A, Vitale I, Durchschlag M, Fimia GM, Kepp O, Piacentini M, Froehlich KU et al. The co-translocation of ERp57 and calreticulin determines the immunogenicity of cell death. Cell Death Differ 2008; 15:1499-509; PMID:18464797; http://dx.doi.org/10.1038/cdd.2008.67
- Vacchelli E, Ma Y, Baracco EE, Sistigu A, Enot DP, Pietrocola F, Yang H, Adjemian S, Chaba K, Semeraro M et al. Chemotherapy-induced antitumor immunity requires formyl peptide receptor 1. Science 2015; 350:972-8; PMID:26516201; http://dx.doi.org/10.1126/science.aad0779
- Brown GC, Vilalta A, Fricker M. Phagoptosis - Cell Death By Phagocytosis - Plays Central Roles in Physiology, Host Defense and Pathology. Curr Mol Med 2015; 15:842-51; PMID:26511705; http://dx.doi.org/10.2174/156652401509151105130628
- Aranda F, Bloy N, Galluzzi L, Kroemer G, Senovilla L. Vitamin B6 improves the immunogenicity of cisplatin-induced cell death. Oncoimmunology 2014; 3:e955685; PMID:25941619; http://dx.doi.org/10.4161/21624011.2014.955685
- Aranda F, Bloy N, Pesquet J, Petit B, Chaba K, Sauvat A, Kepp O, Khadra N, Enot D, Pfirschke C et al. Immune-dependent antineoplastic effects of cisplatin plus pyridoxine in non-small-cell lung cancer. Oncogene 2015; 34:3053-62; PMID:25065595; http://dx.doi.org/10.1038/onc.2014.234
- Michaud M, Xie X, Bravo-San Pedro JM, Zitvogel L, White E, Kroemer G. An autophagy-dependent anticancer immune response determines the efficacy of melanoma chemotherapy. Oncoimmunology 2014; 3:e944047; PMID:25610726; http://dx.doi.org/10.4161/21624011.2014.944047
- Senovilla L, Vitale I, Martins I, Tailler M, Pailleret C, Michaud M, Galluzzi L, Adjemian S, Kepp O, Niso-Santano M et al. An immunosurveillance mechanism controls cancer cell ploidy. Science 2012; 337:1678-84; PMID:23019653; http://dx.doi.org/10.1126/science.1224922
- Sukkurwala AQ, Adjemian S, Senovilla L, Michaud M, Spaggiari S, Vacchelli E, Baracco EE, Galluzzi L, Zitvogel L, Kepp O et al. Screening of novel immunogenic cell death inducers within the NCI Mechanistic Diversity Set. Oncoimmunology 2014; 3:e28473; PMID:25050214; http://dx.doi.org/10.4161/onci.28473
- Peng RQ, Chen YB, Ding Y, Zhang R, Zhang X, Yu XJ, Zhou ZW, Zeng YX, Zhang XS. Expression of calreticulin is associated with infiltration of T-cells in stage IIIB colon cancer. World J Gastroenterol 2010; 16:2428-34; PMID:20480531; http://dx.doi.org/10.3748/wjg.v16.i19.2428
- Fucikova J, Becht E, Goc J, Iribarren C, Remark R, Damotte D, Alifano M, Devi P, Biton J, Germain C et al. Calreticulin is a powerful prognostic marker for survival of non-small-cell lung cancer patients. Cancer Res. 2016 Apr 1; 76(7):1746-56; PMID:26842877; http://dx.doi.org/10.1158/0008-5472
- Shedden K, Taylor JM, Enkemann SA, Tsao MS, Yeatman TJ, Gerald WL, Eschrich S, Jurisica I, Giordano TJ, Misek DE et al. Gene expression-based survival prediction in lung adenocarcinoma: a multi-site, blinded validation study. Nat Med 2008; 14:822-7; PMID:18641660; http://dx.doi.org/10.1038/nm.1790
- Stoll G, Bindea G, Mlecnik B, Galon J, Zitvogel L, Kroemer G. Meta-analysis of organ-specific differences in the structure of the immune infiltrate in major malignancies. Oncotarget 2015; 6:11894-909; PMID:26059437; http://dx.doi.org/10.18632/oncotarget.4180
- Galon J, Angell HK, Bedognetti D, Marincola FM. The continuum of cancer immunosurveillance: prognostic, predictive, and mechanistic signatures. Immunity 2013; 39:11-26; PMID:23890060; http://dx.doi.org/10.1016/j.immuni.2013.07.008
- Musahl AS, Huang X, Rusakiewicz S, Ntini E, Marsico A, Kroemer G, Kepp O, Ørom UA. A long non-coding RNA links calreticulin-mediated immunogenic cell removal to RB1 transcription. Oncogene 2015; 34:5046-54; PMID:25579178; http://dx.doi.org/10.1038/onc.2014.424
- Garg AD, Elsen S, Krysko DV, Vandenabeele P, de Witte P, Agostinis P. Resistance to anticancer vaccination effect is controlled by a cancer cell-autonomous phenotype that disrupts immunogenic phagocytic removal. Oncotarget 2015; 6:26841-60; PMID:26314964; http://dx.doi.org/10.18632/oncotarget.4754
- Ladoire S, Enot D, Senovilla L, Ghiringhelli F, Poirier-Colame V, Chaba K, Semeraro M, Chaix M, Penault-Llorca F, Arnould L et al. The presence of LC3B puncta and HMGB1 expression in malignant cells correlate with the immune infiltrate in breast cancer. Autophagy. 2016 May 3; 12(5):864-75; PMID:26979828; http://dx.doi.org/10.1080/15548627.2016.1154244
- Ladoire S, Penault-Llorca F, Senovilla L, Dalban C, Enot D, Locher C, Prada N, Poirier-Colame V, Chaba K, Arnould L et al. Combined evaluation of LC3B puncta and HMGB1 expression predicts residual risk of relapse after adjuvant chemotherapy in breast cancer. Autophagy 2015; 11:1878-90; PMID:26506894; http://dx.doi.org/10.1080/15548627.2015.1082022
- Snyder A, Makarov V, Merghoub T, Yuan J, Zaretsky JM, Desrichard A, Walsh LA, Postow MA, Wong P, Ho TS et al. Genetic basis for clinical response to CTLA-4 blockade in melanoma. N Engl J Med 2014; 371:2189-99; PMID:25409260; http://dx.doi.org/10.1056/NEJMoa1406498
- R Development Core Team. R: A Language and Environment for Statistical Computing. Vienna, Austria, 2008.
- Gautier L, Cope L, Bolstad BM, Irizarry RA. affy–analysis of Affymetrix GeneChip data at the probe level. Bioinformatics (Oxford, England) 2004; 20:307-15; PMID:14960456; http://dx.doi.org/10.1093/bioinformatics/btg405
- Love MI, Huber W, Anders S. Moderated estimation of fold change and dispersion for RNA-seq data with DESeq2. Genome Biol 2014; 15:550; PMID:25516281; http://dx.doi.org/10.1186/s13059-014-0550-8
- Ritchie ME, Phipson B, Wu D, Hu Y, Law CW, Shi W, Smyth GK. limma powers differential expression analyses for RNA-sequencing and microarray studies. Nucleic Acids Res 2015; 43:e47; PMID:25605792; http://dx.doi.org/10.1093/nar/gkv007
- Stoll G, Enot D, Mlecnik B, Galon J, Zitvogel L, Kroemer G. Immune-related gene signatures predict the outcome of neoadjuvant chemotherapy. Oncoimmunology 2014; 3:e27884; PMID:24790795; http://dx.doi.org/10.4161/onci.27884
- Fraley C, Raftery AE. Model-based clustering, discriminant analysis and density estimation. J Am Statistical Association 2002; 97:611-31; http://dx.doi.org/10.1198/016214502760047131
- Therneau TM, Grambsch PM. Modeling Survival Data: Extending the Cox Model. New York: Springer, 2000.
- Therneau T. (2015). A Package for Survival Analysis in S. version 2.38. http://CRAN.R-project.org/package=survival.