
ABSTRACT
Recent advances in cancer treatment with checkpoint blockade of receptors such as CTLA-4 and PD-1 have demonstrated that combinations of agents with complementary immunomodulatory effects have the potential to enhance antitumor activity as compared to single agents. We investigated the efficacy of immune-modulatory interleukin-21 (IL-21) combined with checkpoint blockade in several syngeneic mouse tumor models. After tumor establishment, mice were administered recombinant mouse IL-21 (mIL-21) alone or in combination with blocking monoclonal antibodies against mouse PD-1 or CTLA-4. In contrast to monotherapy, IL-21 enhanced antitumor activity of mCTLA-4 mAb in four models and anti-PD-1 mAb in two models, with evidence of synergy for one or both of the combination treatments in the EMT-6 and MC38 models. The enhanced efficacy was associated with increased intratumoral CD8+ T cell infiltrates, CD8+ T cell proliferation, and increased effector memory T cells, along with decreased frequency of central memory CD8+ T cells. In vivo depletion of CD8+ T cells abolished the antitumor activities observed for both combination and monotherapy treatments, further supporting a beneficial role for CD8+ T cells. In all studies, the combination therapies were well tolerated. These results support the hypothesis that the combination of recombinant human IL-21 with CTLA-4 or PD-1 monoclonal antibodies could lead to improved outcomes in cancer patients.
Introduction
Tumor progression depends, in part, on the interaction of tumor cells with the tumor microenvironment. Tumor immune infiltrates are composed of multiple cell types, some of which antagonize antitumor immune responses. Effector T cells are often present but unable to eliminate tumor cells due to antagonism by myeloid-derived suppressor cells and T regulatory (Treg) cells as well as tumor-enforced inhibitory mechanisms. Because there are multiple mechanisms of immune suppression operating in the tumor microenvironment, therapy with a combination of immunomodulatory agents is emerging as an attractive option in the management of cancer. One such approach that has been clinically validated is co-blockade with monoclonal antibodies (mAbs) of the key regulatory receptors CTLA-4 (cytotoxic T lymphocyte antigen 4; CD152) and PD-1 (programmed cell death-1; CD279), also known as “checkpoint inhibitors”.Citation1,2,3 The addition of immunoregulatory cytokines, such as interleukin (IL) 2 (IL-2), IL-7, IL-12, and IL-21, is also being evaluated.Citation4
IL-21, a member of the common gamma chain cytokine family, is produced by activated CD4+ T cells and natural killer T (NK-T) cells.Citation5 IL-21 stimulates expansion and increases cytotoxicity of CD8+ T cells, enhances T cell-dependent B cell proliferation and antibody production, facilitates differentiation and activation of NK cells (including enhancement of NK cell-mediated antibody-dependent cellular cytotoxicity [ADCC]), and reduces Treg cells in tumors.Citation6-11 In addition, IL-21 has been reported to be angiostatic.Citation12 Treatment with recombinant human IL-21 (rIL-21) has been shown to produce antitumor activity in nonclinical and clinical studies.Citation13,14 Pharmacokinetics (PK) of rIL-21 are dose-dependent, and its estimated terminal half-life ranges between 1 and 4 hours in humans and cynomolgus monkeys.Citation15,16,17 Pharmacodynamic analyses of rIL-21-treated patients indicate that rIL-21 can activate multiple cell types and immune response pathways.Citation18
PD-1 and CTLA-4 are inhibitory members of the CD28 family of T cell receptors. CTLA-4 is primarily localized in intracellular stores in T cells and, upon stimulation, is transported to the cell surface. Antibody blockade of CTLA-4 interaction with its ligands, CD80 and CD86, allows for CD28 costimulation and superior T cell activity.Citation19 The administration of CTLA-4 blocking mAbs to tumor-bearing mice promotes tumor growth delays and rejections.Citation3,20 In clinical trials, ipilimumab, a human anti-human CTLA-4 mAb, has demonstrated significant enhancement of overall survival in melanoma patients as a monotherapy.Citation21 PD-1 is highly expressed on activated T and B cells. PD-1 ligands have been identified as programmed death-ligand 1 (PD-L1, also known as B7-H1 or CD274) and PD-L2 (also known as B7-DC or CD273). PD-L1 and PD-L2 have been shown to down-regulate T cell activation upon binding to PD-1.Citation22 Blockade of PD-1 suppresses its negative signal and amplifies T cell responses, and PD-1 blockade in the clinic (e.g., with nivolumab, anti-human PD-1 mAb) has elicited durable antitumor responses and long-term remissions in a subset of patients with a broad spectrum of cancers.Citation23
To test the concept that a combination of IL-21 administration and checkpoint blockade could enhance antitumor responses, we evaluated the efficacy of recombinant mouse IL-21 (mIL-21) and anti-mouse (m) CTLA-4 and -mPD-1 antibodies injected alone or in combination in syngeneic mouse tumor models.
Results
Subcutaneous EMT-6 model
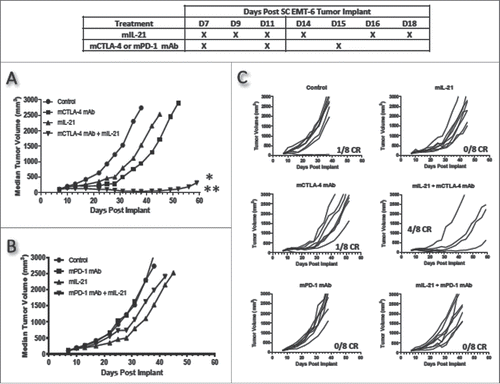
When tested for antitumor activity in EMT-6 mammary carcinoma-bearing mice, mIL-21 and mCTLA-4 mAb monotherapies each had weak efficacy, while the combination resulted in synergistic activity, with 4 of the 8 mice exhibiting complete tumor regressions (CR) and 3 more of the 8 mice showing marked delays in tumor growth (, ). In contrast, treatment with mPD-1 mAb was ineffective in this model, and the mPD-1 mAb + mIL-21 combination treatment was no more effective than single agent mIL-21 in terms of delayed tumor growth (, ).
Figure 1. mIL-21 combined with either mCTLA-4 or mPD-1 mAb in the EMT-6 mammary carcinoma tumor model. (A) Antitumor activity of mIL-21 (50 μg/mouse) and mCTLA-4 mAb (clone UC10-4F10; 400 μg/mouse) and (B) antitumor activity of mIL-21 (50 μg/mouse) and PD-1 mAb (clone 4H2-mIgG1; 200 μg/mouse), when administered alone or in combination on the days indicated in the table. Median tumor volumes (left hand panels) and individual tumor volumes (right hand panels) are plotted vs. days post implant for control (untreated; circles), mCTLA-4 or mPD-1 mAb- (squares), mIL-21- (triangles), or mIL-21 + mAb (inverted triangles)-treated groups. CR = complete regression. Asterisks (*, **) indicate p < 0.05 or p < 0.01, respectively, for differences between the mCTLA-4 mAb + mIL-21 combination group and the mCTLA-4 mAb group (p < 0.05), or the combination group and either the control or mIL-21 group (p < 0.01) for ‘treatment effect’ by 2-way repeated-measures ANOVA. Data are representative of results from two separate studies.
Subcutaneous and intravenous B16-F10 models
These IL-21/mAb combination treatments were also investigated for antitumor activity in both SC and IV versions of the B16-F10 melanoma model. As these tumors are poorly immunogenic and unresponsive to therapy in the absence of vaccination, we tested higher doses of mIL-21 and mAbs than those used in other models. Although not statistically significant, the combination of mIL-21 with mPD-1 mAb in B16-F10 SC tumor-bearing mice slightly delayed tumor growth and prolonged survival as compared to treatment with PBS control or monotherapies (Supplemental Figure 1B). The mCTLA-4 mAb + mIL-21 combination treatment was as effective as the mPD-1 mAb + mIL-21 combination, but only in a few of the mice in each group (Supplemental Figure 1C). Although none of the mice were tumor-free (CR) by the end of the study (day 39), treatments consisting of mIL-21 with either mCTLA-4 mAb or mPD-1 mAb resulted in smaller tumors in a subset of mice as compared to PBS control or monotherapies (Supplemental Figure 1C).
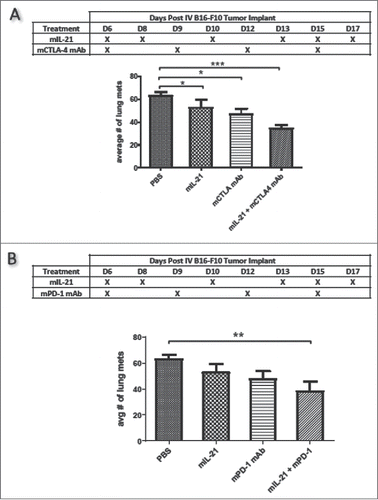
The IV implantation of B16-F10 cells enabled evaluation of metastatic tumor growth as the tumor cells preferentially home to the lung. In this model, mice treated with a combination of mIL-21 with either mCTLA-4 mAb () or mPD-1 mAb () had significantly fewer lung metastases than mice administered PBS control (p < 0.001 and p < 0.01, respectively by one-way ANOVA) or mIL-21, mCTLA-4 mAb, or mPD-1 mAb alone, though none of the mice were rendered tumor-free in this aggressive model.
Figure 2. mIL-21 combined with mCTLA-4 or mPD-1 mAb in the IV B16-F10 lung metastatic melanoma model. (A) Antitumor activity of mIL-21 (75 μg/mouse) and mCTLA-4 mAb (9D9-mIgG2b; 300 μg/mouse), alone or in combination, on day 20 post-tumor cell implant. (B) Antitumor activity of mIL-21 (75 μg/mouse) and mPD-1 mAb (4H2-mIgG1; 300 μg/mouse), alone or in combination, on day 20 post-cell implant. Mean values +/− SEM are shown. Asterisks (*, **, ***) indicate p < 0.05, 0.01 or 0.001, respectively, for differences between groups by one way ANOVA. There were no other statistically significant differences between groups. Data are representative of results from two separate studies.
Subcutaneous MC38 model
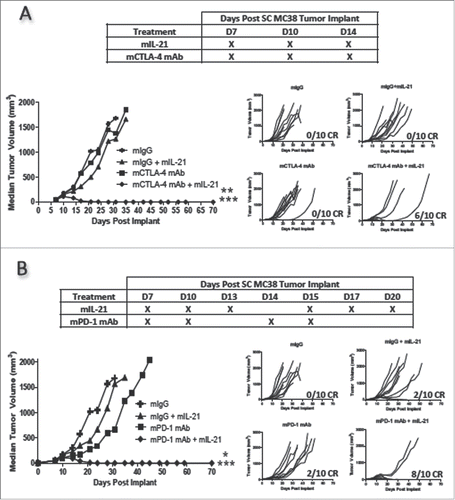
In the MC38 colon carcinoma model, administration of mIL-21, mCTLA-4 mAb, or mPD-1 mAb as single agents to tumor-bearing mice resulted in minimal antitumor activity (). By contrast, 200 µg mIL-21 in combination with 200 µg mCTLA-4 mAb (), or 50 µg mIL-21 combined with 200 µg mPD-1 mAb () resulted in statistically significant, synergistic antitumor activity as compared to single agents (p < 0.001 – 0.05, ). A higher dose (200 µg) of mIL-21 was initially tested in combination with mCTLA-4 mAb in this model, but was reduced to 50 µg in combination with mPD-1 mAb when it was evident that the combinations were effective.
Figure 3. mIL-21 combined with either mCTLA-4 or mPD-1 mAb in the MC38 colon carcinoma tumor model. (A) Antitumor activity of mIL-21 (200 μg/mouse) and mCTLA-4 mAb (9D9-mIgG2b; 200 μg/mouse) administered alone or in combination on the days indicated in the table. (B) Antitumor activity of mIL-21 (50 μg/mouse) and PD-1 mAb (4H2-mIgG1; 200 μg/mouse), administered alone or in combination on the days indicated. Median tumor volumes (left hand panels) and individual tumor volumes (right hand panels) are plotted vs. days post-tumor cell implant for mIgG1 control- (crosses), mIgG1 + mIL-21- (triangles), mCTLA-4 or mPD-1 mAb- (squares), or mIL-21 + mAb- (diamonds)-treated groups. For Panel A, asterisks (**, ***) indicate p < 0.01 or p < 0.001, respectively, for differences between the mCTLA-4 mAb + mIL-21 combination group and either the mCTLA-4 mAb group or mIL-21 group (each comparison is p < 0.01), or the combination group and the mIgG control group (p < 0.001) for ‘treatment effect’ by 2-way repeated measures ANOVA. For Panel B, asterisks (*, ***) indicate p < 0.05 or p < 0.001, respectively, for differences between the mPD-1 mAb + mIL-21 combination group and either the mPD-1 mAb group or mIL-21 group (each comparison is p < 0.05), or the combination group and the control group (p < 0.001) for ‘treatment effect’ by 2-way repeated measures ANOVA. CR = complete regression. Data are representative of results from two separate studies.
Additional MC38 tumor studies were conducted with mIL-21 and mPD-1 mAb treatments to determine whether staggering the two treatments might influence the antitumor efficacy of the combination. Indeed, when mIL-21 was administered 4 days prior to mPD-1 mAb (‘mIL-21 … mPD-1 mAb’), or the converse (‘mPD-1 mAb … mIL-21’), the antitumor effects of the staggered combination were not as striking as when the two agents were administered together (Supplemental Figure 2). Furthermore, concurrent treatments with mIL-21 and mPD-1 mAb were the most potent regimen, as evidenced by the highly significant differences in reduced tumor growth over time for the ‘mIL-21 + mPD-1 mAb’ group vs. the control group, vs. both monotherapy groups, and vs. the ‘mIL-21…mPD-1 mAb’ group (all p < 0.0001), and a more modestly significant difference vs. the ‘mPD-1 mAb…mIL-21’ group (p < 0.05). The next most efficacious treatment was ‘mPD-1 mAb … mIL-21,’ which showed a highly significant reduction in tumor growth over time vs. the mIgG control group (p < 0.001) and a more modest decrease in tumor growth over time vs. the monotherapy and ‘mIL-21…PD-1 mAb’ groups (p < 0.05). The ‘mPD-1 mAb alone’, ‘mIL-21 alone’, and ‘mIL-21 … mPD-1 mAb’ treatment groups tended to have some reductions in tumor growth over time but were not statistically different than the mIgG control-treated group. Kaplan-Meier survival curves for each group supported this rank order (Supplemental Figure 2B).
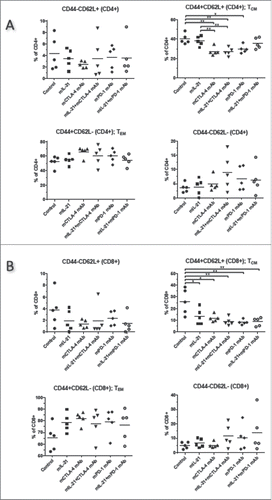
To explore the mechanism(s) responsible for the observed antitumor activities, immunophenotyping was performed on tumor infiltrating lymphocytes (TILs) and tumors using flow cytometry and IHC, respectively. Flow cytometry analysis of TILs from MC38-implanted mice harvested on study day 13 revealed a significantly increased percentage of CD8+ lymphocytes among CD45+ cells in groups treated with either mPD-1 mAb or mCTLA-4 mAb in combination with mIL-21, as compared to control mice (). Treatment of MC38-implanted mice with either treatment of MC38-implanted mice with either of these combinations also significantly increased the proportion of proliferating (Ki67+) CD8+ T cells with an effector memory (CD44+CD62 L-) phenotype in the tumor ( and ). IHC analyses of MC38 tumors harvested at this same time point indicated that CD8+ cells cluster at the tumor periphery in the PBS and mIL-21 treated groups (, ), whereas mCTLA-4 mAb and mPD-1 mAb induce infiltration and dissemination of the CD8+ cells throughout the tumor (, ), with mIL-21 addition to either mAb treatment enhancing this effect (, ). Combining mIL-21 with either mPD-1 mAb or mCTLA-4 mAb in the MC38 model modestly, though not statistically significantly, increased the percentage of effector memory T cells (TEM; CD44+CD62 L-) and decreased the percentage of central memory T cells (TCM; CD44+CD62 L+) in day 13 TIL, as compared to TILs in control or mIL-21-treated mice (). CD8+ TCM were significantly reduced in all treatment groups versus the control group ().
Figure 4. Combination treatment enhances CD8+ T cell infiltration into tumors in the MC38 colon carcinoma model. (A) TILs were isolated from MC38 tumors on day 13 after implantation and analyzed by flow cytometry. The percentage of CD8+ cells in the total CD45+ population and the percentage of Ki67+CD8+ T cells for each treatment group are plotted. Each symbol represents data from one mouse in the group and mean values are indicated with horizontal lines. Asterisks (*) indicate p < 0.05 for differences between the groups indicated by 1-way ANOVA. (B-G) Tumors isolated in A were frozen in OCT, sectioned, and stained for CD8-expressing cells. Treatment groups were as follows: (B) PBS-treated control, (C) 50 µg mIL-21, 3 times per week, 6 total doses, (D) 200 µg mCTLA-4 mAb (9D9-mIgG2b), every 4 days, 2 total doses, (E) 50 µg mIL-21 plus 200 µg mCTLA-4 mAb, every 4 days, 2 total doses. (F) 200 µg mPD-1 mAb (4H2-mIgG1; 3 doses). (G) 50 µg mIL-21 (6 doses) plus 3 doses of 200 µg mPD-1 mAb. Bar = 100 µm. Study was conducted once.
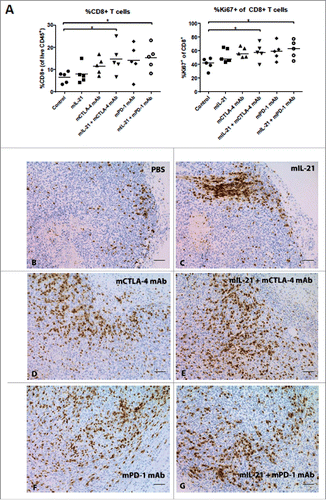
Figure 5. Memory T cell subsets in TILs from MC38 tumors in mice treated with mIL-21 +/− mPD-1 or mCTLA-4 mAbs. TILs from mice implanted SC with MC38 tumor cells and treated as described in with PBS, mIL-21, mCTLA-4 mAb (9D9-mIgG2b), mPD-1 mAb (4H2-mIgG1), or mIL-21 + mPD-1 or mCTLA-4 mAbs were isolated on study day 13, stained with various markers of immune cell subsets, and evaluated by flow cytometry. The %CD44-CD62 L+ (upper left), %CD44+CD62 L+ (TCM; upper right), %CD44+CD62 L- (TEM; lower left), and %CD44-CD62 L- (lower right) among live CD45+ (A) CD4+ or (B) CD8+ cells, are shown for each treatment group, indicated on the x-axes. Each symbol represents data from one mouse in the group and mean values are indicated with horizontal lines. Asterisks (*, **) indicate p < 0.05 or p < 0.01, respectively, for differences between the groups indicated by 1-way ANOVA. Study was conducted once.
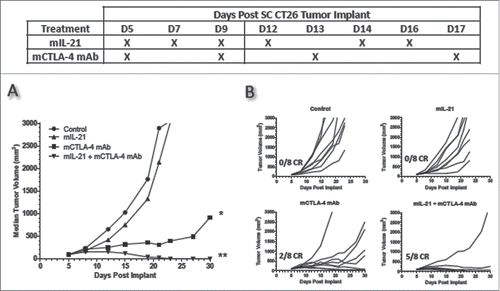
Subcutaneous CT26 model
Treatment of CT26-tumor-bearing mice with mIL-21 alone or in combination with either mAb showed that the most efficacious treatment regimen was mIL-21 combined with mCTLA-4 mAb (). Treatment with mPD-1 mAb—either with or without mIL-21—had no antitumor activity in this model (; absence of mPD-1 mAb monotherapy activity is also reported in CitationRef. 3).
Figure 6. Addition of mIL-21 improves antitumor activity of mCTLA-4 mAb in the CT26 colon carcinoma model. Antitumor activity of mIL-21 (50 μg/mouse) and anti-mCTLA-4 mAb (clone UC10-4F10; 400 μg/mouse) when administered alone or in combination on the days indicated in the table. Median tumor volumes (left hand panel) and individual tumor volumes (right hand panels) are shown. CR = complete regression. Asterisks (*, **) indicate p < 0.05 or p < 0.01, respectively, for differences between the mCTLA-4 mAb group and either the control group or mIL-21 group (each comparison is p < 0.05), or the mCTLA-4 + mIL-21 combination group and either the control group or mIL-21 group (each comparison is p < 0.01) for ‘treatment effect’ by 2-way repeated measures ANOVA. Data are representative of results from two separate studies.
On day 16 post-tumor cell implantation, TILs from mice implanted SC with CT26 tumor cells and treated with mIL-21 alone or in combination with mPD-1 mAb or mCTLA-4 mAb were characterized by flow cytometry ( and Supplemental Figure 3). There were no statistically significant differences among any of the treatment groups in the percentage of CD8+ TILs (). CT26 tumors harvested from the mCTLA-4 mAb treatment group contained decreased percentages of CD4+CD25+FoxP3+ (Treg) T cells compared to the other treatment groups, and this effect was significantly enhanced by the addition of mIL-21 (), an observation consistent with the high degree of antitumor activity with this combination. CD335+ (NK) cells slightly, though not significantly, increased in the mPD-1 mAb-treated groups, but decreased on day 16 in CT26-implanted mice administered mCTLA-4 mAb in combination with mIL-21 (). Groups treated with mCTLA-4 mAb +/− mIL-21 (the more efficacious treatments) had a reduced percentage of CD69+, among the CD4+, CD8+, and NK cells (data not shown), and an increased percentage of PD-1+CD69- (effector) CD8+ T cells (). CD69 is a marker of early T and NK cell activation, and its expression can also be associated with chronically activated T cells and T cell exhaustion.Citation24 In addition, PD-1 expression levels, another marker of exhausted T cells, were decreased in CD8+, but not in CD4+, TILs from CTLA-4 mAb-treated mice (Supplemental Figure 3). The mIL-21 + mCTLA-4 mAb combination treatment also yielded the highest CD8+ T effector/Treg ratio in the TILs of any of the treatment groups (), again consistent with the greatest antitumor activity observed.Citation25 Treg levels in the mPD-1 mAb treatment groups were relatively unchanged vs. the control group ( and ), consistent with the lack of antitumor efficacy in the mPD-1 mAb-treated groups in the CT26 model (see ).
Figure 7. TIL immunophenotypes in CT26 tumors from mice treated with mIL-21 +/− mPD-1 or mCTLA-4 mAbs. TILs from mice implanted SC with CT26 tumor cells and treated with control mIgG, mIL-21, mCTLA-4 mAb (9D9-mIgG2b), mPD-1 mAb (4H2-mIgG1), or mIL-21 + mPD-1 or mCTLA-4 mAbs were isolated on study day 16, stained with various markers of immune cell subsets, and evaluated by flow cytometry. The (A) %CD8+ of live CD45+, (B) %CD25+FoxP3+ of CD4+, (C) %CD335+ of live CD45+, and (D) %PD-1+CD69- of CD8+ cells, are shown for each treatment group, indicated on the x-axes. The (E) ratios of the % CD8+ T cells of live CD45+ (Teff) to the % CD4+CD25+ of live CD45+ (Tregs) are plotted. Each symbol represents data from one mouse in the group and mean values are indicated with horizontal lines. Asterisks (*, **, ***, ****) indicate p < 0.05, p < 0.01, p < 0.001 or p < 0.0001, respectively, for differences between the groups indicated by 1-way ANOVA. Study was conducted one time.
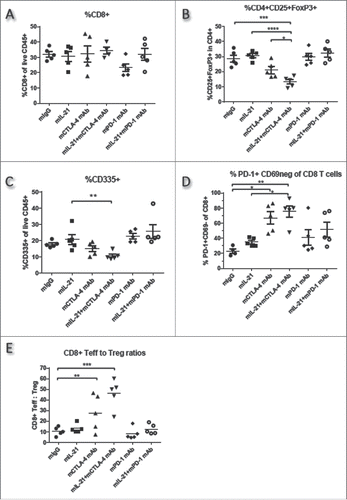
Figure 8. Effect of immune cell subset depletion on mIL-21 + CTLA-4 or PD-1 blockade in the MC38 and CT26 models. (A) Mice implanted SC with (A) MC38 or (B) CT26 tumor cells were injected IP with PBS (upper left), or depleting mAbs directed against CD4+ (upper right), CD8+ (lower left), or NK (lower right) cells on days 3, 9, and 16 post-tumor implant. Two days after initiating depleting mAb treatment, the mice were administered PBS (x's), mCTLA-4 mAb (9D9-mIgG2b, 200 μg/mouse; filled circles), mIL-21 (50 μg/mouse; filled diamonds), a combination of mIL-21 and mCTLA-4 mAb (open circles), mPD-1 mAb (4H2-mIgG1, 200 μg/mouse; filled squares), or a combination of mIL-21 and mPD-1 mAb (open squares). Median tumor volumes (mm3) are plotted vs. days post tumor cell implant. Data are representative of results from two separate studies. See Supplemental Table 1 for statistical analyses.
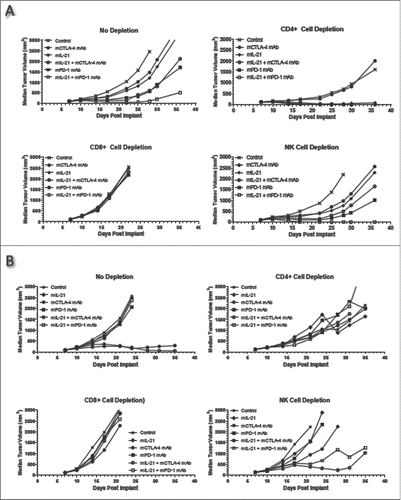
Lymphocyte subset depletion experiments in MC38 and CT26 models
Cell subset depletion experiments in the MC38 and CT26 tumor models were conducted to investigate the contribution of lymphocyte subsets involved in mediating the antitumor activity induced by mCTLA-4 mAb, mPD-1 mAb, and mIL-21. CD8+ T cells were shown to be critical for this activity as in vivo depletion of this cell subset abolished the antitumor effect of both mIL-21 + CTLA-4 mAb and mIL-21 + PD-1 mAb combination therapy, as well as each monotherapy, in both tumor models (). However, there was no change in antitumor activity in NK cell-depleted mice given mIL-21 + mCTLA-4 mAb, and perhaps even a modest enhancement of the activity of mIL-21 + mPD-1 mAb in both models ( and , lower right hand panels). A more obvious enhancement of mIL-21 + mPD-1 mAb antitumor activity was observed in NK cell-depleted mice in the CT26 model (, lower right hand panel), particularly notable since mPD-1 mAb, with or without mIL-21, does not typically demonstrate antitumor efficacy in the CT26 model (, upper left hand panel; see also CitationRef. 3).
In vivo CD4+ cell depletion enhanced the antitumor efficacy of the mIL-21 + mCTLA-4 mAb and the mIL-21 + mPD-1 mAb combinations in the MC38 model (, upper right hand panel), which might reflect depletion of immunosuppressive Treg cells in the tumors. However, CD4+ cell depletion reduced the efficacy of mCTLA-4 mAb, with or without mIL-21, in the CT26 model (, upper right hand panel), supporting the notion that immune control of the MC38 and CT26 tumors—at least as mediated by CTLA-4 blockade—mechanistically differs between these models.
Discussion
Efficient and productive adaptive immune responses to tumors require the orchestration of various signaling pathways. Pharmacological interventions that modulate T cell responses via blockade of CTLA-4 or PD-1, or signaling through the IL-21 receptor have demonstrated activity in nonclinical and clinical studies.Citation26-30 IL-21 has previously been shown to enhance the efficacy of a triple agonistic mAb combination (anti-DR5/anti-CD40/anti-CD137) in mouse models of advanced breast, renal, and colon carcinomas.Citation31 Antitumor efficacy has also been observed in a mouse model of neuroblastoma in which IL-21 was combined with an anti-CD4 mAb,Citation32 and a more recent publication reports synergistic antitumor efficacy of IL-21 and soluble PD-1 delivered by gene transfer in the H22 mouse hepatocellular carcinoma model.Citation33
Based on their complementary mechanisms of action, we hypothesized that the combination of mCTLA-4 mAb or mPD-1 mAb with mIL-21 could produce enhanced antitumor efficacy in mouse tumor models. In general, the efficacy of PD-1 mAb or CTLA-4 mAb in SC tumor models is not related to the tissue origin of the tumor as much as to the inherent immunogenicity of the tumor itself, which is why we chose to investigate the efficacy of combination treatment with mIL-21 in a relatively wide variety of tumor models. For instance, although MC38 and CT26 are both colorectal tumors responsive to multiple immunotherapies, they do display differential sensitivity to anti-PD-1 and anti-CTLA-4 (, , , and Supplemental Figure 2). In a series of studies using 4 different tumor types (MC38, EMT-6, CT26, and B16-F10), both mCTLA-4 and mPD-1 mAb given concurrently with mIL-21 each elicited enhanced efficacy in 2 of the 4 models evaluated (MC38 and B16-F10) compared with the activity observed with each agent alone, while the combination of mIL-21 and mCTLA-4 mAb (but not mPD-1 mAb) also enhanced efficacy over monotherapy in the CT26 model (results summarized in ). The inability of mIL-21 to promote antitumor activity with anti-mPD-1 mAb is perhaps a reflection of the lack of mPD-1 mAb activity in the CT26 model as a single agent and that mIL-21 is only able to enhance pre-existing T-cell responses. In the MC38 model, combinations of mCTLA-4 or mPD-1 mAbs with mIL-21 significantly boosted CD8+ T cell recruitment into the tumors over PBS control (), whereas no statistically significant enhancement of CD8+ T cell infiltration was observed in the CT26 model with either combination (). The reasons for the varying effects of mIL-21 on CD8+ T cell infiltration in these two models are not clear.
Table 1. Summary of antitumor efficacy of mIL-21+mCTLA-4 mAb or mPD-1 mAb.
In the EMT-6 model, mIL-21 and mCTLA-4 mAb monotherapy regimens each induced delayed tumor growth, while mPD-1 mAb monotherapy was ineffective (). Synergistic antitumor efficacy was observed for mice treated with mIL-21 + mCTLA-4 mAb (, ). Combination treatment with mIL-21 and mPD-1 mAb did modestly enhance antitumor responses compared to mPD-1 mAb alone, though the differences between these groups in tumor growth over time were not statistically significant (, ).
Variably enhanced antitumor effects were observed with mIL-21 in combination with mCTLA-4 mAb or mPD-1 mAb in both the B16-F10 SC and IV metastasis tumor models. Greater efficacy was observed in the IV model, as evidenced by significantly decreased numbers of melanoma metastases in the lungs (). The B16-F10 mouse melanoma models are difficult models in which to demonstrate efficacy of antitumor therapeutics as the tumors grow aggressively and are considered poorly immunogenic. In addition, demonstrating antitumor efficacy is more difficult when treatments are started after the establishment of tumors, as was done in all the studies described here. Mouse IL-21 has previously been shown to promote antitumor activity in the metastatic and solid tumor B16-F10 models, but only when dosed at a greater frequency (i.e., daily injections as compared to 3 times weekly, as in the studies reported here) and/or when treatment was initiated prior to tumor implantation.Citation34 Although the PK of mIL-21 has not yet been reported, it is likely to be similar to that of human rIL-21 and other cytokines, with a relatively short terminal half-life (e.g., < 4 h), although its pharmacodynamic effects are apparent for much longer.Citation15,16,17 It is certainly notable that, even with the dosing regimens and delayed treatment start used here, the combination of mIL-21 and mCTLA-4 mAb or mPD-1 mAb was able to significantly reduce the number of lung surface metastases in the IV B16-F10 model, and to modestly reduce tumor burden in a subset of treated mice in the SC B16-F10 model ( and Supplemental Figure 1).
Synergistic activity was observed in MC38 tumor-bearing mice treated with either mCTLA-4 mAb or mPD-1 mAb in combination with mIL-21. In this model, single agent therapy with mIL-21, mCTLA-4 mAb, or mPD-1 mAb at 200 µg per mouse showed little efficacy; however, combination therapies induced significant increases in the frequency of CD8+ lymphocytes within the tumors and enhanced antitumor responses (–, and Supplemental Figure 2). These studies indicate that synergistic activity could be achieved with the IL-21/mAb combinations in models where the monotherapeutic regimens are at least weakly efficacious, a concept that may have translational relevance. Combining mIL-21 with either mPD-1 mAb or mCTLA-4 mAb modestly increased the percentage of TEM cells and decreased the percentage of TCM cells in MC38 TILs, as compared to TILs in control mice (). Moreover, the increased percentage of CD8+ (though not the CD4+) T cells in TILs with this combination were also Ki67+ (), consistent with the notion that the cells recruited to the tumor were actively proliferating. In addition to the antitumor efficacy reported here, we observed no increases in mortality, body weight changes, or clinical signs of toxicity in mice administered multiple doses of mIL-21 (up to 200 µg/mouse) as a single agent or in any combination with blocking antibodies (data not shown).
Our investigations (n = 2) of the effects of staggered doses of mIL-21 and the mPD-1 mAb in the MC38 model revealed that the timing of dosing is indeed important (Supplemental Figure 2; see also CitationRef. 3). Administration of mIL-21 prior to mPD-1 mAb tended to be less effective than treatment with mPD-1 mAb alone, whereas mIL-21 dosing could be delayed following mAb treatment and still induce moderate yet significant antitumor efficacy; the optimal schedule tested, however, was concurrent therapy of mIL-21 + mPD-1 mAb (Supplemental Figure 2). It is not clear why the mIL-21 followed by mPD-1 mAb tended to be less effective than mPD-1 mAb alone, though based on the results of the cell subset depletion experiments () one possibility is that mIL-21 might induce at least a subset of “regulatory” NK cells that suppress mPD-1 mAb activity. Further experiments will be necessary to address this question.
Phenotypic analysis of TILs was also conducted with CT26 colon carcinomas ( and Supplemental Figure 3). The most efficacious treatment in this model was the combination of mIL-21 with mCTLA-4 mAb ( and ). Analysis of TILs from this group at study day 16 revealed significant decreases in the percentages of Tregs (CD4+CD25+FoxP3+) and significant increases in the percentage of PD-1+CD69- CD8+ T cells as compared to the control group (, ), each associated with properties promoting antitumor responses. The lack of significantly increased CD8+ cells in the CTLA-4 mAb-treated groups in this CT26 model () was somewhat surprising, given that CD8+ T cells seem to play an important role in CT26 tumor rejection (), though the balance of CD8+ Teff and Tregs appears likely to be more important for antitumor responses. The increased Teff/Treg ratio observed in the mCTLA-4 mAb-treated groups (), consistent with enhanced antitumor responses, may be due in part to depletion of Tregs and expansion of Teffs.Citation26,35 Treg depletion via ADCC/ADCP may occur following treatment with mIL-21 and the CTLA-4 (9D9) mIgG2b mAb, which is a plausible mechanism of action for the mIL-21/mCTLA-4 mAb therapeutic combination. In addition, PD-1 expression by MFI was decreased on CD8+, but not on CD4+, T cells in TILs from CT26 groups treated with mCTLA-4 mAb relative to controls (Supplemental Figure 3). As high levels of PD-1 expression are associated with T cell exhaustion,Citation22 the lower PD-1 levels on CD8+ T cells suggests that CTLA-4 mAb is antagonizing CD8+ T cell exhaustion. The observed decrease in Tregs () is consistent with the known immunoregulatory properties of anti-CTLA-4.Citation25,36 Mice treated with mCTLA-4 mAb +/− mIL-21 also had an increased percentage of PD-1+CD69- (effector) CD8+ T cells (), suggesting an enhanced effector phenotype for CD8+ T cells, as well as reduced T cell exhaustion, mediate the antitumor activity.Citation24,37 No significant differences were observed between groups in macrophage or dendritic cell populations, as interrogated by CD11b and CD11c staining (data not shown).
Collectively, our analyses of TILs in both the MC38 and CT26 models imply that depleting the intratumoral Tregs, amplifying the CD8+ effector T cell response, and/or reversing the exhausted T cell phenotype are the primary mechanisms of enhanced antitumor efficacy of the mIL-21 + mCTLA-4 mAb combination treatment in these tumor models.
Further supporting a role of CD8+ T cells in the greater antitumor activity observed with the combination therapies, in vivo cell depletion studies indicated that the loss of CD8+ T cells was particularly detrimental, abolishing this antitumor activity. Somewhat surprisingly, given IL-21's known enhancement of NK cell activity, including augmentation of NK IFNγ production,Citation38-40 there was little change in antitumor activity in MC38-bearing NK cell-depleted mice treated with mIL-21 + mCTLA-4 mAb (). Moreover, NK cell depletion resulted in perhaps even a modest enhancement of the activity of mIL-21 + mPD-1 mAb in both the MC38 and CT26 models (). This might reflect negative NK cell regulation of antitumor T cell responses, perhaps by a subset of the NK cells. This hypothesis is further supported by the observation that CD335+ NK cells tended to be slightly increased () in the mPD-1 mAb-treated mice (where antitumor activity was lacking), but decreased in CT26-implanted mice treated effectively () with mCTLA-4 mAb alone or in combination with mIL-21. A more detailed analysis of the functional capacity of the TIL NK cells in the CT26 model will be needed to resolve this issue.
In summary, the combination of mIL-21 with mCTLA-4 or mPD-1 mAbs was well tolerated and resulted in enhanced antitumor activity in several mouse tumor models. Enhanced efficacy with the addition of mIL-21 was observed in models where mCTLA-4 mAb or mPD-1 mAb alone produced minimal antitumor activity (B16-F10), as well as in models where the mAbs were somewhat efficacious when given as single agents (EMT-6, MC38, and CT26). Since expression of CTLA-4 and PD-1 appear individually and jointly on multiple T cell subsets with differing levels and kinetics of expression in different settings and tumor models, observed differences in mechanisms of antitumor immunity of various immunotherapeutic agents are not yet completely understood. Multiple mechanisms likely underlie the enhanced antitumor responses observed with the mIL-21/mPD-1 mAb/mCTLA-4 mAb combinations, including loss of intratumoral Tregs, possibly via IL-21 effects previously reported to enhance ADCC (IL-21 can upregulate the expression of CD16, co-stimulate the secretion of IFNγ, and increase the expression of granzyme and perforinsCitation41). Other mechanisms of enhanced antitumor activity of the IL-21/mAb combinations likely include increases in the numbers and function of intratumoral CD8+ effector T cells ( and ) and reversal of the exhausted T cell phenotype (Supplemental Figure 3).
It is becoming increasingly clear that the response of different types of tumors to checkpoint blockade is more closely associated with their inherent immunogenicity (i.e., mutational burden or dominant neoantigens) than with the tissue of tumor origin.Citation42 For example, CTLA-4 and PD-1 blockade are ineffective in the B16 mouse melanoma tumor model (Supplemental Figure 1), yet have demonstrated activity in human melanoma. Combined CTLA-4 and PD-1 checkpoint blockade has only been effective in a subset of syngeneic tumor models, and non-responsive models may require additional therapies such as vaccines or radiation to turn a “cold” tumor “hot” and elicit tumor-reactive T cells.Citation43,44 Human cancers that are not responsive to anti-PD-1 and/or anti-CTLA-4 may require additional immune modulation, such as rIL-21, if patients are to be converted to durable responders. Chapuis et al. recently demonstrated that adoptive cellular therapy with polyclonal antigen-specific cytotoxic T lymphocytes (CTL) primed ex vivo with IL-21 and then combined with CTLA-4 blockade induced long-term remission in a melanoma patient who had previously been resistant to both monoclonal CTL and anti-CTLA-4.Citation45 Our results further support the hypothesis that the combinations of recombinant human IL-21 and CTLA-4 or PD-1 mAb could lead to improved outcomes in cancer patients.
Materials and methods
Reagents and cell lines
Recombinant mIL-21 was produced at Bristol-Myers Squibb (BMS), Seattle, WA, and was certified to contain <0.5 EU/mg endotoxin and be of >90% purity. Stock solutions were stored at −80°C and dosing solutions were prepared daily in phosphate buffered saline (PBS).
Monoclonal antibodies directed against mPD-1 (clone 4H2, chimeric rat anti-PD-1 engineered with a mouse IgG1)Citation46 and mCTLA-4 (clones 9D9/mouse IgG2b, and UC10-4F10/hamster IgG)Citation47 were produced and purified at BMS. Each was certified to have <0.5 EU/mg endotoxin and be of >95% purity. A nonspecific mouse IgG1 mAb was used as a negative control (MOPC-21; BE0083, BioXCell) for 4H2; PBS was used as a control for the 9D9 experiments. All dosing solutions were prepared in PBS and administered via intraperitoneal (IP) injections, as indicated in . Specific dosing regimens and levels were chosen for the various studies based on the relative aggressiveness of the model, and experimental or established dosing regimens for mIL-21 and the specific antibodies used.
Table 2. Experimental Design.
MC38 cells (obtained from Dr. James Allison, MD Anderson Cancer Center, TX) were grown in Dulbecco's Modified Eagle's Medium (DMEM; 10–013, Mediatech/Corning) supplemented with 10% heat-inactivated fetal bovine serum (FBS; SH3007, Hyclone) and glutamine (25-005, Mediatech).
EMT-6 mouse mammary carcinoma cells (obtained from Dr. Dietmar Siemann, University of Florida, Gainesville) were cultured in DMEM + GlutaMAX media (10566, Gibco) plus 10% FBS. B16-F10 cells (CRL-6475, ATCC) were cultured in RPMI 1640 media (SH30027, HyClone) supplemented with 10% FBS. CT26 cells (CRL-2639, ATCC) were cultured in RPMI 1640 media (SH30027, HyClone) supplemented with 10% FBS and GlutaMAX. All cell lines were harvested on the day of implantation with confirmed viability of >85%.
Mouse tumor models
Individual study details are outlined in . C57BL/6N mice (Charles River Laboratories, Hollister, CA and Harlan Sprague-Dawley, Livermore, CA) were injected SC with 2 × 10⁶ MC38 tumor cells in 0.05 mL Hank's Balanced Salt Solution (HBSS; SH30030, HyClone), or for some experiments in 0.2 mL in PBS, on study day 1. On day 7 to 8, tumor volumes were determined, mice were randomized into study groups, and treatments were initiated. In separate studies, C57BL/6N mice were injected SC in the hind flank with 1 × 10⁵ B16-F10 cells, or were given the same number of cells IV via the tail vein on study day 1. The mice were randomized into groups on study day 5 or 6 and treatments initiated. BALB/cAnN mice (Harlan Sprague-Dawley, Frederick, MD) were injected SC with 1.5 × 10⁶ EMT-6 cells in 0.2 mL HBSS on day 1, then were randomized into groups and treatments initiated on day 7. For the CT26 model, BALB/cAnN mice were randomized into study groups and treatments initiated 8 days post-SC implantation of 1 × 10⁶ CT26 cells in 0.2 mL HBSS.
SC implanted tumors were measured 2- or 3-dimensionally with calipers at least 2–4 times per week and tumor volume was calculated as L × (W2/2) or, in some studies, as (L × W × H)/2 (with L = length, W = width, and H = height). Body weights were recorded at least twice a week. Mice were euthanized when the measured tumor volume neared 1500–2000 mm3, weight loss exceeded 20%, or when the tumors began to ulcerate.
Mice given B16-F10 tumor cells IV were anesthetized with isoflurane and euthanized by cervical dislocation 20 days post-tumor cell injection. Lungs were harvested, inflated with PBS, and the number of surface metastases enumerated.
For in vivo lymphocyte depletion studies, hybridomas producing rat anti-mouse CD4 mAb (clone GK1.5; rat IgG2b) and rat anti-mouse CD8 mAb (clone 2.43; rat IgG2b) were purchased from ATCC and antibodies were produced and purified at BMS. Both anti-CD4 and anti-CD8 were dosed IP on days 3, 9, and 16 post-tumor implant. Anti-asialo GM1 (986-10001, Wako Pure Chemicals) was used to deplete NK cells; one vial of anti-asialo GM1 was diluted in 1 mL PBS and 25 µL were dosed IV on days 3, 9, 16 post-tumor implant.
The mice were free of common bacterial pathogens including Helicobacter sp., ecto- and endo-parasites, and tested negative for the following viruses: Sendai, PVM, MHV, MVM, Theiler, Reovirus 3, LCMV, Ectromelia, EDIM, MPV, K, Polyoma, mouse adenovirus, MCMV, and Hantavirus. Animals were kept on a 12:12 light cycle and housed on corn cob bedding (4B, Bed-o'Cobs, Andersons Lab Bedding) in ventilated microisolator cages (Lab Products) and provided deionized water and autoclaved rodent chow (Rodent Chow 5053, Purina Mills) ad libitum.
Ethical approval
All animal procedures were approved by BMS Institutional Animal Care and Use Committees and followed the guidelines set forth in the Guide for the Care and Use of Laboratory Animals (prepared by the Institute for Laboratory Animal Research).
Tumor infiltrate assessment
CT26 tumors were harvested 5 days after the last treatment and minced with scalpels. Up to 300 mg of the minced tissue was placed in a C-tube (130-095-823, Miltenyi Biotec) containing 5 mL of PEB buffer (PBS, 0.5% bovine serum albumin, and 2 mM EDTA), and then homogenized using the Miltenyi gentleMACS™ on setting m_impTumor_01. The sample was then transferred to a 50 mL conical tube through a 40 µM filter (352340, Becton Dickinson/Falcon), and the filter was then rinsed with 5 mL PEB buffer. Tumor infiltrating lymphocytes (TILs) were analyzed by flow cytometry analyses using the following antibody reagents: anti-CD8α-PerCP-eFluor-710 (clone 53–6.7; 46–0081, eBioscience), anti-CD25-PE (clone PC61.5; 12–0251, eBioscience), anti-CD69-APC-Cy7 (clone H1.2F3; 104526, BioLegend), anti-FoxP3-APC (clone FJK-16s; 17–5773, eBioscience), anti-PD-1-APC (clone RMP1-30; 109112, BioLegend), anti-CD335-FITC (clone 29A1.4; 560756, Becton Dickinson), CD45-PECy7 (clone 30F11; 25–0451, eBioscience), CD44-PE (clone IM7; 12–0441, eBioscience), CD62L-FITC (clone MEL-14; 11–0621, eBioscience), and Ki67-FITC (clone SolA15; 11–5698, eBioscience).
Three days after the final treatment (study day 13), MC38 tumors were harvested into OCT compound (4583, Sakura Finetek), frozen in liquid nitrogen, and held at −80°C for immunohistochemistry (IHC) evaluation. Frozen tumors were cryosectioned at 6 µm, and sections were immunohistochemically stained for CD8 (using anti-CD8 mAb clone 53–6.7; 550281, BD Pharmingen). The slides were then evaluated by an ACVP board certified veterinary pathologist on a Nikon Eclipse E400 microscope equipped with a CRI camera (Model N-MSI-420-FL) using Nuance 2.4 acquisition-image processing software.
Statistical analysis
To evaluate for significant differences (p < 0.05) in means among groups for data represented at one time point (i.e., flow cytometry data and lung metastases counts), data were analyzed using 1-way analysis of variance (ANOVA) followed by Tukey's multiple comparison test. To evaluate for significant differences between treatment groups over time (i.e., tumor growth plots), data were analyzed using 2-way repeated-measures ANOVA for ‘treatment’ effects. When data sets contained both CTLA-4 mAb and PD-1 mAb treatments, statistical analyses were performed for mono- and combination therapy CTLA-4 mAb-containing groups, and then separately for mono- and combination PD-1 mAb-containing groups; control and mIL-21 monotherapy groups were shared for each of these analysis sets. In this manner, the most relevant groups were analyzed for significant differences, while minimizing the repeated used of the control and mIL-21 monotherapy groups in the statistical analysis.
For each of the combination groups, synergy was evaluated by comparing the number of complete regressions (CR) that would be expected if the effects seen in the mAb alone and mIL-21 alone groups were additive, to the number of CR that were actually observed. Statistical significance was determined using a Chi-Square test with one degree of freedom. To evaluate synergy in the IV B16-F10 model, a linear regression model including terms for treatment with mIL-21, mCTLA-4, or mPD-1 mAb, and the interaction between mIL-21 and mCTLA-4 or mPD-1 mAb was fit to the number of lung metastases.
Disclosure of potential conflicts of interest
All authors were employees of BMS when these studies were conducted, and MS, KEL, KW, MSH, JFG, AJK, MJK, and SRD are shareholders of BMS. Some of the authors are also co-inventors on IL-21-related patent applications filed by BMS or ZymoGenetics, Inc (a BMS Company). No non-financial conflicts of interest exist for any of the authors.
Authors' contributions
MS, KEL, MSH, JFG, AJK, MJK, and SRD designed the tumor model studies described herein, and KEL, GM, JV, GD, WC, RG, KM, and KW conducted the experiments. SRD, MJK, MS, KEL, and KW wrote the manuscript, and all authors reviewed, edited, and approved its contents.
Abbreviations
| ADCC | = | antibody-dependent cellular cytotoxicity |
| ANOVA | = | analysis of variance |
| APC | = | antigen-presenting cells |
| ATCC | = | American Type Culture Collection |
| BMS | = | Bristol-Myers Squibb |
| CR | = | complete regression |
| CTLA-4 | = | cytotoxic T lymphocyte antigen-4 |
| FBS | = | fetal bovine serum |
| HBSS | = | Hank's balanced salt solution |
| IL-21 | = | Interleukin 21 |
| IHC | = | immunohistochemistry |
| IFNγ | = | interferon gamma |
| IP | = | intraperitoneal |
| IV | = | intravenous |
| mAb | = | monoclonal antibody |
| mIL-21 | = | mouse IL-21 |
| mPD-1 mAb or mCTLA-4 mAb | = | anti-mouse PD-1 or CTLA-4 mAb |
| NK | = | natural killer |
| NK-T | = | natural killer-T |
| PBS | = | phosphate buffered saline |
| PD-1 | = | programmed cell death-1 |
| PD-L1 and PD-L2 | = | programmed cell death ligands 1 and 2 |
| rIL-21 | = | recombinant human IL-21 |
| SC | = | subcutaneous |
| TCM | = | central memory T cell |
| Teff | = | effector T cell |
| TEM | = | effector memory T cell |
| TF | = | tumor free |
| TIL | = | tumor infiltrating lymphocyte |
| Treg | = | regulatory T cell |
supp_data.zip
Download Zip (146.9 KB)Acknowledgments
We thank Becky Penhallow and Liliana Barreto for performing flow cytometry experiments, and we also greatly appreciate the many BMS vivarium staff members who supported these studies. We are also very grateful to Catherine Bolger for help preparing the manuscript for submission.
Funding
This work was funded by BMS.
References
- Larkin J, Hodi FS, Wolchok JD. Combined Nivolumab and Ipilimumab or Monotherapy in Untreated Melanoma. N Engl J Med. 2015;373:1270-1. https://doi.org/10.1056/NEJMoa1504030. PMID:26398076
- Peggs KS, Quezada SA, Chambers CA, Korman AJ, Allison JP. Blockade of CTLA-4 on both effector and regulatory T cell compartments contributes to the antitumor activity of anti-CTLA-4 antibodies. J Exp Med. 2009;206:1717-25. https://doi.org/10.1084/jem.20082492. PMID:19581407
- Selby MJ, Engelhardt JJ, Johnston RJ, Lu LS, Han M, Thudium K, Yao D, Quigley M, Valle J, Wang C, et al. Preclinical Development of Ipilimumab and Nivolumab Combination Immunotherapy: Mouse Tumor Models, In Vitro Functional Studies, and Cynomolgus Macaque Toxicology. PLoS One. 2016;11:e0161779. https://doi.org/10.1371/journal.pone.0161779. PMID:27610613
- Fewkes NM, Mackall CL. Novel gamma-chain cytokines as candidate immune modulators in immune therapies for cancer. Cancer J. 2010;16:392-8. https://doi.org/10.1097/PPO.0b013e3181eacbc4. PMID:20693852
- Parrish-Novak J, Dillon SR, Nelson A, Hammond A, Sprecher C, Gross JA, Johnston J, Madden K, Xu W, West J, et al. Interleukin 21 and its receptor are involved in NK cell expansion and regulation of lymphocyte function. Nature. 2000;408:57-63. https://doi.org/10.1038/35040504. PMID:11081504
- Parrish-Novak J, Foster DC, Holly RD, Clegg CH. Interleukin-21 and the IL-21 receptor: novel effectors of NK and T cell responses. J Leukoc Biol. 2002;72:856-63. PMID:12429707
- Peluso I, Fantini MC, Fina D, Caruso R, Boirivant M, MacDonald TT, Pallone F, Monteleone G. IL-21 counteracts the regulatory T cell-mediated suppression of human CD4+ T lymphocytes. J Immunol. 2007;178:732-9. https://doi.org/10.4049/jimmunol.178.2.732. PMID:17202333
- Moroz A, Eppolito C, Li Q, Tao J, Clegg CH, Shrikant PA. IL-21 enhances and sustains CD8+ T cell responses to achieve durable tumor immunity: comparative evaluation of IL-2, IL-15, and IL-21. J Immunol. 2004;173:900-9. https://doi.org/10.4049/jimmunol.173.2.900. PMID:15240677
- Li Y, Yee C. IL-21 mediated Foxp3 suppression leads to enhanced generation of antigen-specific CD8+ cytotoxic T lymphocytes. Blood. 2008;111:229-35. https://doi.org/10.1182/blood-2007-05-089375. PMID:17921346
- Kim-Schulze S, Kim HS, Fan Q, Kim DW, Kaufman HL. Local IL-21 promotes the therapeutic activity of effector T cells by decreasing regulatory T cells within the tumor microenvironment. Mol Ther. 2009;17:380-8. https://doi.org/10.1038/mt.2008.249. PMID:19034262
- Krejsa CM, Holly RD, Heipel M, Bannink KM, Johnson R, Roque R, Heffernan J, Hill J, Chin L, Wagener F, et al. Interleukin-21 enhances rituximab activity in a cynomolgus monkey model of B cell depletion and in mouse B cell lymphoma models. PLoS One. 2013;8:e67256. https://doi.org/10.1371/journal.pone.0067256. PMID:23825648
- Castermans K, Tabruyn SP, Zeng R, van Beijnum JR, Eppolito C, Leonard WJ, Shrikant PA, Griffioen AW. Angiostatic activity of the antitumor cytokine interleukin-21. Blood. 2008;112:4940-7. https://doi.org/10.1182/blood-2007-09-113878. PMID:18515660
- Hashmi MH, Van Veldhuizen PJ. Interleukin-21: updated review of Phase I and II clinical trials in metastatic renal cell carcinoma, metastatic melanoma and relapsed/refractory indolent non-Hodgkin's lymphoma. Expert Opin Biol Ther. 2010;10:807-17. https://doi.org/10.1517/14712598.2010.480971. PMID:20384523
- Petersen CC, Diernaes JE, Skovbo A, Hvid M, Deleuran B, Hokland M. Interleukin-21 restrains tumor growth and induces a substantial increase in the number of circulating tumor-specific T cells in a murine model of malignant melanoma. Cytokine. 2010;49:80-8. https://doi.org/10.1016/j.cyto.2009.11.001. PMID:19962321
- Davis ID, Skrumsager BK, Cebon J, Nicholaou T, Barlow JW, Moller NP, Skak K, Lundsgaard D, Frederiksen KS, Thygesen P, McArthur GA. An open-label, two-arm, phase I trial of recombinant human interleukin-21 in patients with metastatic melanoma. Clin Cancer Res. 2007;13:3630-6. https://doi.org/10.1158/1078-0432.CCR-07-0410. PMID:17575227
- Thompson JA, Curti BD, Redman BG, Bhatia S, Weber JS, Agarwala SS, Sievers EL, Hughes SD, DeVries TA, Hausman DF. Phase I study of recombinant interleukin-21 in patients with metastatic melanoma and renal cell carcinoma. J Clin Oncol. 2008;26: 2034-9. https://doi.org/10.1200/JCO.2007.14.5193. PMID:18347008
- Waggie KS, Holdren MS, Byrnes-Blake K, Pedersen S, Ponce R, Hughes S, Miller DM. Preclinical safety, pharmacokinetics, and pharmacodynamics of recombinant human interleukin-21 in cynomolgus macaques (Macaca fascicularis). Int J Toxicol. 2012;31: 303-16. https://doi.org/10.1177/1091581812449661. PMID:22723515
- Dodds MG, Frederiksen KS, Skak K, Hansen LT, Lundsgaard D, Thompson JA, Hughes SD. Immune activation in advanced cancer patients treated with recombinant IL-21: multianalyte profiling of serum proteins. Cancer Immunol Immunother. 2009;58:843-54. https://doi.org/10.1007/s00262-008-0600-8. PMID:18925392
- Baksh K, Weber J. Immune checkpoint protein inhibition for cancer: preclinical justification for CTLA-4 and PD-1 blockade and new combinations. Semin Oncol. 2015;42:363-77. https://doi.org/10.1053/j.seminoncol.2015.02.015. PMID:25965355
- Leach DR, Krummel MF, Allison JP. Enhancement of antitumor immunity by CTLA-4 blockade. Science. 1996;271:1734-6. https://doi.org/10.1126/science.271.5256.1734. PMID:8596936
- Robert C, Thomas L, Bondarenko I, O'Day S, Weber J, Garbe C, Lebbe C, Baurain JF, Testori A, Grob JJ, et al. Ipilimumab plus dacarbazine for previously untreated metastatic melanoma. N Engl J Med. 2011;364:2517-26. https://doi.org/10.1056/NEJMoa1104621. PMID:21639810
- Carter L, Fouser LA, Jussif J, Fitz L, Deng B, Wood CR, Collins M, Honjo T, Freeman GJ, Carreno BM. PD-1:PD-L inhibitory pathway affects both CD4(+) and CD8(+) T cells and is overcome by IL-2. Eur J Immunol. 2002;32:634-43. https://doi.org/10.1002/1521-4141(200203)32:3%3c634::AID-IMMU634%3e3.0.CO;2-9. PMID:11857337
- Zou W, Wolchok JD, Chen L. PD-L1 (B7-H1) and PD-1 pathway blockade for cancer therapy: Mechanisms, response biomarkers, and combinations. Sci Transl Med. 2016;8:328rv4. https://doi.org/10.1126/scitranslmed.aad7118
- Wherry EJ, Ha SJ, Kaech SM, Haining WN, Sarkar S, Kalia V, Subramaniam S, Blattman JN, Barber DL, Ahmed R. Molecular signature of CD8+ T cell exhaustion during chronic viral infection. Immunity. 2007;27:670-84. https://doi.org/10.1016/j.immuni.2007.09.006. PMID:17950003
- Quezada SA, Peggs KS, Curran MA, Allison JP. CTLA4 blockade and GM-CSF combination immunotherapy alters the intratumor balance of effector and regulatory T cells. J Clin Invest. 2006;116:1935-45. https://doi.org/10.1172/JCI27745. PMID:16778987
- Selby MJ, Engelhardt JJ, Quigley M, Henning KA, Chen T, Srinivasan M, Korman AJ. Anti-CTLA-4 antibodies of IgG2a isotype enhance antitumor activity through reduction of intratumoral regulatory T cells. Cancer Immunol Res. 2013;1:32-42. https://doi.org/10.1158/2326-6066.CIR-13-0013. PMID:24777248
- Spolski R, Leonard WJ. Interleukin-21: a double-edged sword with therapeutic potential. Nat Rev Drug Discov. 2014;13:379-95. https://doi.org/10.1038/nrd4296. PMID:24751819
- Dahan R, Sega E, Engelhardt J, Selby M, Korman AJ, Ravetch JV. FcgammaRs Modulate the Anti-tumor Activity of Antibodies Targeting the PD-1/PD-L1 Axis. Cancer Cell. 2015;28:285-95. https://doi.org/10.1016/j.ccell.2015.08.004. PMID:26373277
- Gettinger SN, Horn L, Gandhi L, Spigel DR, Antonia SJ, Rizvi NA, Powderly JD, Heist RS, Carvajal RD, Jackman DM, et al. Overall Survival and Long-Term Safety of Nivolumab (Anti-Programmed Death 1 Antibody, BMS-936558, ONO-4538) in Patients With Previously Treated Advanced Non-Small-Cell Lung Cancer. J Clin Oncol. 2015;33:2004-12. https://doi.org/10.1200/JCO.2014.58.3708. PMID:25897158
- Schadendorf D, Hodi FS, Robert C, Weber JS, Margolin K, Hamid O, Patt D, Chen TT, Berman DM, Wolchok JD. Pooled Analysis of Long-Term Survival Data From Phase II and Phase III Trials of Ipilimumab in Unresectable or Metastatic Melanoma. J Clin Oncol. 2015;33:1889-94. https://doi.org/10.1200/JCO.2014.56.2736. PMID:25667295
- Smyth MJ, Teng MW, Sharkey J, Westwood JA, Haynes NM, Yagita H, Takeda K, Sivakumar PV, Kershaw MH. Interleukin 21 enhances antibody-mediated tumor rejection. Cancer Res. 2008;68:3019-25. https://doi.org/10.1158/0008-5472.CAN-07-6019. PMID:18413772
- Rigo V, Corrias MV, Orengo AM, Brizzolara A, Emionite L, Fenoglio D, Filaci G, Croce M, Ferrini S. Recombinant IL-21 and anti-CD4 antibodies cooperate in syngeneic neuroblastoma immunotherapy and mediate long-lasting immunity. Cancer Immunol Immunother. 2014;63:501-11. https://doi.org/10.1007/s00262-014-1536-9. PMID:24647609
- Pan XC, Li L, Mao JJ, Yao W, Zheng JN, Liu M, Fu JJ. Synergistic effects of soluble PD-1 and IL-21 on antitumor immunity against H22 murine hepatocellular carcinoma. Oncol Lett. 2013;5:90-6. PMID:23255900
- Sondergaard H, Frederiksen KS, Thygesen P, Galsgaard ED, Skak K, Kristjansen PE, Odum N, Kragh M. Interleukin 21 therapy increases the density of tumor infiltrating CD8+ T cells and inhibits the growth of syngeneic tumors. Cancer Immunol Immunother. 2007;56:1417-28. https://doi.org/10.1007/s00262-007-0285-4. PMID:17285290
- Simpson TR, Li F, Montalvo-Ortiz W, Sepulveda MA, Bergerhoff K, Arce F, Roddie C, Henry JY, Yagita H, Wolchok JD, et al. Fc-dependent depletion of tumor-infiltrating regulatory T cells co-defines the efficacy of anti-CTLA-4 therapy against melanoma. J Exp Med. 2013;210:1695-710. https://doi.org/10.1084/jem.20130579. PMID:23897981
- Grosso JF, Jure-Kunkel MN. CTLA-4 blockade in tumor models: an overview of preclinical and translational research. Cancer Immun. 2013;13:5. PMID:23390376
- Harrington LE, Galvan M, Baum LG, Altman JD, Ahmed R. Differentiating between memory and effector CD8 T cells by altered expression of cell surface O-glycans. J Exp Med. 2000;191:1241-6. https://doi.org/10.1084/jem.191.7.1241. PMID:10748241
- Strengell M, Sareneva T, Foster D, Julkunen I, Matikainen S. IL-21 up-regulates the expression of genes associated with innate immunity and Th1 response. J Immunol. 2002;169:3600-5. https://doi.org/10.4049/jimmunol.169.7.3600. PMID:12244150
- Strengell M, Matikainen S, Siren J, Lehtonen A, Foster D, Julkunen I, Sareneva T. IL-21 in synergy with IL-15 or IL-18 enhances IFN-gamma production in human NK and T cells. J Immunol. 2003;170:5464-9. https://doi.org/10.4049/jimmunol.170.11.5464. PMID:12759422
- Roda JM, Parihar R, Lehman A, Mani A, Tridandapani S, Carson WE, 3rd. Interleukin-21 enhances NK cell activation in response to antibody-coated targets. J Immunol. 2006;177:120-9. https://doi.org/10.4049/jimmunol.177.1.120. PMID:16785506
- Kohrt HE, Houot R, Marabelle A, Cho HJ, Osman K, Goldstein M, Levy R, Brody J. Combination strategies to enhance antitumor ADCC. Immunotherapy. 2012;4:511-27. https://doi.org/10.2217/imt.12.38. PMID:22642334
- Gubin MM, Zhang X, Schuster H, Caron E, Ward JP, Noguchi T, Ivanova Y, Hundal J, Arthur CD, Krebber WJ, et al. Checkpoint blockade cancer immunotherapy targets tumour-specific mutant antigens. Nature. 2014;515:577-81. https://doi.org/10.1038/nature13988. PMID:25428507
- Melero I, Berman DM, Aznar MA, Korman AJ, Gracia JL, Haanen J. Evolving synergistic combinations of targeted immunotherapies to combat cancer. Nat Rev Cancer. 2015;15:457-72. https://doi.org/10.1038/nrc3973. PMID:26205340
- Demaria S, Coleman CN, Formenti SC. Radiotherapy: changing the game in immunotherapy. Trends Cancer. 2016;2:286-94. https://doi.org/10.1016/j.trecan.2016.05.002. PMID:27774519
- Chapuis AG, Lee SM, Thompson JA, Roberts IM, Margolin KA, Bhatia S, Sloan HL, Lai I, Wagener F, Shibuya K, et al. Combined IL-21-primed polyclonal CTL plus CTLA4 blockade controls refractory metastatic melanoma in a patient. J Exp Med. 2016;213:1133-9. https://doi.org/10.1084/jem.20152021. PMID:27242164
- Li B, VanRoey M, Wang C, Chen TH, Korman A, Jooss K. Anti-programmed death-1 synergizes with granulocyte macrophage colony-stimulating factor–secreting tumor cell immunotherapy providing therapeutic benefit to mice with established tumors. Clin Cancer Res. 2009;15:1623-34. https://doi.org/10.1158/1078-0432.CCR-08-1825. PMID:19208793
- Walunas TL, Lenschow DJ, Bakker CY, Linsley PS, Freeman GJ, Green JM, Thompson CB, Bluestone JA. CTLA-4 can function as a negative regulator of T cell activation. Immunity. 1994;1:405-13. https://doi.org/10.1016/1074-7613(94)90071-X. PMID:7882171