ABSTRACT
The success of immune checkpoint blockade has unequivocally demonstrated that anti-tumor immunity plays a pivotal role in cancer therapy. Because endogenous tumor-specific T-cell responsiveness is essential for the success of checkpoint blockade, combination therapy with cancer vaccination may facilitate tumor rejection. To select the best vaccine strategy to combine with checkpoint blockade, we compared dendritic cell-based vaccines (DC-V) with peptide vaccines for induction of anti-tumor immunity that could overcome tumor-induced immunosuppression. Using B16 melanoma and B16-specific TCR-transgenic T-cells (pmel-1), we found that DC-V efficiently primed and expanded pmel-1 cells with an active effector and central memory phenotype that were not exhausted. Vaccine-primed cells were metabolically distinct from naïve cells. DC-V-primed pmel-1 cells contained the population that shifted metabolic pathways away from glycolysis to mitochondrial oxidative phosphorylation. They displayed better effector function and proliferated more than those induced by peptide vaccination. DC-V inhibited tumor growth in prophylactic and therapeutic settings. Only DC-V but not peptide vaccine showed augmented anti-tumor activity when combined with anti-PD-1 therapy. Thus, DC-V combined with PD-1 checkpoint blockade mediates optimal anti-cancer activity in this model.
Introduction
Checkpoint blockade therapies provide substantial clinical benefits for cancer patients by activating their own anti-tumor immunity.Citation1,2 Although durable responses are observed in patients with a broad spectrum of cancers, the proportion of patients benefitting from this therapy is limited. For example, in one study of metastatic melanoma, only 10.9% of patients achieved an objective response on anti-CTLA-4 antibody therapy.Citation3 In another trial, the objective response rate for PD-1 blockade with pembrolizumab in non-small cell lung cancer was 19.4%.Citation4
To overcome this limitation, several combination immunotherapies are currently under clinical evaluation. In addition to combining different checkpoint inhibitors together,Citation5 standard-of-care chemotherapies, targeted therapies, and radiation therapies are also being tested in combination with checkpoint inhibitors.Citation6 To develop rational combinations, understanding the mode of action of immunotherapies and the characterization of the immune effects of the other partners in the combination is required.Citation7 Recently, it has become widely appreciated that the clinical benefits of checkpoint blockade rely on the presence of pre-existing endogenous T cells which can recognize the tumor.Citation6 In this respect, it would be reasonable to combine vaccination to induce tumor-specific immune responses with checkpoint inhibitors. To select the appropriate cancer vaccine strategy to combine with checkpoint blockade, we compared the efficacy of dendritic cell (DC)-based cancer vaccine with adjuvanted peptide vaccine for induction of anti-tumor immunity sufficiently robust to overcome tumor-induced immunosuppression.
Hitherto, cancer vaccines in the majority of clinical trials have consisted of short, minimal determinant peptides sometimes formulated in incomplete Freund's adjuvant (IFA).Citation8 However, the effect of short peptide vaccines is limited because antigens persist at the vaccination site and result in retention of vaccine-primed CD8+ T cells at that site rather than their recruitment to the tumor.Citation9 In contrast, long peptides emulsified in IFA avoid T cell sequestration or induction of exhaustion at the vaccination site and can induce superior anti-tumor effects.Citation9,10 Similarly, DC vaccines have been reported to induce antigen-specific CD8+ T cells and strong anti-tumor effects.Citation11 12 In the present study, we compared the efficacy of DC vaccines and short peptide vaccines in terms of the combination with PD-1 checkpoint blockade. We demonstrated that dendritic cell vaccine is well-combined with PD-1 checkpoint blockade by inducing antigen-specific CD8+ T cells with better proliferation potential and effector function in the tumor microenvironment.
Results
DC vaccination is superior to peptide vaccination for priming and expanding antigen-specific CD8+ T cells
To compare the capacity of peptide- and DC-based vaccination to prime and expand antigen-specific CD8+ T cells, CD90.1+CD8+ pmel-1 cells were adoptively transferred into mice which were then immunized twice with hgp100 short epitope peptide vaccine (SP-V) or a vaccine consisting of peptide-pulsed DC (DC-V). For SP-V, peptide was emulsified with CFA or IFA, and CpG was incorporated into the peptide vaccine formula. For DC-V, we prepared bone marrow-derived DC (BMDC) that were fully matured with LPS and expressed CD40, CD80, CD86, MHC class I/II and CCR7 (Supplemental Fig. S1). Two weeks after the second vaccination, expansion of CD90.1+CD8+ pmel-1 T cells in the spleen was evaluated in these animals. While 0.1 ± 0.0% of CD3+ T cells in the spleen were CD90.1+CD8+ pmel-1 T cells in control mice, the frequency of these cells was increased to 0.7 ± 0.3% and 3.4 ± 1.9% by SP-V and DC-V, respectively (, ). DC-V was more effective in this respect, in that the number of pmel-1 T cells (1.3 ± 0.8 × 10⁶) in the spleen of DC-V mice was consistently >5-fold higher than in SP-V mice (2.4 ± 0.4 × 10⁵) ().
Figure 1. Priming and expansion of antigen-specific pmel-1 CD8+ T cells by cancer vaccines. To increase the frequency of naive gp100-specific CD8+ T cells, 1 × 10⁷ spleen cells (14.5 ± 2.7% of which were CD8+Thy1.1+hgp100 tetramer+) from pmel-1 transgenic mice were adoptively transferred into C57BL/6 mice prior to vaccination. These mice then received SP-V or DC-V. Vaccines were administered on days 0 and 14. On day 28, spleen cells from vaccinated mice were analyzed by flow cytometry to evaluate the quantity and quality of vaccine-induced pmel-1 CD8+ T cells. (a) Pmel-1 CD8+ T cells were detected as CD8+CD90.1+ cells by flow cytometry. One plot from each group is depicted. Numbers indicate the frequency of CD8+CD90.1+ cells from a representative mouse. Percentages (b) and absolute cell numbers (c) of CD8+CD90.1+ cells are shown. (d) CD44 and CD62L expression by CD8+CD90.1+ cells. Numbers indicate the frequency for each quadrant from a representative mouse. Bar graphs demonstrate percentages of pmel-1 cells with the CD44hiCD62L+ central memory phenotype (e) and the CD44hiCD62L− effector memory phenotype (f). (g) CD127 and CD62L expression by CD8+CD90.1+ cells. (h) Percentages of CD127+ cells. (i) PD-1 and Tim-3 expression by CD8+CD90.1+ cells. Bar graphs display percentages of PD-1+ (j) Tim-3+ (k) and PD-1+Tim-3+ (l) cells. Data are representative of three experiments with 4 mice per group.
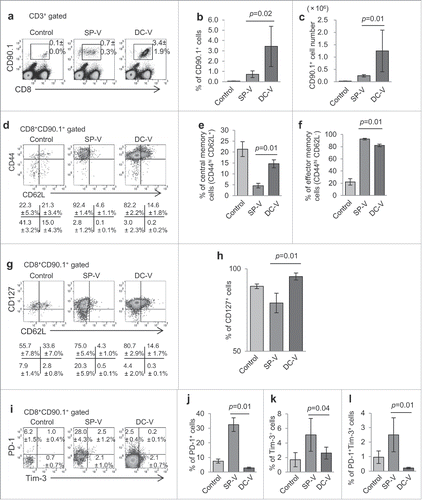
The phenotypes of the vaccine-primed pmel-1 T cells were then determined. They were found to strongly express CD44 and most had a CD44hiCD62L− effector memory phenotype in the SP-V mice (). DC-V induced more pmel-1 cells with the CD44hiCD62L+ central memory phenotype than SP-V (). More pmel-1 cells in SP-V mice lost their CD127 expression than in the DC-V mice (, ). Furthermore, pmel-1 cells primed by SP-V expressed more PD-1 and/or Tim-3 molecules than DC-V; thus, 32.4 ± 4.6% of pmel-1 cells in SP-V mice expressed PD-1 and 2.5 ± 1.2% of them were PD-1+Tim-3+ (). In contrast, only 2.9 ± 0.5% of pmel-1 cells expressed PD-1 and a mere 0.2 ± 0.1% were PD-1+Tim-3+ in the DC-V mice. These results indicate that SP-V did induce effector memory cells, but one-third of them displayed a phenotype indicating partial functional exhaustion, while DC-V induced central memory cells that did not have an exhausted phenotype.
Superior proliferative capacity of DC-V-primed pmel-1 cells relative to SP-V
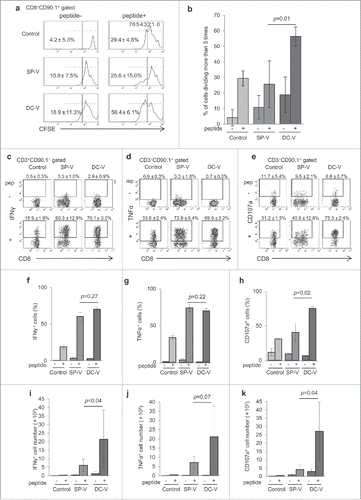
Next, we compared the proliferative capacity of vaccine-primed pmel-1 cells. Spleen cells from vaccinated mice were CFSE-labeled and cultured with or without hgp100 peptide in vitro. Cell proliferation was evaluated by CFSE dilution (). Pmel-1 cells in control mice did not proliferate spontaneously, while 29.4 ± 4.8% divided >3 times in 48 h in the presence of hgp100 peptide (). Similarly, pmel-1 cells primed by SP-V did not proliferate spontaneously, and 25.6 ± 15.0% of them divided >3 times on hgp100 peptide stimulation. In contrast, 18.9 ± 11.3% of DC-V-primed pmel-1 cells proliferated in the absence of in vitro peptide restimulation, suggesting that they retained their proliferative activity from the in vivo priming. Furthermore, they proliferated more vigorously in response to hgp100 peptide restimulation, with 56.4 ± 6.1% dividing >3 times within 48 h. These results are consistent with their central memory phenotypes and lack of exhaustion ().
Figure 2. Proliferative capacity and effector function of vaccine-induced pmel-1 cells. C57BL/6 mice received vaccination as described in the legend to . On day 28, spleen cells were labeled with CFSE and cultured in the presence or absence of hgp100 peptide at 1 µg/ml for 2 days. (a) CFSE dilution in CD8+CD90.1+ cells was determined by flow cytometry. One of the plots from each group is depicted. Numbers indicate the percentage of cells which had divided more than three times. (b) Bar graphs indicate the percentages of cells dividing more than 3 times. Data are representative of two experiments with 5 mice per group. IFNγ (c) and TNFα (d) production and CD107a translocation (e) of CD8+CD90.1+ pmel-1 cells stimulated with or without hgp100 peptide. One plot from each group is depicted. Numbers indicate the frequency of IFNγ+ cells from a representative mouse. Frequencies (f, g, h) and absolute cell numbers (i, j, k) of IFNγ+ (f, i), TNFα+ (g, j) and CD107a+ (h, k) cells. Data are representative of three experiments with 4 or 5 mice per group.
Cytokine production and cytotoxicity of DC-V-primed pmel-1 cells is superior to SP-V-primed cells
Next, we compared vaccine-primed pmel-1 cells for their capacity to produce cytokines and release cytotoxic granules. Both SP-V- and DC-V-primed pmel-1 cells promptly produced twice as much IFNγ and TNFα as naïve pmel-1 cells (, ). Although the percentages of cells producing these cytokines were similar (, ), their absolute numbers were much greater in DC-V mice because a larger number of pmel-1 cells were expanded by DC-V (, ). Cytotoxic effecter function was evaluated by the CD107a externalization assay. SP-V-primed pmel-1 cells and naïve cells yielded similar results (31.2 ± 1.5% and 40.5 ± 12.8% of naïve and SP-V cells externalizing CD107a, respectively) (, ); in contrast, 75.3 ± 2.4% of pmel-1 cells became CD107a-positive in DC-V mice after in vitro hgp100 peptide stimulation. This difference was even greater when expressed in absolute cell numbers; almost 7-fold more pmel-1 cells (2.7 ± 1.8 × 10⁶) became CD107a-positive in DC-V than SP-V mice (4.1 ± 2.8 × 10⁵) (). These results indicate that DC-V induced superior effector function both quantitatively and qualitatively.
Gene expression analysis confirms differences between SP-V- and DC-V-primed cells
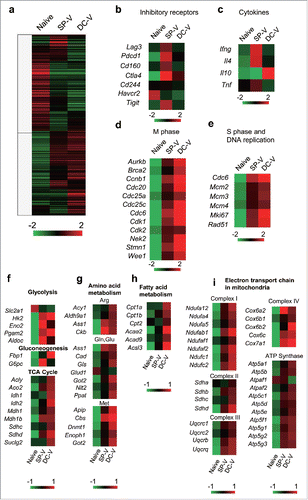
We conducted comprehensive gene expression analysis of naïve and vaccine-primed pmel-1 cells. Cluster analysis demonstrated that the expression profiles of vaccine-primed cells and naïve T cells were different (). In general, the expression profiles of SP-V- and DC-V-primed pmel-1 cells were similar, but some clusters of differentially expressed genes emerged. Again, consistent with phenotypic analysis by flow cytometry (), SP-V-primed cells expressed higher levels of genes for inhibitory receptors such as Lag3, Pdcd1, Ctla4 and Tigit, than DC-V-primed cells (). They expressed more Ifng and Il4, whereas DC-V-primed cells expressed more Il10 (). Also consistent with the results of CFSE dilution experiments (), DC-V-primed cells expressed genes related to M phase and S phase at higher levels than SP-V-primed cells (, ), suggesting that they were actively cycling. Differences in metabolism and bioenergetics between naïve and vaccine-primed pmel-1 cells were perceived by gene expression analysis (). Vaccine-primed pmel-1 cells upregulated genes related to glycolysis, except for lower expression of the Slc2a1 gene that encodes the glucose transporter Glut1. DC-V-primed cells also upregulated Fbp1, which promotes gluconeogenesis. Genes related to amino acid and fatty acid metabolism were upregulated in DC-V-primed cells (, ). Importantly, the carnitine palmitoyl transferase 1 a (Cpt1a) gene, a rate limiting enzyme for fatty acid oxidation, was included among the latter (). Genes related to the TCA cycle () and the mitochondrial electron transport chain () were more abundantly expressed in DC-V-primed cells relative to SP-V-primed cells. Collectively, these results suggest that antigen-specific T cells primed and expanded by DC-V differentiated into central memory cells with proliferative capacity that can utilize oxidative phosphorylation in mitochondria in addition to aerobic glycolysis.
Figure 3. Gene expression profiles of naïve, SP-V-primed and DC-V-primed pmel-1 cells. Mice were treated as described in the legend to . CD8+CD90.1+ cells were sorted from pooled spleen cells of the indicated groups of mice (19 SP-V and 10 DC-V mice). Gene expression was analyzed by microarray. (a) Heat map of hierarchical clustering analysis based on fold-changes of gene expression relative to mean values. Genes of interest were categorized and show (b) inhibitory receptors, (c) cytokines, (d) M phase, (e) S phase and DNA replication, (f) glycolysis, gluconeogenesis and TCA cycle, (g) amino acid metabolism, (h) fatty acid metabolism, (i) electron transport chain in mitochondria.
DC-V-primed cells are metabolically distinct from SP-V-primed cells
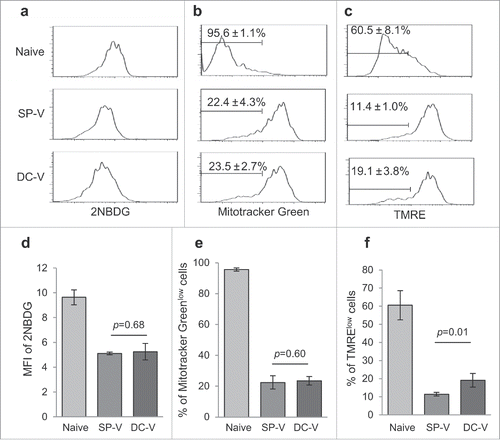
To confirm the metabolic status of vaccine-primed pmel-1 cells, we first quantified the uptake of the fluorescent glucose analogue 2-NBDG. This was similar in SP-V- and DC-V-primed cells, in both cases tending to be less than in naïve pmel-1 cells (, ). Mitotracker Green staining that reflects the mitochondrial mass and TMRE staining that reflects the mitochondrial membrane potential were higher in SP-V- and DC-V-primed pmel-1 cells than naïve pmel-1 cells (, , , ). These results consistent with the fact that both SP-V- and DC-V-primed pmel-1 cells became effector memory cells. However, DC-V-primed pmel-1 cells contained more TMRElow cells (19.1 ± 3.8%) than SP-V-primed cells (11.4 ± 1.0%) (, ). These results indicate that DC-V-primed pmel-1 cells contained central memory cells as well as effector memory cells (). They are acknowledged to have better proliferation potential and utilize mitochondrial oxidative phosphorylation in addition to glycolysis.Citation13
Figure 4. Glucose uptake and mitochondrial membrane potential of vaccine-primed pmel-1 cells. Mice were treated as described in the legend to . (a) Uptake of 2-NBDG in CD8+CD90.1+ cells was determined by flow cytometry. Mitochondrial mass (b) and membrane potential (c) in CD8+CD90.1+ pmel-1 cells evaluated by labeling with Mitotracker Green (b) and TMRE (c) staining. One plot from each group is depicted. Bar graphs indicate mean fluorescence intensities of 2-NBDG (d) and frequencies of Mitotracker Greenlow (e) and TMRElow (f) cells in CD8+CD90.1+ pmel-1 cells. Data are representative of two experiments with 5 mice per group.
DC-V-induces robust anti-tumor activity in vivo
The in vivo anti-tumor potential of SP-V and DC-V was evaluated both prophylactically and therapeutically. First, mice into which naïve pmel-1 cells had been transferred received SP-V or DC-V twice two weeks apart. Another two weeks later, they were subcutaneously challenged with 1 × 10⁶ B16F10 melanoma cells. As shown in , tumors grew progressively in control mice. SP-V delayed tumor growth, whereas DC-V prevented it completely.
Figure 5. In vivo anti-tumor activity of SP-V and DC-V. (a) Mice (5 mice per group) were treated as described in the legend to . Two weeks later, they were challenged by subcutaneous injection of 1 × 10⁶ B16F10 cells and tumor growth was monitored. The graphs show tumor volume of individual mice. The tumor volumes were compared on day 17. Data are representative of two experiments with 5 mice per group. (b) For the therapeutic model, C57BL/6 mice (6 mice per group) were first inoculated with 1 × 10⁶ B16F10 cells subcutaneously on day 0. On day 5, mice received 1 × 10⁷ naïve pmel-1 transgenic spleen cells. SP-V or DC-V was then administered twice on days 5 and 12 to these animals and tumor growth monitored. The graphs show tumor volume of individual mice. The tumor volumes were compared on day 18. Data are representative of three experiments.
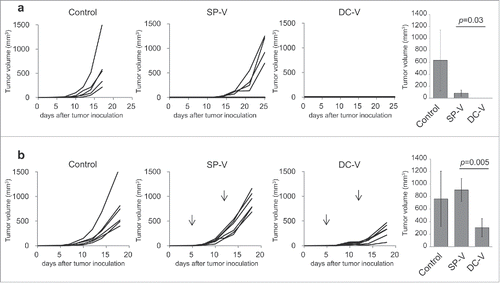
In the therapeutic setting, mice were first inoculated with B16F10 melanoma cells (1 × 10⁶) and then treated with SP-V or DC-V on days 5 and 12 (). To monitor vaccine-primed cells efficiently, naïve pmel-1 cells were transferred on day 5 just before vaccination. SP-V was completely unable to suppress tumor growth, whereas DC-V significantly reduced it, albeit without eradicating the tumor.
DC-V-primed pmel-1 cells maintain their functions in the tumor microenvironment
On day 18 after tumor inoculation, tumors were harvested and CD45+ tumor-infiltrating leukocytes (TIL) were investigated. More TIL were present in vaccinated animals than in controls (, ). Thus, no pmel-1 cells were found in the tumor of control mice, while 0.3 ± 0.4% of TILs were CD90.1+CD8+ pmel-1 cells in SP-V mice (, ). Importantly, larger amounts of vaccine-primed pmel-1 cells were detected in TIL from DC-V mice (7.8 ± 10.9%). Differences in absolute cell numbers were even more prominent: 4.2 ± 4.8 × 10², 2.2 ± 2.2 × 10⁴ and 1.2 ± 2.0 × 10⁶ in tumors of control, SP-V and DC-V mice, respectively (p = 0.005, ).
Figure 6. Phenotype and function of vaccine-primed pmel-1 cells in the tumor microenvironment. Mice were treated as described in the legend to . On day 18, tumor-infiltrating cells were isolated. Tumor-infiltrating leukocytes (a) and pmel-1 cells (b) were detected as CD45+ and CD45+CD8+CD90.1+ cells, respectively. One plot from each group is depicted. Frequencies (left) and absolute numbers (right) of CD45+ (c) and CD45+CD8+CD90.1+ (d) cells. Expression of PD-1 and LAG-3 (e), Tim-3 and LAG-3 (f), PD-1 and Tim-3 (g) and PD-1, Tim-3 and LAG-3 (h) by CD45+CD8+CD90.1+ pmel-1 cells. The levels of PD-1 expression on pmel-1 cells and their mean fluorescent intensities were compared (i). Bar graphs depict frequencies of PD-1+ (j), LAG-3+ (k), Tim-3+ (l), PD-1+LAG-3+ (m), Tim-3+LAG-3+ (n), PD-1+Tim-3+ (o) and PD-1+Tim-3+LAG-3+ (p) cells in CD45+CD8+CD90.1+ pmel-1 cells. IFNγ (q) and TNFα (r) production by CD45+CD8+CD90.1+ pmel- 1 cells stimulated with or without 1 µg/ml hgp100 peptide assessed by flow cytometry. (s) Ki67 expression in CD45+CD8+CD90.1+ cells. Frequencies (t, v, x) and absolute cell numbers (u, w, y) of IFNγ+(t, u), TNFα+ (v, x), Ki67+ (x, y) cells depicted as bar graphs. Data are representative of 3 experiments with 6 mice per group.
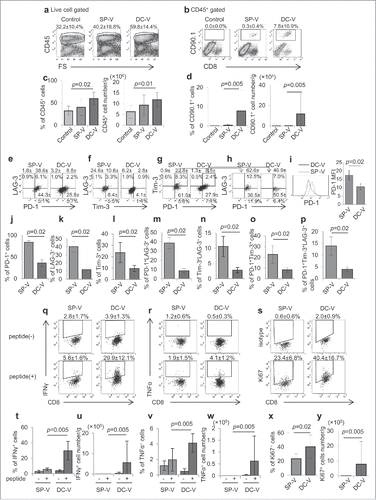
We further analyzed the phenotypes and functions of pmel-1 cells in tumors from vaccinated animals. We found that 84.3 ± 3.7% of tumor-infiltrating pmel-1 cells expressed PD-1 in SP-V mice, while only 36.4 ± 7.8% were PD-1-positive in DC-V mice (, ). LAG-3 and Tim-3 expression was also higher in pmel-1 cells from SP-V mice than DC-V mice (). Cells triple-positive for PD-1, LAG-3 and Tim-3 were present at 13.9 ± 3.9% in SP-V mice but only at 3.9 ± 1.0% in DC-V mice (, ).
Consistent with the phenotyping results, pmel-1 cells from tumors of SP-V mice produced very little IFNγ, whereas 29.9 ± 12.1% of tumor-infiltrating pmel-1 cells in DC-V mice produced this cytokine on stimulation with hgp100 peptide (, ). In contrast, only 4.1 ± 1.2% of pmel-1 cells produced TNFα in DC-V mice (, ). These differences were even more prominent for absolute cell counts (, ). Furthermore, 23.4 ± 6.8% and 40.4 ± 16.7% of pmel-1 cells in SP-V and DC-V mice, respectively, were Ki67-positive, suggesting that DC-V-primed pmel-1 cells maintained better proliferative capacity in the tumor (, , ).
PD-1 blockade augments the anti-tumor activity of DC but not peptide vaccines
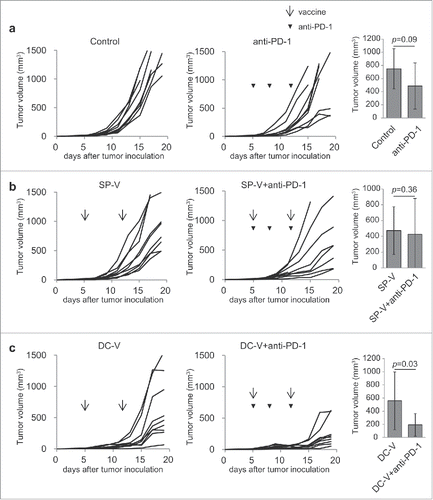
As shown in , a substantial portion of tumor-infiltrating vaccine-primed pmel-1 cells expressed PD-1. Therefore, anti-PD-1 treatment was combined with SP-V or DC-V in the therapeutic model in an attempt to augment anti-tumor activity. It was found that anti-PD-1 antibody treatment alone did not suppress tumor growth (), but this was inhibited by DC-V, but not SP-V. Thus, anti-PD-1 treatment augmented the anti-tumor activity of DC-V, but had no additive effect in SP-V mice.
Figure 7. Anti-tumor activity of combining PD-1 signaling blockade with cancer vaccines. C57BL/6 mice (9 mice per group) were treated as described in the legend to . Mice were first inoculated with 1 × 10⁶ B16F10 cells subcutaneously on day 0. On day 5, mice received 1 × 10⁷ naïve pmel-1 transgenic spleen cells. Then mice received no vaccination (a), SP-V (b) or DC-V (c) on days 5 and 12 to these animals and tumor growth monitored. Where indicated, anti-PD-1 antibody (200 µg) was intraperitoneally injected on days 5, 8 and 12. Tumor growth was evaluated every 2–3 days. The graphs show tumor volume of individual mice. The tumor volumes were compared on day 15 (a, b) or 17 (c). Data are representative of two experiments.
On day 19, tumors were harvested and CD45+ TILs were monitored by flow cytometry. More TILs were recruited into the tumor in SP-V and DC-V mice than in control mice (, , ). Anti-PD-1 treatment further increased both the frequency and absolute numbers of TILs in control animals (, , ). However, frequencies and absolute cell number of tumor-infiltrating pmel-1 cells were similar in the vaccine and the vaccine plus anti-PD-1 groups (, , ). CD90.1−CD8+ T cells (i.e. not pmel-1 cells) were increased by anti-PD-1 treatment in the TILs (, , ), possibly because of polyclonal tumor-specific “bystander” T cell activation.
Figure 8. Frequency and functions of vaccine-primed pmel-1 cells with PD-1 signaling blockade. Mice were treated as described in the legend to . On day 19, tumor-infiltrating leukocytes were isolated and examined by flow cytometry; CD45+ cells (a) were further divided into CD45+CD8+CD90.1+ and CD45+CD8+CD90.1− (d) cells. IFNγ (i) and TNFα (l) production and CD107a translocation (o) in CD45+CD8+CD90.1+ pmel-1 cells were assessed by intracellular cytokine staining and CD107a externalization assay, respectively. One plot from each group is depicted. Frequencies (b, e, g, j, m, p) and absolute cell numbers (c, f, h, k, n, q) of CD45+ (b, c), CD45+CD8+CD90.1+ pmel-1 (e, f), CD45+CD8+CD90.1− (g, h), CD45+CD8+CD90.1+IFNγ+ (j, k), CD45+CD8+CD90.1+TNFα+ (m, n) and CD45+CD8+CD90.1+CD107a+ (p, q) cells are depicted by bar graphs. Data are representative of two experiments with 5 mice per group.
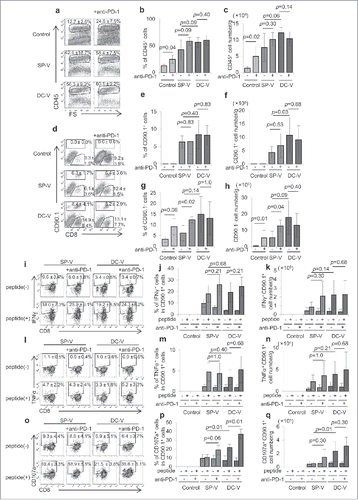
The frequency and absolute cell numbers of tumor-infiltrating pmel-1 cells producing IFNγ and TNFα on antigen re-stimulation in vitro was unchanged by combined treatment with anti-PD-1 antibody and SP-V or DC-V (). Anti-PD-1 treatment increased externalization of CD107a+ cytotoxic granules in pmel-1 cells in the mice receiving DC-V ().
Overall, it can be concluded that the expansion of vaccine-primed pmel-1 cells and the maintenance of their effector function in the tumor resulted in enhanced anti-tumor activity of combination DC-V and anti-PD-1 treatment.
Discussion
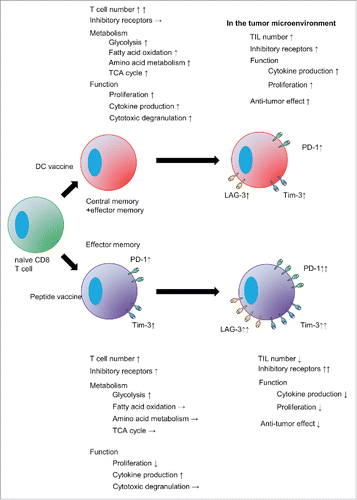
Here, we have documented quantitative and qualitative differences in vaccine-primed CD8+ T cells from mice inoculated with short peptide (SP-V) or dendritic cell (DC-V) vaccines. SP-V was found to induce effector memory cells with a partially dysfunctional phenotype and limited proliferative capacity, while DC-V induced cytolytically active effector and central memory cells with potent proliferative capacity. These vaccine-primed cells were metabolically distinct from naïve cells, but additionally there were notable differences between DC-V- and SP-V-primed pmel-1 cells. The former contained the population that shifted metabolic pathways away from glycolysis to mitochondrial oxidative phosphorylation. They demonstrated superior anti-tumor activity relative to cells from SP-V mice and more effectively suppressed tumor growth both in the prophylactic and therapeutic setting. Combining vaccination with anti-PD-1 treatment augmented the anti-tumor activity of DC-V but not of SP-V. Therefore, we conclude that DC-V is superior to SP-V as the strategy of choice for translating combined cancer vaccine and checkpoint blockade therapies.
It is known that memory T cells mount faster and stronger responses than naïve T cells when they re-encounter their cognate antigens.Citation14,15 In addition to phenotype and function, differences in metabolism between naïve and memory T cells are widely accepted; memory CD8+ T cells are dependent on fatty acid oxidation (FAO) for their development, long-term persistence, and ability to robustly respond to antigen stimulation.Citation16 Memory CD8+ T cells increase in number by enhancing FAO through augmented expression of CPT1a, a critical mitochondrial transporter of long-chain fatty acids and a rate limiting enzymatic step to β-oxidation.Citation17,18 Sukumar et al. reported that T cells with high metabolic activity and high mitochondrial membrane potential during priming lead to short-lived cells with poor anti-tumor efficacy. In contrast, T cells with low mitochondrial membrane potential exhibit superior persistence and improved anti-tumor function.Citation19 This is indeed the case with SP-V- and DC-V-primed T cells. Our data show that DC-V rapidly expanded antigen-specific CD8+ T cells ( and ) that displayed multi-functionality (), had functional mitochondria and expressed Cpt1a ( and ). These results are all consistent with the interpretation that DC-V primed and expanded functional memory CD8+ T cells. On the other hand, SP-V-primed pmel-1 cells expressed PD-1, Tim-3, LAG-3, CTLA-4 and TIGIT and lost their proliferative potential before encountering tumor cells (, and ). Although SP-V-primed pmel-1 cells produced certain cytokines to the same degree as DC-V-primed cells on stimulation in vitro, they had lower cytotoxic activity ().
Our results with SP-V are consistent with a previous report that IFA-based SP-V primes antigen-specific CD8+ T cells expressing inhibitory receptors such as PD-1, LAG-3 and Tim-3, which are functionally impaired and possess little in vivo anti-tumor activity. To a great extent, this is likely to be because these cells were retained and accumulate at the vaccination site where sustained antigen exposure impairs their effector functions.Citation9 Here, we report the new finding that SP-V-primed cells show reduced cytotoxic granule release and fail to differentiate into central memory phenotype. These results further support the limitations of SP-V for cancer immunotherapy.
To overcome this limitation of SP-V, Hailemichael et al. reported that non-persisting vaccine consisting of a combination of short peptide, CD40-specific antibody, Toll-like receptor 7 agonist (imiquimod) and IL-2 without IFA shifted T cell localization away from the vaccination site and encouraged migration to the tumor, thereby resulting in superior antitumor activity.Citation9 These findings are paralleled by our data on DC-V. In our approach, to prepare DC-V, BMDC were fully matured with LPS after which they expressed CD40, CD80, CD86, CD70, ICOSL and OX40L. This suggests that they possess fully-developed antigen presentation potential (Supplementary Fig. S1). When inoculated subcutaneously, they migrated to the draining lymph node and induced an appropriate immune response. Thereafter, abundant DC-V-primed CD8+ T cells were found to be present in the tumor ().
Though DC-V-primed pmel-1 cells contained both central (CD62L+CD44+) and effector (CD62L−CD44+) memory phenotype in the spleen, they lost CD62L+ population in the tumor, suggesting that they became effector cells (Supplementary Fig. S2). In addition, DC-V-primed pmel-1 cells infiltrating the tumor did express PD-1, but to a lesser extent than SP-V cells (). In addition, their expression of Tim-3 and LAG-3, as well as PD-1, was also higher in the tumor than in the spleen (Supplementary Fig. S3). These results indicate that the immunosuppressive tumor microenvironment, which includes but is not limited to, the PD-1/PD-L1 axis hampered the ability of the vaccine to induce anti-tumor immunity. Therefore, we tested combinations of cancer vaccines (SP-V or DC-V) with anti-PD-1 antibody treatment ( and ). In a chronic viral infection model, anti-PD-1 antibody was reported to reverse the functional defects of exhausted T cells with an intermediate but not high expression of PD-120. In our tumor model, large numbers of pmel-1 cells in the tumor of DC-V mice did express low level PD-1, whereas most of them in SP-V mice were PD-1high (): This suggested that the impaired function of DC-V-primed, but not SP-V-primed, pmel-1 cells in the tumor might be reversible with anti-PD-1 antibody treatment. Accordingly, we found that combination therapy with anti-PD-1 enhanced the anti-tumor effects of DC-V, but not SP-V, and suppressed tumor growth (). However, despite the fact that the combination of DC-V and anti-PD-1 antibody therapy significantly suppressed tumor growth, this was not sufficient to eliminate the tumor. Because DC-V-primed Pmel-1 cells expressed Tim-3 and LAG-3 in addition to PD-1 (), a combination of blocking antibodies for these other inhibitory receptors in addition to anti-PD-1 might be expected to enhance the anti-tumor effect of DC-V.
Tumors escape immune responses by multiple mechanisms. Immune-suppressive MDSC and regulatory T cells are often recruited into the tumor after immunotherapy.Citation21,22 Previously we showed that the NO scavenger C-PTIO suppressed MDSC and partially reversed their inhibitory effects on adoptive CTL transfer.Citation23 Glucose and amino acid metabolism are also altered in the tumor microenvironment.Citation24 Tumor cells compete with tumor infiltrating cells for glucose and other nutrients.Citation25,26 It remains to be elucidated whether DC-V-primed pmel-1 cells that can utilize fatty acid pathways have some advantages over SP-V-primed cells that depend entirely on glucose metabolism for their energy synthesis in the tumor.
While we detected more IFNγ production in tumor infiltrating pmel-1 cells in DC-V mice than SP-V mice (), there is no difference between them in . This is probably because the tumor volumes in was 2-fold larger than those of . The tumor microenvironment in large tumors might be more immunosuppressive and impaired the effector function of tumor-reactive T cells. Therefore, the difference between SP-V- and DC-V-primed pmel-1 cells was only detected in CD107a translocation ( and ).
In conclusion, we found that DC-V can prime and expand functional antigen-specific CD8+ T cells that are distinct from those primed by SP-V, resulting in more effective anti-tumor immunity (). DC-V rather than SP-V is thus recommended for combination with anti-PD-1 treatment to augment anti-tumor activity. Nonetheless, additional strategies to overcome immunosuppressive mechanisms in the tumor are still required for successful cancer immunotherapy.
Methods
Mice, tumor cells and reagents
Six-week-old female C57BL/6 mice were purchased from Japan SLC (Shizuoka, Japan). Pmel-1 TCR transgenic (Tg) mice were from The Jackson Laboratory (Bar Harbor, ME). Their T cells are CD90.1+ and recognize the gp100 25–33 epitope presented by H-2Db (EGSRNQDWL). All mice were kept in a specific pathogen-free environment. The animal use proposal and experimental protocols has been reviewed and approved by The University of Tokyo Animal Care and Use Committee (ID:15-P-122) and all animal procedures were conducted in accordance with institutional guidelines. B16F10 is a gp100-positive spontaneous murine melanoma cell line, kindly provided by Dr. N. Restifo (National Cancer Institute, Bethesda, MD) and maintained in DMEM (Wako Pure Chemical, Osaka, Japan) with 10% heat-inactivated fetal bovine serum (Sigma-Aldrich, St. Louis, MO), 100 mg/mL streptomycin and 100 U/mL penicillin (Wako Pure Chemical). The H-2Db-restricted short peptides of human gp100 (hgp10025–33: KVPRNQDWL) was purchased from GenScript Japan (Tokyo, Japan) at a purity of >95%, with a free amino and carboxyl terminal. CpG oligodeoxynucleotide with phosphorothioate backbone (5′-tccatgacgttcctgacgtt-3′) was purchased from Hokkaido System Science (Hokkaido, Japan). PE-Cy7 conjugated anti-Ki67 antibody was from eBioscience (San Diego, CA) and FITC-conjugated anti-CD90.1 and CD8α, PE-conjugated anti-CD62L, CD90.1 and TNFα, PerCP-Cy5.5-conjugated anti-LAG-3, PE-Cy7-conjugated anti-PD-1, CD44 and IFNγ, APC-conjugated anti-Tim-3 and CD107a, Alexa Fluor 647-conjugated anti-CD127, APC-Cy7-conjugated anti-CD45 and Pacific blue-conjugated anti-CD8α antibodies were from Biolegend (San Diego, CA). Anti-PD-1 antibody (clone RMP1-14) was from Bio X Cell (West Lebanon, NH).
Vaccination and assessment of tumor growth
For preparation of peptide vaccine, 50 µg hgp100 peptide and 20 µg CpG were emulsified with 50 µl complete or incomplete Freund's adjuvant (Sigma-Aldrich). For preparation of DC vaccine, bone marrow-derived DCs were prepared as described previously.Citation23 Briefly, bone marrow cells from femurs and tibias were cultured in RPMI-1640 supplemented with 10% FBS, 12.5 mM HEPES, 5 × 10⁻⁵ M 2-mercaptoethanol, 1 × 10⁻⁵ M sodium pyruvate, 1% nonessential amino acids, 100 U/ml penicillin, 100 μg/ml streptomycin and 20 ng/ml GM-CSF (PeproTech, Rocky Hill, NJ) for 8 days. DCs were stimulated with 1 µg/ml lipopolysaccharide (Wako Pure Chemical) for 16 h and pulsed with hgp100 peptide at 1 µg/ml for 2 h. To immunize mice, a hundred µl of peptide vaccine or 1 × 10⁶ of DCs were subcutaneously injected into the flank of mice.
To allow us to directly visualize antigen-specific CD8+ T cell responses ex vivo, the frequency of hgp100-specific CTL precursors of C57BL/6 mice was increased by intravenously injection of 1 × 10⁷ naïve spleen cells from pmel-1 TCR Tg mice prior to vaccination. Mice were then vaccinated twice at 2-week intervals. Frequencies of pmel-1 T cells, phenotypes and functions were evaluated 2 weeks after the second vaccination. To evaluate anti-tumor activity, vaccinated mice were challenged with 1 × 10⁶ B16F10 cells 2 weeks after the second vaccination. In the therapeutic model, C57BL/6 mice were inoculated with 1 × 10⁶ B16F10 cells on day 0. After intravenous injection of 1 × 10⁷ pmel-1 spleen cells on day 5, mice were vaccinated twice on days 5 and 12. Anti-PD-1 mAb (200 µg/mouse) was injected intraperitoneally three times on days 5, 8 and 12. Tumor growth was monitored every 2 to 3 days with calipers, and tumor volume was calculated by the formula π/6 × L1L2H, where L1 is the long diameter, L2 is the short diameter, and H is the height of the tumor. On day 18 or 19, mice were sacrificed and tumors and spleens were harvested.
Cell preparation and flow cytometry
Tumor-infiltrating cells were prepared using a murine Tumor Dissociation Kit (Miltenyi biotech, Bergish Gladbach, Germany) according to the manufacturer's protocol. After staining dead cells with the Zombie Yellow Fixable viability kit (Biolegend) and blocking of Fcγ receptors with anti-CD16/32 Ab (Bio X cell), mAbs for cell surface staining were added. For Ki67 staining, cells were fixed with Foxp3 fix/perm buffer set (Biolegend) and stained with anti-Ki67 antibody. To analyze mitochondria, cells were cultured with Mitotracker Deep Red (Thermo Fisher Scientific, Waltham, MA) or tetramethylrhodamine, ethyl ester (TMRE, Abcam, Cambridge, UK) for 30 min at 37°C. To analyze uptake of glucose analogue, cells were cultured with 2-[N-(7-Nitrobenz-2-oxa-1,3-diazol-4-yl) amino]-2-deoxy-D-glucose (2-NBDG, Peptide Institute, Osaka, Japan) at 80 µM for 30 min in glucose-free RPMI-1640 containing 10% FBS. For intracellular cytokine staining, cells were stimulated with 1 µg/ml hgp100 peptide in the presence of 10 µg/ml brefeldin A at 37°C for 4 hours. The cells were stained with Zombie Yellow Fixable Viability Kit and mAbs for cell surface antigens, followed by fixation, permeabilization and staining with PE-Cy7-conjugated anti-IFNγ and PE-conjugated anti-TNFα mAbs using Intraprep Permeabilization Reagent (Beckman Coulter, Brea, CA) according to the manufacturer's protocols. To evaluate degranulation of CD107a+ cytotoxic granules, cells were stimulated with 1 µg/ml hgp100 peptide in the presence of 2 µM monensin (Sigma Aldrich) and 1 µg/ml APC-conjugated anti-CD107a antibody for 4 hours. Cells were stained with Zombie Yellow Fixable Viability Kit, Pacific Blue-conjugated anti-CD8α and FITC-conjugated anti-CD90.1 antibodies. Stained cell data were acquired on a Gallios flow cytometer (Beckman Coulter) and analyzed with FlowJo (version 7.6.5, TreeStar, Ashland, OR).
Gene expression analysis
Spleen cells were harvested from vaccinated mice, pooled in each indicated group, and stained with FITC-conjugated anti-CD8α and PE-conjugated anti-CD90.1 mAbs. CD8+CD90.1+ cells were sorted on a FACS Aria II (BD Biosciences, San Jose, CA) and total RNA isolated using Trizol Reagent (Life technologies, Carlsbad, CA) and RNeasy spin columns (Qiagen, Hilden, Germany) according to the manufacturers' protocols. Gene expression was evaluated using SurePrint G3 Mouse GE 8 × 60 K Microarray Kit (Agilent Technologies). Datasets were normalized using the Subio Platform (Subio Inc. Kagoshima, Japan) as follows: (1) Signals were aligned at the 75th percentile. (2) Weak signals <4.0 were replaced with the value 4.0. (3) Fold changes to mean values were converted to log2. Probes were excluded if their gIsWellAboveBG values were 0 for all samples. The microarray data were deposited in the Gene Expression Omnibus (GEO) database (series accession number GSE94538; sample accession numbers GSM2477867-GSM2477869).
In vitro cell proliferation assay
Spleen cells were washed three times with PBS, labeled with 0.6 µM carboxyfluorescein diacetate succinimidyl ester (CFSE, Dojindo, Kumamoto, Japan) for 10 min at 37°C, washed three times with RPMI-1640 containing 10% FBS and cultured in the presence of 1 µg/ml hgp100 peptide and 100 U/ml human IL-2 (Novartis Corporation, Basel, Switzerland). The levels of fluorescent intensity of CD8+CD90.1+ cells before culture (day 0) were comparable within 3 groups. Two days later, fluorescence intensity of CFSE in CD8+CD90.1+ cells were monitored by flow cytometry.
Statistical analysis
Data are presented as mean ± SD. Statistical analyses were performed with JMP software (SAS Institute Inc., Cary, NC). Comparison of results was carried out by Wilcoxon rank sum test.
Data availability
The datasets generated during and/or analyzed during the current study are available from the corresponding author on reasonable request.
Competing interests
The authors declare no competing financial interests.
Author contributions
K.N., A.H., T.I. Y.M and H.M. conducted experiments and analyzed data. K.K. conceived the project, supervised the research and wrote the manuscript with K.N. All authors approved the final version.
2017ONCOIMM0673R1-f10-z-4c.pptx
Download MS Power Point (275.9 KB)Acknowledgments
This study was supported in part by JSPS KAKENHI (Grants-in-Aid for Scientific Research) Grant Number 16H04708 (to K.K.).
References
- Sharma P, Allison JP. The future of immune checkpoint therapy. Science. 2015;348:56–61. doi:10.1126/science.aaa8172.
- Callahan MK, Postow MA, Wolchok JD. Targeting T Cell Co-receptors for Cancer Therapy. Immunity. 2016;44:1069–78. doi:10.1016/j.immuni.2016.04.023.
- Hodi FS, O'Day SJ, McDermott DF, Weber RW, Sosman JA, Haanen JB, Gonzalez R, Robert C, Schadendorf D, Hassel JC, et al. Improved survival with ipilimumab in patients with metastatic melanoma. N Engl J Med. 2010;363:711–23. doi:10.1056/NEJMoa1003466.
- Garon EB, Rizvi NA, Hui R, Leighl N, Balmanoukian AS, Eder JP, Patnaik A, Aggarwal C, Gubens M, Horn L, et al. Pembrolizumab for the treatment of non-small-cell lung cancer. N Engl J Med. 2015;372:2018–28. doi:10.1056/NEJMoa1501824.
- Larkin J, Hodi FS, Wolchok JD. Combined Nivolumab and Ipilimumab or Monotherapy in Untreated Melanoma. N Engl J Med. 2015;373:1270–1. doi:10.1056/NEJMoa1504030.
- Lesokhin AM, Callahan MK, Postow MA, Wolchok JD. On being less tolerant: enhanced cancer immunosurveillance enabled by targeting checkpoints and agonists of T cell activation. Sci Transl Med. 2015;7:280sr1. doi:10.1126/scitranslmed.3010274. PMID:25810313
- Whiteside TL, Demaria S, Rodriguez-Ruiz ME, Zarour HM, Melero I. Emerging Opportunities and Challenges in Cancer Immunotherapy. Clin Cancer Res. 2016;22:1845–55. doi:10.1158/1078-0432.CCR-16-0049.
- Pol J, Bloy N, Buque A, Eggermont A, Cremer I, Sautes-Fridman C, Galon J, Tartour E, Zitvogel L, Kroemer G, et al. Trial Watch: Peptide-based anticancer vaccines. Oncoimmunology. 2015;4:e974411. doi:10.4161/2162402X.2014.974411. PMID:26137405
- Hailemichael Y, Dai Z, Jaffarzad N, Ye Y, Medina MA, Huang XF, Dorta-Estremera SM, Greeley NR, Nitti G, Peng W, et al. Persistent antigen at vaccination sites induces tumor-specific CD8(+) T cell sequestration, dysfunction and deletion. Nat Med. 2013;19:465–72. doi:10.1038/nm.3105.
- Melief CJ, van der Burg SH. Immunotherapy of established (pre)malignant disease by synthetic long peptide vaccines. Nat Rev Cancer. 2008;8:351–60. doi:10.1038/nrc2373.
- Carreno BM, Magrini V, Becker-Hapak M, Kaabinejadian S, Hundal J, Petti AA, Ly A, Lie WR, Hildebrand WH, Mardis ER, et al. Cancer immunotherapy. A dendritic cell vaccine increases the breadth and diversity of melanoma neoantigen-specific T cells. Science. 2015;348:803–8. doi:10.1126/science.aaa3828.
- Mitchell DA, Batich KA, Gunn MD, Huang MN, Sanchez-Perez L, Nair SK, Congdon KL, Reap EA, Archer GE, Desjardins A, et al. Tetanus toxoid and CCL3 improve dendritic cell vaccines in mice and glioblastoma patients. Nature. 2015;519:366–9. doi:10.1038/nature14320.
- Kishton RJ, Sukumar M, Restifo NP. Metabolic Regulation of T Cell Longevity and Function in Tumor Immunotherapy. Cell metabolism. 2017;26:94–109. doi:10.1016/j.cmet.2017.06.016.
- Chang JT, Wherry EJ, Goldrath AW. Molecular regulation of effector and memory T cell differentiation. Nat Immunol. 2014;15:1104–15. doi:10.1038/ni.3031.
- Kaech SM, Wherry EJ. Heterogeneity and cell-fate decisions in effector and memory CD8+ T cell differentiation during viral infection. Immunity. 2007;27:393–405. doi:10.1016/j.immuni.2007.08.007.
- Buck MD, O'Sullivan D, Pearce EL. T cell metabolism drives immunity. J Exp Med. 2015;212:1345–60. doi:10.1084/jem.20151159.
- Pearce EL, Walsh MC, Cejas PJ, Harms GM, Shen H, Wang LS, Jones RG, Choi Y.. Enhancing CD8 T-cell memory by modulating fatty acid metabolism. Nature. 2009;460:103–7. doi:10.1038/nature08097.
- van der Windt GJ, O'Sullivan D, Everts B, Huang SC, Buck MD, Curtis JD, Chang CH, Smith AM, Ai T, Faubert B, Jones RG, et al. CD8 memory T cells have a bioenergetic advantage that underlies their rapid recall ability. Proc Natl Acad Sci U S A. 2013;110:14336–41. doi:10.1073/pnas.1221740110.
- Sukumar M, Liu J, Mehta GU, Patel SJ, Roychoudhuri R, Crompton JG, Klebanoff CA, Ji Y, Li P, Yu Z, et al. Mitochondrial Membrane Potential Identifies Cells with Enhanced Stemness for Cellular Therapy. Cell metabolism. 2016;23:63–76. doi:10.1016/j.cmet.2015.11.002.
- Wherry EJ. T cell exhaustion. Nat Immunol. 2011;12:492–9.
- Hosoi A, Matsushita H, Shimizu K, Fujii S, Ueha S, Abe J, Kurachi M, Maekawa R, Matsushima K, Kakimi K. Adoptive cytotoxic T lymphocyte therapy triggers a counter-regulatory immunosuppressive mechanism via recruitment of myeloid-derived suppressor cells. Int J Cancer. 2014;134:1810–22. doi:10.1002/ijc.28506.
- Shalapour S, Karin M. Immunity, inflammation, and cancer: an eternal fight between good and evil. J Clin Invest. 2015;125:3347–55. doi:10.1172/JCI80007.
- Hirano K, Hosoi A, Matsushita H, Iino T, Ueha S, Matsushima K, Seto Y, Kakimi K. The nitric oxide radical scavenger carboxy-PTIO reduces the immunosuppressive activity of myeloid-derived suppressor cells and potentiates the antitumor activity of adoptive cytotoxic T lymphocyte immunotherapy. Oncoimmunology. 2015;4:e1019195. doi:10.1080/2162402X.2015.1019195. PMID:26405569
- Siska PJ, Rathmell JC. T cell metabolic fitness in antitumor immunity. Trends Immunol. 2015;36:257–64. doi:10.1016/j.it.2015.02.007.
- Chang CH, Qiu J, O'Sullivan D, Buck MD, Noguchi T, Curtis JD, Chen Q, Gindin M, Gubin MM, van der Windt GJ, et al. Metabolic Competition in the Tumor Microenvironment Is a Driver of Cancer Progression. Cell. 2015;162:1229–41. doi:10.1016/j.cell.2015.08.016.
- Ho PC, Bihuniak JD, Macintyre AN, Staron M, Liu X, Amezquita R, Tsui YC, Cui G, Micevic G, Perales JC, et al. Phosphoenolpyruvate Is a Metabolic Checkpoint of Anti-tumor T Cell Responses. Cell. 2015;162:1217–28. doi:10.1016/j.cell.2015.08.012.

