
ABSTRACT
T cells in colorectal cancer (CRC) are associated with improved survival. However, checkpoint immunotherapies antagonizing the suppression of these cells are ineffective in the great majority of patients. To better understand the immune cell regulation in CRC, we compared tumor-associated T lymphocytes and macrophages to the immune cell infiltrate of normal mucosa. Human colorectal tumor specimen and tumor-distant normal mucosa tissues of the same patients were collected. Phenotypes and functionality of tissue-derived T cells and macrophages were characterized using immunohistochemistry, RNA in situ hybridization, and multiparameter flow cytometry. CRC contained significantly higher numbers of potentially immunosuppressive CD39 and Helios-expressing regulatory T cells in comparison to normal mucosa. Surprisingly, we found a concomitant increase of pro-inflammatory IFNγ -producing T cells. PD-L1+ stromal cells were decreased in the tumor tissue. Macrophages in the tumor compared to tumor-distant normal tissue appear to have an altered phenotype, identified by HLA-DR, CD14, CX3CR1, and CD64, and tolerogenic CD206+ macrophages are quantitatively reduced. The prognostic effect of these observed differences between distant mucosa and tumor tissue on the overall survival was examined using gene expression data of 298 CRC patients. The combined gene expression of increased FOXP3, IFNγ, CD14, and decreased CD206 correlated with a poor prognosis in CRC patients. These data reveal that the CRC microenvironment promotes the coexistence of seemingly antagonistic suppressive and pro-inflammatory immune responses and might provide an explanation why a blockade of the PD1/PD-L1 axis is ineffective in CRC. This should be taken into account when designing novel treatment strategies.
Introduction
Colorectal cancer (CRC) is one of the most commonly diagnosed cancer and the third most common cause of cancer death.Citation1 Despite advances in surveillance, surgery, radio- and chemotherapy, 40% of affected patients still cannot be cured.Citation2,Citation3 An improved molecular understanding of CRC and its immune microenvironment might offer novel therapeutic concepts to improve survival.
It has been established that the T cell infiltrate correlates with a better prognosis in CRC.Citation4,Citation5 An immunoscore based on T cells, memory and/or cytotoxic T cells, was shown to be even superior to the TNM classification in predicting prognosis,Citation5,Citation6 emphasizing the importance of a pro-inflammatory immune cell infiltrate to fight malignant cells. The concept prompted therapeutic strategies to counteract immunosuppression in order to enhance or restore the potentially blocked function of T cells to ablate tumor cells.Citation7 This can be achieved by antibodies against immune checkpoint inhibitors such as the programmed cell death protein 1 (PD-1) or its ligand PD-L1.Citation8 However, checkpoint inhibition was not effective in most CRCs. Only the subpopulation of microsatellite instable (MSI) tumors benefit.Citation9,Citation10 Thus, there is a need to better understand the immunology of CRC to adequately design immunotherapies for microsatellite stable colorectal cancers.
Most of the studies, which analyzed the immunological microenvironment of tumors, compared the tumor-associated immune infiltrate between different patients. As every tissue has its own immunological requirements, a tumor has to modulate the existing immunologic landscape of the original tissue to prevent anti-tumor immune responses. Therefore, it is necessary to understand CRC-induced changes in the immune cell infiltrate in comparison to normal tissue. The normal colorectal mucosa represents the barrier against the luminal part of the intestine containing most of the bacteria and other species colonizing the human body. Thus, the immune system has to defend potential microbial translocations, and, at the same time, maintain the homeostasis to avoid exaggerated immune responses to ensure a non-inflamed, functioning bowel wall. Intestinal-resident macrophages have been associated with mucosal tolerance by clearing bacteria that transverse through the epithelial barrier and anti-inflammatory cytokine production.Citation11 Macrophages are highly heterogeneous and plastic cells acquiring pro- to anti-inflammatory phenotypes. CRC compared to normal intestine has a different composition of macrophage subtypes,Citation12 possibly due to macrophage plasticity. Conflicting data exist whether macrophages and which subtype contribute to CRC progression.Citation13–Citation17
Lymphocytes also provide defense functions in order to maintain the integrity of the epithelial barrier within the healthy intestinal mucosa.Citation18 These cells have an activated yet resting manifestationCitation19 and the memory phenotype is enriched among T cells.Citation11 T cell proliferation in the intestinal mucosa is limited by PD-L1 suggesting its role in mucosal tolerance.Citation20 CRC, in contrast, is characterized by high numbers of regulatory T cells.Citation21,Citation22 This led to the assumption that they contribute to immunosuppression within CRC by inhibiting the ability of cytotoxic T cells to produce IFNγ.Citation22 However, it is still under debate whether those tumor-associated Tregs are of prognostic impact and remain active in CRC.Citation23–Citation25
Given the essential role of T cells and macrophages in mucosal immunity and cancer, we reasoned that understanding the CRC-related immune regulation requires a comprehensive analysis of both cell types in comparison to normal tissue. We found that beside of an increase of regulatory T cells, CRC is associated with increased levels of the immune stimulatory cytokine IFNγ, but also with a down-regulation of PD-L1. Analysis of macrophages revealed that CRC is characterized by a reduction of tolerogenic macrophages. These differences between normal and malignant tissue indicate a status of immune-activation in the tumor, which includes both pro- and anti-inflammatory features. The combination of these immunological differences was associated with a negative prognosis in the overall survival of CRC patients.
Results
Leukocyte subpopulations in CRC and normal mucosa
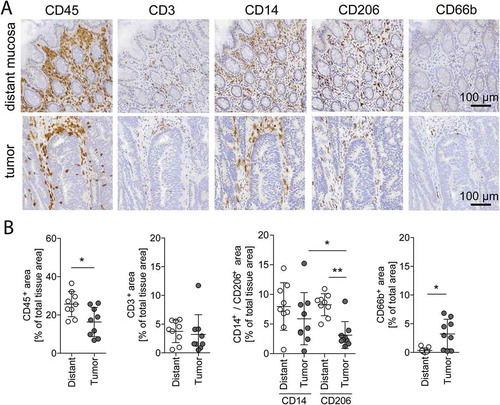
In order to determine the immunomodulatory effect of CRC, we compared the immune infiltration of tumor samples to that of tumor-distant normal mucosa from the same patients using quantitative immunohistochemistry and flow cytometry of tissue dissociates (Supplementary Fig. S1). Leukocytes, as defined by the pan-leukocyte marker CD45, were located in the lamina propria of the tumor-distant normal mucosa (, upper row). Consequently, also leukocyte subpopulations such as T cells (CD3+), granulocytes (CD66b+), and macrophages (CD14+, CD206+) were found in the same layer. Macrophages were the most abundant immune cells. The staining of cancerous tissue illustrates that immune cells accumulate mainly in the tumor stroma (, lower row). Quantification of the IHC staining showed a decrease of CD45 in tumor tissue compared to distant mucosa (, first; for quantification strategy see Supplementary Fig. S2). With respect to immune cell subpopulations, CD3 and CD14 expression were similar (, second and third), CD206 was less (, third), and CD66b was enriched in tumor (, fourth) compared to normal tissue. These results demonstrate a shift in the immune cell infiltration favoring granulocytes and diminishing CD206+ macrophages in the tumor microenvironment of colorectal cancer. The overall number of lymphocytes was unchanged. Given the essential role of lymphocytes for the prognosis of CRC, we focused on lymphocyte subpopulations next.
Figure 1. Immune cell quantification in distant mucosa and tumor tissue.
(A) Representative immunohistochemical stainings with antibodies against CD45 (leukocytes), CD3 (T cells), CD14 and CD206 (macrophages), and CD66b (granulocytes) in distant mucosa and tumor tissue of the same patient. Magnification: 20x, Scale bar: 100 µm. (B) Quantification of CD45+, CD3+, CD14+, CD206+, and CD66b+ IHC stained tissues of the same 9 patients. Error bars show mean with SD; * p < 0.05, ** p < 0.01, *** p < 0.001
Differences in lymphocyte subpopulations in CRC compared to tumor-distant mucosa
Tissue dissociates of 29 patients confirmed the unchanged overall number of lymphocytes (; for gating strategy see Supplementary Fig. S3). Investigating the relationship of lymphocyte subtypes revealed that B cells (CD19+) and CD8+ cells were reduced in CRC, leading to an increase of CD4+ cells and an increased CD4/CD8 ratio in tumor tissue compared to distant mucosa ( and ). CD69 is the earliest surface antigen expressed on T cells upon activation.Citation26 It was found to be expressed on the great majority of CD4+ and CD8+ cells in tumor tissue as well as distant mucosa (). However, there were significantly less CD8+ T cells in the tumor expressing CD69. This difference hints at a change in the activation or function of T cells in CRC.
Figure 2. Lymphocyte subpopulations in distant mucosa and tumor tissue.
(A) Flow cytometric quantification of lymphocytes in tumor-distant mucosa and tumor tissue (n = 29). (B) B and T cells were quantified from the lymphocyte population by CD19 (B cells, n = 14), CD4 (helper T cells, n = 29), and CD8 (cytotoxic T cells, n = 29). (C) Calculated CD4/CD8 cell ratio of the quantification shown in B (left, n = 29) and of IHC stained CD4 and CD8 tissue sections of four of the flow cytometry analyzed patients (right, n = 4). (D) T cells were analyzed for CD69 expression in distant mucosa and tumor tissue by flow cytometry (n = 11). Error bars show mean with SD; * p < 0.05, ** p < 0.01, *** p < 0.001
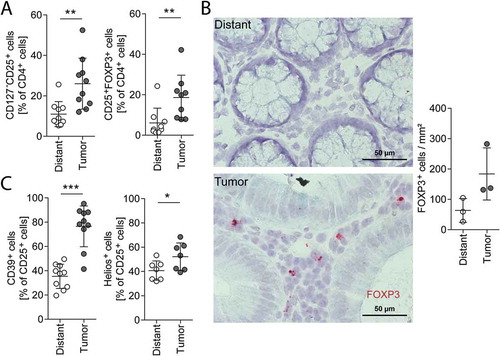
As we observed an increase in CD4+ cells in malignant tissue, we further focused on this subpopulation. Within the CD4 positive cell fraction, we detected a significant increase of Tregs in the tumor compared to distant mucosa, characterized by an increase of CD127− CD25+ cells (). This result could be confirmed by analyzing the intracellular FOXP3 protein level using flow cytometric analysis of tissue dissociates () as well as by visualization of FOXP3 mRNA-expressing cells in tissue sections using mRNA in situ hybridization (RNAscope; ). Functional immunosuppressive Tregs are characterized by CD39 and Helios.Citation27,Citation28 As we found an increase in those markers in Tregs of our tumor samples (), we suggest that CRC-associated Tregs are potentially immunosuppressive (, for gating strategy see Supplementary Fig. S4).
Figure 3. Tregs in distant mucosa and tumor tissue.
Treg analysis with flow cytometry (A, C) of distant mucosa and tumor tissue dissociates and FOXP3 mRNA-positive cell quantification on tissue sections (B) of the same patients. (A) CD127−CD25+ cells (Treg defined by surface markers, n = 10) and CD25+FOXP3+ cells (Treg defined by intracellular FOXP3 staining, n = 9) in distant mucosa and tumor tissue gated on CD4+ cells. (B) Photographs of FOXP3 mRNA (red) in distant mucosa (upper image) and tumor tissue (lower image) of the same patient. Quantification of FOXP3+ cells in distant mucosa and tumor sections of three patients (right). (C) CD39+ (n = 10) and Helios+ cells (n = 7) of CD25+ cells. Error bars show mean with SD; Magnification: 40x, Scale bar: 50 µm; * p < 0.05, ** p < 0.01, *** p < 0.001
We then examined the functionality of tissue-derived lymphocytes using ex vivo T cell receptor stimulation. This stimulation revealed that significantly more tumor-derived CD4+ and CD8+ cells produce IFNγ compared to cells derived from distant colorectal mucosa (; for gating strategy see Supplementary Fig. S5). Next, we visualized the IFNγ-producing cells in situ using RNAscope, an improved mRNA in situ hybridization method that is capable of single-molecule nucleic acid detection, where each RNA signal dot derives from a single mRNA molecule.Citation29 This allowed us to count each mRNA molecule and assign it to the producer cell, if combined with hematoxylin staining and/or IHC. IFNγ mRNA-positive cells were rarely detectable in distant mucosa () and if present, they expressed mostly only 1 IFNγ mRNA molecule per cell (). In contrast, we saw a significantly increased number of IFNγ mRNA-positive cells in several tumor tissues with many cells expressing 2 and more mRNAs per cell. About half of the IFNγ mRNA is produced by CD3+ T cells in the tumor tissue and about 30% in distant mucosa (, left). Only about 20% of CD8+ cytotoxic T cells were responsible for the IFNγ mRNA expression in distant and tumor tissue (, right). Thus, CD4+ T cells are the main IFNγ-producing T cells in CRC. IFNγ-expressing cells were observed also in close proximity to FOXP3+ cells indicating that these cell types are not mutually exclusive in the same microenvironment ().
Figure 4. Lymphocyte activity in vitro and in situ.
(A) In vitro IFNγ production of CD4+ (left) and CD8+ (right) cells unstimulated and stimulated ex vivo with anti-CD3/CD28 coated beads for 16 h, measured with flow cytometry. (B) IFNγ mRNA expressing cells quantified in situ on tissue sections of distant mucosa and tumors (n = 8). (C) Photograph of a tumor section showing the IFNγ mRNA staining (red). The quantification of cells expressing 1, 2–5 or more than 5 IFNγ mRNA per cell (arrows) is illustrated on the right (n = 8). Magnification: 40x, Scale bar: 50 µm. (D) Samples were stained for IFNγ mRNA using RNAscope and co-stained for either CD3 or CD8 by IHC (the insert shows an example of a CD8+INFγ+ cell). The graphs indicate the densities of IFNγ+ cells in the respective tissue and show additionally how many of them are CD3+ (left, distant n = 5, tumor n = 6) or CD8+ (right, distant n = 4, tumor n = 6). (E) Tumor tissue section stained for FOXP3 mRNA (red) and IFNγ mRNA (blue). Quantification of IFNγ mRNA+ cells in close proximity (max. 3 nuclei in between) to FOXP3+ cells (n = 3). All IFNγ mRNA+ cells are 100%. (F) IHC staining and quantification of PD-L1 in distant mucosa and tumor tissue (n = 9). Magnification: 20x, scale bar: 100 µm. Error bars show mean with SD; * p < 0.05, ** p < 0.01, *** p < 0.001
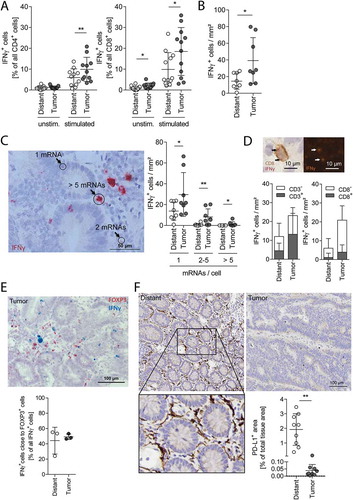
Next, we assessed the expression of PD-L1 in tissues by IHC. Total PD-L1 expression was significantly higher in the normal distant mucosa than in the tumor tissue (). The PD-L1 expression was mostly attributed to spindle structures in the lamina propria (Supplemental Fig. 6), which are presumably stromal cells. We could also detect membranous expression of PD-L1 on some malignant cells in tumor tissues and on few epithelial cells of distant mucosa (Supplemental Fig. 6), but this had little influence on the total PD-L1 signal.
Figure 5. Characteristics of macrophages in distant mucosa and tumor tissue.
(A) IHC stainings for CD14 and CD206 were used to calculate the CD14/CD206 ratio in distant mucosa and tumor tissue sections. (B) The tumor CD14/CD206 ratio was correlated with IFNγ mRNA+ cells of the same patients (n = 8). (C−H) CD14+ cells from distant mucosa and cancerous colorectal tissue of the same 11 patients were analyzed with flow cytometry. These cells were further subdivided into HLA-DRint/hi and CD206−/+ cells. (C) Geometric mean fluorescence intensity (gMFI) values of HLA-DR (C), CD14 (D), CD206 (E), CX3CR1 (F), SSC (G), and CD64 (H) of the subgroups are illustrated. Error bars show mean with SD; * p < 0.05, ** p < 0.01, *** p < 0.001
Figure 6. Cox regression analysis and FIM in CRC patients.
(A) FIM distribution in tumors according to the tumor stage, (B) in tumors classified according to consensus molecular subtypes (CMS), and (C) in MSS, MSI-L and MSI-H tumors. Boxplot shows median (bold line), 1st and 3rd quartiles as boxes ± 1.5 interquartile ranges as whiskers. (D) Univariate (left) and multivariate Cox regression analyses based on Akaike information criterion (AIC, right) for overall survival using: person neoplasm cancer status, lymphatic invasion, histology, tumor stage, tumor location, CMS, CD45 expression, and FIM. HR = hazard ratio; CI = 95% confidence interval. NA = not assigned. * Data from 298 patients were included in the univariate Cox regression analysis. In case a lower patient number was listed for a certain parameter, clinical data for the missing patients were not available. ** Multivariate Cox regression analysis was performed only on patients with complete data (n = 225).
Taken together, these data reveal that the colorectal tumor microenvironment manifested a reduction of cytotoxic CD8+ T cells plus an increase of potential immunosuppressive Tregs compared to normal mucosa. At the same time the T cells of the tumor are characterized by an elevated ability to produce the immune stimulator IFNγ. In addition, a decrease in the PD-L1 signal indicates the concomitant presence of immunosuppressive and immune stimulatory signals.
Tumor-associated macrophages have an altered phenotype compared to those of the tumor-distant mucosa
Quantification of CD206 and CD14 IHC stained tissues revealed that the number of CD206+ cells was reduced in tumor tissue as compared to distant mucosa, while CD14+ cells remained unchanged (). Nearly all CD206+ macrophages coexpressed CD163 (Supplementary Fig. S7A), which are both regarded as markers for anti-inflammatory and intestinal-resident tolerogenic macrophages.Citation30 Thus, the increased CD14/CD206 ratio observed in tumor tissue suggests a shift towards an inflammatory microenvironment (). This is supported by the observation that the CD14/CD206 ratio correlated with the number of IFNγ-producing cells in the tumor tissue (). Intestinal-resident tolerogenic macrophages produce IL10.Citation31 However, we were not able to detect CD206+IL10-expressing macrophages by IHC, neither in the tumor nor in the distant mucosa (Supplementary Fig. S7B). Although a few cells expressing IL10 have been observed with close proximity to CD206, the majority of these IL10+ cells seem to be macrophage-neighboring cells.
We subsequently quantified the expression intensity of various surface markers on macrophages by flow cytometry. Intestinal macrophages derive from peripheral blood monocytes and mature in response to stimuli of the intestinal microenvironment towards an anti-inflammatory phenotype.Citation30 To mimic phenotypic alterations of CRC macrophages, we polarized peripheral blood monocytes from healthy volunteers towards a pro-inflammatory phenotype with IFNγ and LPS and compared them to IL4 anti-inflammatory polarized macrophages. About two third of the macrophages remained CD14+ after polarization (Supplementary Fig. S8A). IFNγ/LPS-treated macrophages had lower HLA-DR and CD206 surface marker expressions (Supplementary Fig. S8B). Thus, we analyzed CD14+ macrophages from distant mucosa and CRC tissues and grouped them into HLA-DRintCD206−, HLA-DRhiCD206−, and HLA-DRhiCD206+ cells (; Supplementary Fig. S9A). Within the gate of HLA-DRhiCD206+ cells, cells of the tumor had lower HLA-DR level (), but higher CD14 levels compared to their non-tumorous distant mucosa counterpart (). The number of CD206+ macrophages was reduced in the tumor as compared to the distant mucosa (), but the CD206 expression levels of tumor and distant mucosa macrophage populations were unchanged (). CX3CR1 surface expression levels were significantly reduced in the tumor-derived macrophages (). As intestinal macrophages change their morphology during maturation with increasing side scatter,Citation32 we analyzed this parameter in our cell suspensions. It was highest in the CD206+ macrophages, and all three tumor macrophage populations had significantly increased SSC levels compared to the same populations in distant mucosa (). CD64 was also gradually increased on the cells from the tumor tissue, but not on cells from the distant mucosa ().
These results indicate that CRC macrophages have an altered phenotype compared to normal mucosal macrophages, presumably because of an impaired maturation and polarization in the tumor, resulting in a more pro-inflammatory state.
Correlation with overall survival
The data shown above indicate that the tumor microenvironment induces not only a change in number of infiltrating immune cells, but also alters their phenotype compared to the physiological environment of the healthy mucosa. We observed Tregs with a potentially more suppressive character, CD4+T lymphocytes in an active IFNγ-producing state, and macrophages shifted towards a higher CD14/CD206 ratio. In order to estimate the potential effect of this tumor immune cell composition on the disease progression in CRC patients, we examined the mRNA expression data from The Cancer Genome Atlas (TCGA) consortium.Citation33 In line with our findings, we defined a score in which expression levels of FOXP3, IFNγ, and CD14 contributed positively, whereas CD206 expression contributed negatively. We abbreviated this mRNA signature as “FIM”.
To start with, we grouped the patient collective according to the tumor stage, which is a routinely defined clinical parameter. FIM was similar in stage I to III CRCs, but it was reduced in stage IV tumors (). The latter show a decrease in lymphocyte densities and decreased gene expression of T helper 1 (Th1) responses.Citation34 As CRCs are genetically heterogeneous, we continued the analysis by categorizing the expression data into the four consensus molecular subtypes.Citation35 Tumors with high FIM values were preferentially classified as CMS1 (), which are tumors with Th1 immune cells and the majority of MSI tumors.Citation35 In agreement with this, MSI-H tumors have nearly exclusively high FIM values, although high FIM values were also found in MSS and MSI-L tumors ().
The FIM varied considerably within the different groups showing overlaps between groups. This raised the question about the relationship of FIM and patients’ survival. In a univariate Cox regression analysis FIM and other clinicopathological features were analyzed, each separately, for their influence on overall survival (). We included the person neoplasm cancer status (patients “with tumor” or “tumor free” at the date of last contact, i.e. the presence of a remaining tumor or recurrence at the end of the observation period), and several characteristics of the tumor at the begin of the observation period: lymphatic invasion, histology (mucinous versus non-mucinous adenocarcinomas), tumor stage, tumor localization (left, right, and transverse and unknown), consensus molecular subtypes, CD45 expression (as marker for the overall immune cell infiltration), and FIM. While the tumor stage and the person neoplasm status correlated with the overall survival, we found no significant impact of FIM alone. This was expected, because it is significantly different among tumor stages, lowest in metastatic stage IV tumors. Accordingly, it was also lower in patients with a positive person neoplasm cancer status (Supplementary Fig. S10A). Next, we investigated whether the FIM signature provides additional information to the indicated clinicopathological features (i.e. if it allows a prediction of overall survival independent of other variables). Therefore, we investigated the prognostic value of FIM on overall survival in a multivariate Cox regression analysis, combined with an algorithm for stepwise removal of prognostically irrelevant variables from the multivariate Cox regression model (Supplementary Fig. S10C), based on the Akaike information criterion. Person neoplasm cancer status (unfavorable) was still an independent predictor in this model. Additionally, patients with a high FIM had a significantly worse prognosis, indicating that also FIM is an independent predictor for overall survival. Analyses of each FIM parameter (FOXP3, IFNγ, CD14, and CD206; for histograms of frequencies see Supplementary Fig. S10B) alone in multivariate models, with the same cofactors as above, showed no significance (Supplementary Fig. S10D). Only the evaluation of these markers together revealed a prognostic impact, which points to a synergistic effect of these tumor microenvironmental immune characteristics. Multivariate analysis of FIM including CD66b is not a significant, independent marker for overall survival (data not shown). Taken together, these data confirm that the identified immunological alterations in the tumor compared to the normal mucosa create a distinct microenvironment that causes an unfavorable outcome in a subpopulation of CRC patients.
Discussion
Comparing the immune cell infiltration of normal mucosa to CRC revealed that immune cells adapt differentially to the distinct tissue microenvironments. In malignant tissue, we discovered an increased capacity of the immune cells to produce IFNγ, but at the same time an increased number of potentially immunosuppressive Tregs. With respect to the myeloid compartment, we observed a decrease in tolerogenic CD206+ colonic macrophages in CRC compared to normal mucosa. The observed differences in the local immune system were able to predict an unfavorable outcome in a subpopulation of CRC patients. Thus, our data indicate that pro- and anti-inflammatory mediators promote progression of CRC.
In agreement with previous studies, we found that tumor tissue induces a shift in the T cell infiltrate from CD8+ towards CD4+ cells, with a doubling of regulatory T cells compared to normal mucosa.Citation21,Citation22 We observed IFNγ being expressed in some CRC patients, but hardly in normal mucosa. We used a novel RNA ISH method, which allowed the quantification of IFNγ mRNAs per cell in situ. The results obtained by this technology are in accordance with observations described by Tosolini et al.Citation36 They observed an increased IFNγ mRNA in homogenized CRC as compared to normal tissue with real-time PCR. It has to be noted that not all IFNγ mRNA positive cells are CD3+ T cells. The identity of the remaining IFNγ mRNA positive cells is unclear. Innate immune cells, such as NK cells and macrophages, are also able to produce IFNγ.
The higher expression of IFNγ in the tumor might result from reduced PD-L1+ cells as found in the normal distant mucosa. This is supported by studies showing that PD-L1-expressing stromal cells are able to suppress T cell activation, proliferation and IFNγ production in the normal mucosa through PD-L1 dependent cell-contact interaction.Citation20,Citation37 Similarly, PD-L1 was shown to be decreased in the inflamed mucosa of Crohn’s disease patients with increased IFNγ levels.Citation38 Induced colitis experiments in mice showed that IFNγ is one of the most highly induced mediators in the inflamed gut.Citation39 This indicates that IFNγ is part of the tumor-induced inflammatory response and fits the idea that cancer is a chronic stimulus for the immune system. IFNγ production is generally assumed to improve patients’ prognosis. IFNγ-induced proteins and genes coding for a Th1 adaptive immunity, including IFNγ, are beneficial for survival and tumor recurrence in CRC patient, while deficiency of IFNγ or its receptor promotes CRC development in mice.Citation5,Citation40–Citation42 IFNγ alone had no significant influence on the patients’ outcome in our univariate analysis of the TCGA data.
Interestingly, we found IFNγ expression in the vicinity of Tregs. It is tempting to speculate that IFNγ has a direct effect on those cells, as IFNγ can induce Tregs.Citation43 Accordingly, aside of being a strong pro-inflammatory stimulus, at the same time, IFNγ might regulate the inflammatory environment by provoking the generation of Tregs in tumor tissue. Whether Tregs in CRC are a positive or negative prognostic factor is controversial.Citation22,Citation44,Citation45 In our study, FOXP3 alone had no prognostic impact on overall survival.
Our observation that more CD4+CD25+ cells than CD4+CD25+FOXP3+ cells exist could either be explained by a prior finding showing that not all CD4+CD25+ regulatory cells express FOXP3Citation46 or it might be a result of T cell activation, which could lead to a decrease of CD127 and an increase of CD25.Citation47 Additionally, tumor-derived Tregs express higher levels of CD39 and Helios. An increased CD39 expression on CRC-derived Tregs has been reported previously.Citation48 CD39hi Tregs are able to maintain their suppressive ability even in an inflammatory environment.Citation28 Helios was identified as key marker for activated Tregs with a more immunosuppressive character compared to Helios− Tregs.Citation27 Accordingly, both markers independently point towards a more immunosuppressive Treg phenotype in CRC. This matches the idea of an inflammatory environment in the tumor, as Tregs with a superior immunosuppressive capacity have been recently reported in inflamed colon tissue.Citation49
Additionally, tumor T lymphocytes showed a reduced expression of CD69. This marker is expressed by resident memory T cells, promoting cell retention in the tissue.Citation50,Citation51 CD69 might induce the production of TGF-β in colon tissue,Citation52,Citation53 which is important for balancing the gut homeostasis and avoiding colitis.Citation54 Thus, although CD69 on T cells in the tumor is still high, reduced CD69 levels might support a pro-inflammatory environment.
Aside of its potential role in activating pro- and anti-inflammatory T cells, IFNγ can also interact with macrophages inducing FcR for human monomeric IgG1 (CD64) on myeloid cells.Citation55 This correlates with our data, as we found IFNγ expression in the tumor as well as CD64 on tumor-associated macrophages increasingly expressed. This is in line with the finding that IFNγ-induced proteins are expressed by macrophages within colorectal cancers.Citation40 Furthermore, CD14+ intestinal macrophages from Crohn’s disease were previously shown to enhance IFNγ production by T cells.Citation56 The authors postulate that the intestinal inflammatory microenvironment in Crohn’s disease promotes an abnormal differentiation of intestinal macrophages. This might not only be true for IBD, but also for CRC, as suggested by our data. Peripheral monocytes constantly enter the colon to replenish the macrophage pool and these less mature CD14 high-expressing cells are heterogenous.Citation30 In the normal mucosa, we detected CD14-expressing macrophages with a differential expression of HLA-DR and CD206, which are similar to the previously described macrophage maturation populations in mice and human small intestine.Citation30,Citation32 Therefore, we assume that we have analyzed these maturation intermediates. CD14 high, HLA-DR low/intermediate and CD163 low expressing cells were suggested to be less mature cells similar to blood-derived CD14+ monocytes.Citation30,Citation32 In the human small intestine, CD14 low expressing cells, coexpress HLA-DR and CD163, which were suggested to be mature macrophages, equivalents to CX3CR1 high expressing cells in the mouse colon.Citation30 CX3CR1 was shown to increase during maturation in mouse models,Citation30 but recent studies with human intestinal macrophages revealed that it is decreased during their development from inflammatory freshly invaded macrophages to tolerogenic resident macrophages.Citation31,Citation32 We cannot exclude that the increase in CX3CR1 expression on the more mature CD206+ macrophage population observed in our study might have been influenced by macrophage extraction from the tissue, because this marker is strongly influenced by environmental factors, such as bacteria (Supplementary Fig. S9B, C) and during culture.Citation57 However, all other markers were stably expressed on macrophages.
The number of macrophages after tissue disaggregation in the flow cytometry analysis was lower compared to in situ IHC analysis. Thus, we cannot exclude that the macrophage yield was influenced by tissue digestion and processing resulting in a reduced macrophage recovery. However, the fact that we have observed differences in CD206 and CD14 between tumor and distant mucosa with IHC in situ supports our flow cytometric conclusions.
In contrast to the tumor-distant mucosa, macrophages from the tumor tissue showed decreased expression of HLA-DR and CX3CR1, and higher CD14 and CD64 levels compared to non-cancerous distant mucosa. This suggests an altered maturation with a presumably immature, pro-inflammatory character of myeloid cells within the tumor as compared to normal tissue. Similarly, it was shown that the maturation process is arrested during inflammation in the case of colitis where pro-inflammatory macrophages remain CX3CR1int.Citation30 Our data support the notion that tumor-associated macrophages are part of an inflammatory process. This is in line with data showing that colon cancer cell lines can polarize monocytes towards a pro-inflammatory macrophage phenotype.Citation58,Citation59
CD206+ macrophages and PD-L1 maintain tissue homeostasis in normal tissue,Citation20,Citation60,Citation61 both are altered in the tumor. Obviously, tumors have partially lost this tissue homeostasis leading to a dysregulated pro-inflammatory tumor microenvironment. IFNγ can promote both, pro-inflammatory macrophages and immunosuppressive Tregs. Tregs appear to counterbalance this otherwise pro-inflammatory tumor environment. Hence, pro-inflammatory stimuli might be the reason for more robust anti-inflammatory immune mediators, which both together predict an unfavorable outcome, as indicted by FIM. Therefore, we suggest that the tumor microenvironment induces a stimulation of both pathways that goad each other into an abundant immunologic response, which is incapable of tumor destruction.
Our findings suggest that interfering with the competing pro- and anti-inflammatory components of the tumor immune system might be a novel concept for therapeutic interventions in CRC. Ablation of Tregs might be a reasonable strategy to counteract their immunosuppressive effect in CRC. A tissue Treg-depleting antibody has been recently developed.Citation62 Intervening with the abundance of IFNγ in this CRC phenotype might even be further beneficial in this setting. Anti-inflammatory agents that target the immune cells, in combination with routinely used chemotherapeutics might be a new approach for these CRC patients. The reduced expression of PD-L1 in the tumor stroma might explain why targeting PD-L1 is of little use in CRC.Citation7,Citation63 Similarly, a potential anti-inflammatory CD206+ macrophage-ablating therapy could be inadequate, as those cells are already diminished. Such a therapy could even promote tumor growth, as suggested by our prognostic score. However, further studies are needed to identify a suitable treatment strategy for these patients. In view of that, we encourage the comparison of normal and malignant tissue to get a broader understanding of the cancer-associated immunology in order to design optimal immunotherapeutic strategies for every cancer type.
Materials and methods
Collection and processing of human colon mucosa and tumor tissue
Tissues of untreated colorectal cancers and distant normal mucosae were resected by a pathologist from the same surgical specimen. Tumor material as well as distant mucosa, which was at least 5 cm distant from the tumor (example shown in Supplementary Fig. S1A), were obtained from the same patients. As colorectal adenocarcinomas originate from epithelial cells of the mucosa and most of the immune cells can be found in this layer (Supplementary Fig. S1B), we focused only on the mucosa in all experiments. For patient characteristics see Supplementary Table S2. The patients gave their informed consent and sample collection was approved by the ethical committee (EK Nr.: 1984/2014) of the Medical University of Vienna. The fresh tissues were snap frozen and stored at −80°C. They were cryosectioned on a Leica CM3050 cryostat (Leica Microsystems GmbH, Wetzlar, DE) at a thickness of 10 µm. These sections were used for immunohistochemistry (IHC) and RNA in situ hybridization. Fresh tissues adjacent to IHC-stained sections were dissociated for flow cytometric analysis (see Supplementary Methods for details).
Single-molecule RNA in situ hybridization
RNA in situ hybridization experiments were performed using RNAscope®, an RNA in situ hybridization technique described previously.Citation29 All reagents were purchased from Advanced Cell Diagnostics (Newark, CA). Paired double-Z oligonucleotide probes were designed against target RNA using custom software. The following probes were used: Hs-IFNG, cat. no. 310501, NM_000619.2, 20 pairs, nt 80–1152; RNAscope® Probe- Hs-FOXP3-C2, cat. no. 418471-C2, NM_014009.3, 20 pairs nt 568–1620. The RNAscope® 2.5 HD Reagent Kit and RNAscope® 2.5 HD Duplex Assay (Advanced Cell Diagnostics) were used according to the manufacturer’s instructions. Fresh frozen tissue sections were prepared according to manufacturer’s recommendations. Each sample was quality controlled for RNA integrity with a probe specific to the housekeeping gene PPIB. Negative control background staining was evaluated using a probe specific to the bacterial dapB gene. Slides were either washed in tap water and counterstained with hematoxylin or washed in DPBS and immunohistochemically doubled stained with CD3 or CD8. IHC staining continued at the Bloxall step and was performed as described in Supplementary Methods.
Statistical analysis
Untreated human distant mucosa and cancerous colon tissues were collected chronologically. Every tissue piece was frozen for IHC analysis. Tissue samples weighing more than 0.1 mg were used for tissue dissociation and flow cytometric analysis. P-values under 0.05 were considered statistically significant. The two-tailed paired t-test was used for normally distributed data, and the Wilcoxon matched-pairs signed-ranks test was chosen as nonparametric test. Pearson’s correlation was used to analyze the association between IFNγ- producing cells and the CD14/CD206 ratio. Normal distribution was analyzed with the D’Agostino and Pearson omnibus normality test. The statistical analyses were performed with GraphPad Prism version 6.04.
Gene expression data from The Cancer Genome Atlas (TCGA)Citation33 colorectal cancer tissues were downloaded using R package TCGA2STAT v1.2Citation64 together with corresponding clinicopathologic and outcome data. Finally, expression data of 298 samples were used (see for characteristics) and normalized with limmas’ voomWithQualityWeights function employing cyclic loess normalization (R package limma v3.34.9)Citation65. Prior to this, reliably expressed genes were selected with counts per million values above 0.1 in at least 95 of samples, i.e. 16,577 genes. The consensus molecular subtypesCitation35 were determined using R-package CMSclassifier using Entrez IDs as gene identifier and method “random forest” (https://github.com/Sage-Bionetworks/CMSclassifier). FIM was calculated by summing the normalized log2 gene expression values according to this formula: expression (IFNy) + exp (FOXP3) + exp (CD14) – exp (MRC1 (= CD206)).
Significant differences of FIM according to clinicopathologic characteristics were determined by one-way ANOVA tests. Single and multiple Cox regression estimates were calculated by the coxph function (R v3.4.3)Citation66 and the final Cox regression model selected based on Akaike Information Criteria (AIC) using the stepAIC-function from R-package MASS v7.3–48.Citation67
Disclosure of potential conflicts of interest
The authors declare no potential conflicts of interest.
Supplemental Material
Download Zip (16.7 MB)Acknowledgments
We thank Fritz Garo and Monika Sachet (Department of Surgery, Medical University of Vienna) for their excellent technical support and scanning of the stained tissues, Maja Corcokovic (Department of Surgery, Medical University of Vienna) for helping with the establishment of the IFNγ assay, and Sabine Rauscher (Core Facility Imaging, Medical University of Vienna) for helping with image acquisition.
Supplementary material
Supplemental data for this article can be accessed here.
Additional information
Funding
Related Research Data
References
- Siegel RL, Miller KD, Jemal A. Cancer statistics. CA Cancer J Clin. 2018;68(1):7–30. doi:10.3322/caac.21442.
- Augestad KM, Merok MA, Ignatovic D. Tailored treatment of colorectal cancer: surgical, molecular, and genetic considerations. Clin Med Insights Oncol. 2017;11. doi:10.1177/1179554917690766.
- Schmoll HJ, Van Cutsem E, Stein A, Valentini V, Glimelius B, Haustermans K, Nordlinger B, Van de Velde CJ, Balmana J, Regula J, et al. Esmo consensus guidelines for management of patients with colon and rectal cancer. A personalized approach to clinical decision making. Ann Oncol. 2012;23(10):2479–2516. doi:10.1093/annonc/mds236.
- Naito Y, Saito K, Shiiba K, Ohuchi A, Saigenji K, Nagura A, Ohtani H. CD8(+) T cells infiltrated within cancer cell nests as a prognostic factor in human colorectal cancer. Cancer Res. 1998;58(16):3491–3494.
- Galon J, Costes A, Sanchez-Cabo F, Kirilovsky A, Mlecnik B, Lagorce-Pagès C, Tosolini M, Camus M, Berger A, Wind P, et al. Type, density, and location of immune cells within human colorectal tumors predict clinical outcome. Science. 2006;313:1960−1964. doi:10.1126/science.1129139.
- Mlecnik B, Tosolini M, Kirilovsky A, Berger A, Bindea G, Meatchi T, Bruneval P, Trajanoski Z, Fridman W-H-H, Pagès F, et al. Histopathologic-based prognostic factors of colorectal cancers are associated with the state of the local immune reaction. J Clin Oncol. 2011;29(6):610–618. doi:10.1200/JCO.2010.30.5425.
- Topalian SL, Hodi FS, Brahmer JR, Gettinger SN, Smith DC, McDermott DF, Powderly JD, Carvajal RD, Sosman JA, Atkins MB, et al. Safety, activity, and immune correlates of anti-PD-1 antibody in cancer. N Engl J Med. 2012;366(26):2443−2454. doi:10.1056/NEJMoa1200690.
- Markman JL, Shiao SL. Impact of the immune system and immunotherapy in colorectal cancer. J Gastrointest Oncol. 2015;6(2):208–223. doi:10.3978/j.issn.2078-6891.2014.077.
- Llosa NJ, Cruise M, Tam A, Wicks EC, Hechenbleikner EM, Taube JM, Blosser RL, Fan H, Wang H, Luber BS, et al. The vigorous immune microenvironment of microsatellite instable colon cancer is balanced by multiple counter-inhibitory checkpoints. Cancer Discov. 2015;5:43−51. doi:10.1158/2159-8290.CD-14-0863.
- Xiao Y, Freeman GJ. The microsatellite instable subset of colorectal cancer is a particularly good candidate for checkpoint blockade immunotherapy. Cancer Discov. 2015;5(1):16–18. doi:10.1158/2159-8290.CD-14-1397.
- Peterson LW, Artis D. Intestinal epithelial cells: regulators of barrier function and immune homeostasis. Nat Rev Immunol. 2014;14:141−153. doi:10.1038/nri3608.
- Norton SE, Dunn ETJ, McCall JL, Munro F, Kemp RA. Gut macrophage phenotype is dependent on the tumor microenvironment in colorectal cancer. Clin Transl Immunol. 2016;5(4):e76. doi:10.1038/cti.2016.21.
- Edin S, Wikberg ML, Dahlin AM, Rutegård J, Öberg Å, Oldenborg P-A-A, Palmqvist R, Rutegard J, Oberg A, Oldenborg P-A-A, et al. The distribution of macrophages with a M1 or M2 phenotype in relation to prognosis and the molecular characteristics of colorectal cancer. PLoS One. 2012;7(10):e47045. doi:10.1371/journal.pone.0047045.
- Ålgars A, Irjala H, Vaittinen S, Huhtinen H, Sundström J, Salmi M, Ristamäki R, Jalkanen S. Type and location of tumor-infiltrating macrophages and lymphatic vessels predict survival of colorectal cancer patients. Int J Cancer. 2012;131(4):864–873. doi:10.1002/ijc.26457.
- Marech I, Ammendola M, Sacco R, Sammarco G, Zuccalà V, Zizzo N, Leporini C, Luposella M, Patruno R, Filippelli G, et al. Tumour-associated macrophages correlate with microvascular bed extension in colorectal cancer patients. J Cell Mol Med. 2016;20(7):1373–1380. doi:10.1111/jcmm.12826.
- Gulubova M, Ananiev J, Yovchev Y, Julianov A, Karashmalakov A, Vlaykova T. The density of macrophages in colorectal cancer is inversely correlated to TGF-β1 expression and patients’ survival. J Mol Histol. 2013;44:679–692. doi:10.1007/s10735-013-9520-9.
- Koelzer VH, Canonica K, Dawson H, Sokol L, Karamitopoulou-Diamantis E, Lugli A, Zlobec I. Phenotyping of tumor-associated macrophages in colorectal cancer: impact on single cell invasion (tumor budding) and clinicopathological outcome. Oncoimmunology. 2016;5(4):1−10. doi:10.1080/2162402X.2015.1106677.
- Cheroutre H, Lambolez F, Mucida D. The light and dark sides of intestinal intraepithelial lymphocytes. Nat Rev Immunol. 2011;11(7):445–456. doi:10.1038/nri3007.
- Shires J, Theodoridis E, Hayday AC. Biological insights into TCR gamma delta+ and TCR alpha beta+ intraepithelial lymphocytes provided by serial analysis of gene expression (SAGE). Immunity. 2001;15:419–434. doi:10.1016/S1074-7613(01)00192-3.
- Pinchuk IV, Saada JI, Beswick EJ, Boya G, Qiu SM, Mifflin RC, Raju GS, Reyes VE, Powell DW. PD-1 ligand expression by human colonic myofibroblasts/fibroblasts regulates CD4+ T-cell activity. Gastroenterology. 2008;135:1228–1237. doi:10.1053/j.gastro.2008.07.016.
- Koch M, Beckhove P, Den WJ, Autenrieth D, Wagner P, Nummer D, Specht S, Antolovic D, Galindo L, Schmitz-Winnenthal FH, et al. Tumor infiltrating T lymphocytes in colorectal cancer. Ann Surg. 2006;244(6):986−993. doi:10.1097/01.sla.0000247058.43243.7b.
- Sinicrope FA, Rego RL, Ansell SM, Knutson KL, Foster NR, Sargent DJ. Intraepithelial effector (CD3+)/regulatory (FoxP3+) T-cell ratio predicts a clinical outcome of human colon carcinoma. Gastroenterology. 2009;137:1270–1279. doi:10.1053/j.gastro.2009.06.053.
- Zhang X, Kelaria S, Kerstetter J, Wang J. The functional and prognostic implications of regulatory T cells in colorectal carcinoma. J Gastrointest Oncol. 2015;6(3):307–313. doi:10.3978/j.issn.2078-6891.2015.017.
- Saito T, Nishikawa H, Wada H, Nagano Y, Sugiyama D, Atarashi K, Maeda Y, Hamaguchi M, Ohkura N, Sato E, et al. Two FOXP3+CD4+ T cell subpopulations distinctly control the prognosis of colorectal cancers. Nat Med. 2016;22(6):679–684. doi:10.1038/nm.4086.
- Tanaka A, Sakaguchi S. Regulatory T cells in cancer immunotherapy. Cell Res. 2017;27(1):109–118. doi:10.1038/cr.2016.151.
- Ziegler SF, Ramsdell F, Alderson MR. The activation antigen CD69. Stem Cells. 1994;12:456−465. doi:10.1002/stem.5530120502.
- Elkord E, Abd Al Samid M, Chaudhary B. Helios, and not FoxP3, is the marker of activated Tregs expressing GARP/LAP. Oncotarget. 2015;6(24):20026−20036. doi:10.18632/oncotarget.4771.
- Gu J, Ni X, Pan X, Lu H, Lu Y, Zhao J, Guo Zheng S, Hippen KL, Wang X, Lu L. Human CD39hi regulatory T cells present stronger stability and function under inflammatory conditions. Cell Mol Immunol. 2017;14(6):521−528. doi:10.1038/cmi.2016.30.
- Wang F, Flanagan J, Su N, Wang LC, Bui S, Nielson A, Wu X, Vo HT, Ma XJ, Luo Y. RNAscope: A novel in situ RNA analysis platform for formalin-fixed, paraffin-embedded tissues. J Mol Diagn. 2012;14(1):22–29. doi:10.1016/j.jmoldx.2011.08.002.
- Bain CC, Scott CL, Uronen-Hansson H, Gudjonsson S, Jansson O, Grip O, Guilliams M, Malissen B, Agace WW, Mowat AM. Resident and pro-inflammatory macrophages in the colon represent alternative context-dependent fates of the same Ly6Chi monocyte precursors. Mucosal Immunol. 2013;6(3):498–510. doi:10.1038/mi.2012.89.
- Bernardo D, Marin AC, Fernández-Tomé S, Montalban-Arques A, Carrasco A, Tristán E, Ortega-Moreno L, Mora-Gutiérrez I, Díaz-Guerra A, Caminero-Fernández R, et al. Human intestinal pro-inflammatory CD11chighCCR2+CX3CR1+ macrophages, but not their tolerogenic CD11c−CCR2−CX3CR1− counterparts, are expanded in inflammatory bowel disease. Mucosal Immunol. 2018;11:1114–1126. doi:10.1038/s41385-018-0030-7.
- Bujko A, Atlasy N, Landsverk OJB, Richter L, Yaqub S, Horneland R, Øyen O, Aandahl EM, Aabakken L, Stunnenberg HG, et al. Transcriptional and functional profiling defines human small intestinal macrophage subsets. J Exp Med. 2018;215(2):441–458. doi:10.1084/jem.20170057.
- The Cancer Genome Atlas Network. Comprehensive molecular characterization of human colon and rectal cancer. Nature. 2012;487(7407):330–337. doi:10.1038/nature11252.
- Mlecnik B, Bindea G, Kirilovsky A, Angell HK, Obenauf AC, Tosolini M, Church SE, Maby P, Vasaturo A, Angelova M, et al. The tumor microenvironment and Immunoscore are critical determinants of dissemination to distant metastasis. Sci Transl Med. 2016;8(327):1−14. doi:10.1126/scitranslmed.aad6352.
- Guinney J, Dienstmann R, Wang X, de Reyniès A, Schlicker A, Soneson C, Marisa L, Roepman P, Nyamundanda G, Angelino P, et al. The consensus molecular subtypes of colorectal cancer. Nat Med. 2015;21(11):1350–1356. doi:10.1038/nm.3967.
- Tosolini M, Kirilovsky A, Mlecnik B, Fredriksen T, Mauger S, Bindea G, Berger A, Bruneval P, Fridman WH, Pagès F, et al. Clinical impact of different classes of infiltrating T cytotoxic and helper cells (Th1, Th2, Treg, Th17) in patients with colorectal cancer. Cancer Res. 2011;71(4):1263–1271. doi:10.1158/0008-5472.CAN-10-2907.
- Beswick EJ, Johnson JR, Saada JI, House J, Dann S, Qiu S, Allan R, Powell DW, Reyes VE, Irina V. TLR4 activation enhances the PD-L1 − mediated tolerogenic capacity of colonic CD90 + stromal cells. J Immunol. 2014;193:2218–2229. doi:10.4049/jimmunol.1203441.
- Beswick EJ, Grim C, Singh A, Aguirre JE, Tafoya M, Pinchuk IV. Expression of programmed death-ligand 1 by human colonic CD90+ stromal cells differs between ulcerative colitis and Crohn’s disease and determines their capacity to suppress Th1 cells. Front Immunol. 2018;9:1125. doi:10.3389/fimmu.2018.01125.
- Nava P, Koch S, Laukoetter MG, Lee WY, Kolegraff K, Capaldo CT, Beeman N, Addis C, Gerner-Smidt K, Neumaier I, et al. Interferon-gamma regulates intestinal epithelial homeostasis through converging beta-catenin signaling pathways. Immunity. 2010;32(3):392−402. doi:10.1016/j.immuni.2010.03.001.
- Naschberger E, Croner RS, Merkel S, Dimmler A, Tripal P, Amann KU, Kremmer E, Brueckl WM, Papadopoulos T, Hohenadl C, et al. Angiostatic immune reaction in colorectal carcinoma: impact on survival and perspectives for antiangiogenic therapy. Int J Cancer. 2008;123(9):2120–2129. doi:10.1002/ijc.23764.
- Grenz S, Naschberger E, Merkel S, Britzen-Laurent N, Schaal U, Konrad A, Aigner M, Rau TT, Hartmann A, Croner RS, et al. IFN-γ-driven intratumoral microenvironment exhibits superior prognostic effect compared with an IFN-α-driven microenvironment in patients with colon carcinoma. Am J Pathol. 2013;183(6):1897–1909. doi:10.1016/j.ajpath.2013.08.025.
- Wang L, Wang Y, Song Z, Chu J, Qu X. Deficiency of interferon-gamma or its receptor promotes colorectal cancer development. J Interf Cytokine Res. 2015;35(4):273−280. doi:10.1089/jir.2014.0132.
- Wang Z, Hong J, Sun W, Xu G, Li N, Chen X, Liu A, Xu L, Sun B, Zhang JZ. Role of IFN-γ in induction of Foxp3 and conversion of CD4+CD25– T cells to CD4+ Tregs. J Clin Invest. 2006;116(9):2434–2441. doi:10.1172/JCI25826.2434.
- Shang B, Liu Y, Jiang S, Liu Y. Prognostic value of tumor-infiltrating FoxP3+ regulatory T cells in cancers: a systematic review and meta-analysis. Sci Rep. 2015;5(1):15179. doi:10.1038/srep15179.
- Berntsson J, Svensson MC, Leandersson K, Nodin B, Micke P, Larsson AH, Eberhard J, Jirström K. The clinical impact of tumour-infiltrating lymphocytes in colorectal cancer differs by anatomical subsite: a cohort study. Int J Cancer. 2017;141:1654–1666. doi:10.1002/ijc.30869.
- Scurr M, Ladell K, Besneux M, Christian A, Hockey T, Smart K, Bridgeman H, Hargest R, Phillips S, Davies M, et al. Highly prevalent colorectal cancer-infiltrating LAP+ Foxp3− T cells exhibit more potent immunosuppressive activity than Foxp3+ regulatory T cells. Mucosal Immunol. 2014;7(2):428−439. doi:10.1038/mi.2013.62.
- Rodríguez-Perea AL, Arcia ED, Rueda CM, Velilla PA. Phenotypical characterization of regulatory T cells in humans and rodents. Clin Exp Immunol. 2016;185(3):281–291. doi:10.1111/cei.12804.
- Sundström P, Stenstad H, Langenes V, Ahlmanner F, Theander L, Ndah TG, Fredin K, Borjesson L, Gustavsson B, Bastid J, et al. Regulatory T cells from colon cancer patients inhibit effector T-cell migration through an adenosine-dependent mechanism. Cancer Immunol Res. 2016;4(3):183−193. doi:10.1158/2326-6066.CIR-15-0050.
- Nakanishi Y, Ikebuchi R, Chtanova T, Kusumoto Y, Okuyama H, Moriya T, Honda T, Kabashima K, Watanabe T, Sakai Y, et al. Regulatory T cells with superior immunosuppressive capacity emigrate from the inflamed colon to draining lymph nodes. Mucosal Immunol. 2017 Aug 2. doi:10.1038/mi.2017.64.
- Sathaliyawala T, Kubota M, Yudanin N, Turner D, Camp P, Thome JJC, Bickham KL, Lerner H, Goldstein M, Sykes M, et al. Distribution and compartmentalization of human circulating and tissue-resident memory T cell subsets. Immunity. 2013;38(1):187–197. doi:10.1016/j.immuni.2012.09.020.
- Cibrián D, Sánchez-Madrid F. CD69: from activation marker to metabolic gatekeeper. Eur J Immunol. 2017;47(6):946–953. doi:10.1002/eji.201646837.
- Marazuela M, García-López MA, Figueroa-Vega N, de la Fuente H, Alvarado-Sánchez B, Monsiváis-Urenda A, Sánchez-Madrid F, González-Amaro R. Regulatory T cells in human autoimmune thyroid disease. J Clin Endocrinol Metab. 2006;91(9):3639–3646. doi:10.1210/jc.2005-2337.
- Radulovic K, Niess JH. CD69 is the crucial regulator of intestinal inflammation: a new target molecule for IBD treatment? J Immunol Res. 2015;2015:1–12. doi:10.1155/2015/497056.
- Konkel JE, Chen W. Balancing acts: the role of TGF-beta in the mucosal immune system. Trends Mol Med. 2011;17(11):668–676. doi:10.1016/j.molmed.2011.07.002.
- Perussia B, Dayton ET, Lazarus R, Fanning V, Trinchieri G. Immune interferon induces the receptor for monomeric IgG1 on human monocytic and myeloid cells. J Exp Med. 1983;158:1092–1113. doi:10.1084/jem.158.4.1092.
- Kamada N, Hisamatsu T, Okamoto S, Chinen H, Kobayashi T, Sato T, Sakuraba A, Kitazume MT, Sugita A, Koganei K, et al. Unique CD14+ intestinal macrophages contribute to the pathogenesis of Crohn disease via IL-23/IFN-γ axis. J Clin Invest. 2008;118(6):2269–2280. doi:10.1172/JCI34610DS1.
- Ramos MV, Fernández GC, Brando RJF, Panek CA, Bentancor LV, Landoni VI, Isturiz MA, Palermo MS. Interleukin-10 and interferon-γ modulate surface expression of fractalkine-receptor (CX3CR1) via PI3K in monocytes. Immunology. 2010;129:600–609. doi:10.1111/j.1365-2567.2009.03181.x.
- Bögels M, Braster R, Nijland PG, Gü N, van de Luijtgaarden W, Fijneman RJA, Meijer GA, Jimenez CR, Beelen RHJ, van Egmond M. Carcinoma origin dictates differential skewing of monocyte function. Oncoimmunology. 2012;1(6):798–809. doi:10.4161/onci.20427.
- Ong SM, Tan YC, Beretta O, Jiang D, Yeap WH, Tai JJYY, Wong WC, Yang H, Schwarz H, Lim KH, et al. Macrophages in human colorectal cancer are pro-inflammatory and prime T cells towards an anti-tumour type-1 inflammatory response. Eur J Immunol. 2012;42(1):89–100. doi:10.1002/eji.201141825.
- Harada K, Dong X, Estrella JS, Correa AM, Xu Y, Hofstetter WL, Sudo K, Onodera H, Suzuki K, Suzuki A, et al. Tumor-associated macrophage infiltration is highly associated with PD-L1 expression in gastric adenocarcinoma. Gastric Cancer. 2018;21:31–40. doi:10.1007/s10120-017-0760-3.
- Nishimura H, Honjo T. PD-1: an inhibitory immunoreceptor involved in peripheral tolerance. Trends Immunol. 2001;22(5):265–268. doi:10.1016/S1471-4906(01)01888-9.
- Arce Vargas F, Furness AJS, Solomon I, Joshi K, Mekkaoui L, Lesko MH, Miranda Rota E, Dahan R, Georgiou A, Sledzinska A, et al. Fc-optimized anti-CD25 depletes tumor-infiltrating regulatory T cells and synergizes with PD-1 blockade to eradicate established tumors. Immunity. 2017;46(4):577–586. doi:10.1016/j.immuni.2017.03.013.
- Brahmer, Julie; Tykodi, Scott; Chow L, Hwu W, Ph D, Topalian SL, Hwu P, Drake CG, Camacho LH, Kauh J, Odunsi K, et al. Safety and activity of anti–PD-L1 antibody in patients with advanced cancer. N Engl J Med. 2012;366(26):2455–2465.
- Wan YW, Allen GI, Anderson ML, Liu Z. TCGA2STAT: simple TCGA data access for integrated statistical analysis in R. R package version 1.2. Bioinformatics. 2015;32(6):952–954. doi:10.1093/bioinformatics/btv677.
- Ritchie ME, Phipson B, Wu D, Hu Y, Law CW, Shi W, Smyth GK. limma powers differential expression analyses for RNA-sequencing and microarray studies. Nucleic Acids Res. 2015;43(7):e47. doi:10.1093/nar/gkv007.
- R Core Team. R: a language and environment for statistical computing. R Found Stat Comput. 2017;1(2.11.1):409. doi:10.1007/978-3-540-74686-7.
- Venables WN, Ripley BD. Modern applied statistics with S. Technometrics. 2003;45(1):111. doi:10.1198/tech.2003.s33.