
ABSTRACT
Tumor-associated neo-antigens are mutated peptides that allow the immune system to recognize the affected cell as foreign. Cells carrying excessive mutation load often develop mechanisms of tolerance. PD-L1/PD-1 checkpoint immunotherapy is a highly promising approach to overcome these protective signals and induce tumor shrinkage. Yet, the nature of the neo-antigens driving those beneficial responses remains unclear. Here, we show that APOBEC-related mutagenesis – a mechanism at the crossroads between anti-viral immunity and endogenous nucleic acid editing – increases neo-peptide hydrophobicity (a feature of immunogenicity), as demonstrated by in silico computation and in the TCGA pan-cancer cohort, where APOBEC-related mutagenesis was also strongly associated with immune marker expression. Moreover, APOBEC-related mutagenesis correlated with immunotherapy response in a cohort of 99 patients with diverse cancers, and this correlation was independent of the tumor mutation burden (TMB). Combining APOBEC-related mutagenesis estimate and TMB resulted in greater predictive ability than either parameter alone. Based on these results, further investigation of APOBEC-related mutagenesis as a marker of response to anti-cancer checkpoint blockade is warranted.
Antigen presentation is the process by which endogenous and/or exogenous protein fragments are presented to the immune system in the form of short peptides associated with antigen-presenting molecules. There are two types of antigen-presenting molecules: (i) major histocompatibility complex (MHC) class I molecules displaying peptides of 8–10 residues (derived from intracellular proteins) to CD8+ cytotoxic T-cells; and (ii) MHC class II molecules found on antigen-presenting cells displaying peptides of 18–20 residues (derived from extracellular proteins) to CD4+ helper T-cells.Citation1 If the cells are healthy, only ‘self’ peptides will be displayed and will be greeted by immunological tolerance; if the cells have been infected by pathogens, ‘non-self’ peptides will appear and activate the antigen-specific immune response.
A similar mechanism should be observed with tumor cells harboring somatic mutations. The higher the number of genomic alterations, the more likely that the mutated cells will produce a set of proteins different from non-mutated cells and capable of triggering immune activation. Interestingly, these highly-mutated tumors often express immune checkpoints such as programmed cell death 1 (PD-1) ligands, acting as inhibitory signals for the immune response.Citation2 In such tumors, immune checkpoint expression is induced by IFN-γ produced within the inflammatory microenvironment,Citation3 leading to the death of tumor-specific T-lymphocytes despite an initial immunogenic neo-antigen exposure. Several immunotherapeutic agents (e.g. anti-PD-1/PD-L1 antibodies) have been developed in order to ‘break’ this tolerance mechanism. These agents have shown high efficacy in malignancies with high tumor mutation burden (TMB), such as melanoma and subsets of patients with non-small cell lung carcinomas (NSCLC).Citation4–Citation9 High response rates have specifically been associated with tumor PD-1 ligand 1 (PD-L1) over-expression Citation4,Citation6,Citation7 and mismatch-repair deficiency;Citation6,Citation10 the latter virtually always presenting a high TMB. PD-L1 overexpression has been linked to specific mutagenic mechanisms, such as DNA polymerase δ or ε (POLD1/POLE) deficiency and apolipoprotein B mRNA-editing cytidine-deaminase (APOBEC) hyper-activity.Citation6,Citation11,Citation12 The APOBEC family is of particular interest in this context: these evolutionarily conserved enzymes act as protective factors against viral infections, by inducing mutation altering viral replication. However, APOBEC off-target genotoxic effects result in alterations of the host genome and thus, are also implicated in tumor hyper-mutation processes.Citation13
It is plausible that highly-mutated, immunogenic tumors require PD-L1 overexpression (or other alterations resulting in immune tolerance) in order to survive and be observed.Citation12 Our previous data have shown that APOBEC overexpression or APOBEC-related mutagenesis (also referred to as kataegis, a phenomenon of localized hyper-mutation primarily described in breast cancerCitation14 and later attributed to AID/APOBEC enzyme hyper-activityCitation15) are independently correlated with high PD-L1 expression. Further, if both APOBEC expression (or APOBEC-related mutagenesis) and TMB are included in the multivariate model, TMB is no longer an independent correlate of PD-L1 overexpression, suggesting that certain mutational processes, such as those related to APOBEC, are most relevant to trigger the PD-L1 immune shieldingCitation12.
One could hypothesize that precise mutational processes result in specific neo-antigen physicochemical properties. In this study, we aimed to describe the molecular consequences of APOBEC hyper-activity on peptides subsequently created, and found that APOBEC-related mutagenesis increases neo-peptide hydrophobicity. There is considerable literature suggesting that hydrophobicity is a feature of peptide antigenicity and immunogenicity.Citation16-Citation18 Accordingly, we showed that APOBEC-related mutagenesis associates with immune marker expression in human tumor samples and correlates with immunotherapy response in pan-cancer patients. The results presented herein suggest the use of APOBEC-related mutational signature as a biomarker of response to immunotherapy by checkpoint blockade in cancer patients.
Results
Hydrophobicity of the human coding genome increases after in silico apobec-related mutagenesis
All existing unique 6-nucleotide stretches (n = 4,096 – each of the positions within the 6-nucleotide stretches can be occupied by one of the four different natural nucleotides A, T, C, G and therefore, the number of 6-nucleotide stretches is equal to 46) were used as a template for in silico mutagenesis analysis. Virtual single-nucleotide substitutions corresponding to the description of AID/APOBEC mutagenesis pattern (i.e. the average of mutation signatures ‘2ʹ and ‘13ʹ, as previously described Citation19) was applied on this set of 4,096 virtual stretches. The 2nd, 3rd, 4th or 5th nucleotide of each stretch could be mutated, resulting in a total of 49,152 possible changes (4,096 stretches possibly mutated in four positions, by three different nucleotide substitutions). The sum of hydropathic indices corresponding to the dipeptides encoded by the virtual stretches was then weighted by the probability of observation of said-stretch in the genome (i.e. taking into account the nucleotide-content and codon-usage variability inherent to the coding genome) and by the probability to observe a mutation within the stretch (as described by ref.Citation19). Hydropathic indices were then compared before and after single-round of in silico mutagenesis.
Application of the in silico computational method resulted in a significant difference in hydrophobicity ranks when considering stretches presenting at least one APOBEC-related mutation pattern (at the nucleotide level) (N = 3,744; 91.4% of all existing stretches) or when considering all 4,096 possible stretches (sum of sign ranks W = 2.8x10⁶; p-value < 0.0001) (). The median hydrophobicity change per stretch was positive for both analyses (+2.9x10⁻⁸ and +1.0x10⁻⁷ arbitrary unit (AU)), and the sum of hydrophobicity changes for all stretches – corresponding to the hydrophobicity change caused by a single APOBEC-related mutation in the human coding genome – was equal to +0.0235 AU (). Reciprocal alterations were not included in this analysis because of a previously reported bias against mutations in the reciprocal strand.Citation19 However, the analysis considering reciprocals mutations (e.g. TCT→TTT and AGA→AAA) showed similar results, with a median hydrophobicity change per stretch of +1.8x10⁻⁷ AU and a hydrophobicity change of the coding genome of +0.0163 AU (Supplemental Table 1). Therefore, our in silico computation showed that APOBEC-related mutagenesis induces an imbalance in favor of hydrophobic dipeptides in the human coding genome.
Table 1. Consequences of a single iteration of APOBEC-related mutagenesis on the overall hydrophobicity of the human coding genome (per in silico computation)a
The in silico computation described above was also performed on 5-nucleotide stretches rather than 6-nucleotides stretches, simulating substitutions on the 2nd, 3rd, and 4th nucleotides. This computation led to similar conclusions (data not shown).
Repeated APOBEC-related mutagenesis amplifies the hydrophobicity change
We further evaluated the impact of repeated in silico APOBEC-related mutagenesis over the estimated overall hydrophobicity of the coding genome (the mutated stretches being used as a template for additional rounds of mutagenesis). The reference coding genome (baseline) tends to be hydrophilic, with a score of −0.3592 AU (calculated by summing the hydropathic indexes weighted by the probability of observation of all stretches). After 100 rounds of APOBEC-related mutagenesis, the overall hydrophobicity was estimated at −0.0937 AU, corresponding to a +73.9% increase from the baseline (). Interestingly, a noticeable increase in hydrophobicity was also seen after ultra-violet (UV) in silico mutagenesis (+160%), but not with other mutagenesis processes such as mismatch repair, BRCA1/2 and polymerase deficiencies or tobacco-smoked exposure (using mutation signatures previously described by ref. Citation19) ().
Figure 1. Amino-acid distribution and relative hydrophobicity of the human coding genome after 1 and 20 APOBEC-related iterations (by in silico computation), as compared as other causes of mutagenesis.
Panel A shows changes in human coding genome overall hydrophobicity after multiple iterations of APOBEC-related mutagenesis, as computed in silico (n = 1 to 100 iterations). All nucleotides stretches (mutated or not) were included, reciprocals were not considered. Results obtained by applying the same method to alternative mutation signatures are shown for comparison purposes.Panel B and C show changes in hydrophobicity distribution after a single (B) or multiple (C) APOBEC-related mutagenesis iteration of all 6-nucleotide stretches whether or not they would be expected to be mutated; reciprocals wre not included. The figure breaks down the changes by hydrophobicity categories. There is a loss of hydrophilic amino acids (left side of the mountain graphic) and a gain of hydrophobic amino acids (right side of the mountain graphic).Panel D and E show the percentage of change of each amino acid (D) and codon stop (E) after 1 and 20 iterations of APOBEC-related mutagenesis.Amino-acid code – alanine (Ala, A), arginine (Arg, R), asparagine (Asn, N), aspartic acid (Asp, D), cysteine (Cys, C), glutamic acid (Glu, E), glutamine (Gln, Q), glycine (Gly, G), histidine (His, H), isoleucine (Ile, I), leucine (Leu, L), lysine (Lys, K), methionine (Met, M), phenylalanine (Phe, F), proline (Pro, P), serine (Ser, S), threonine (Thr, T), tryptophan (Trp, W), tyrosine (Tyr, Y), valine (Val, V), stop codon (X, *).
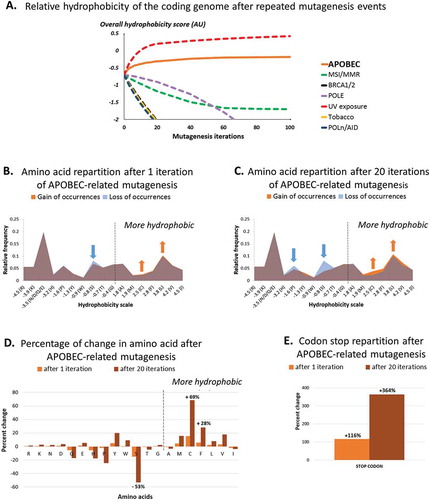
We then aimed to describe the modification in dipeptide amino-acid content after APOBEC-related mutagenesis. The application of our in silico computation revealed the apparition of specific hydrophobic residues, to the detriment of more hydrophilic residues, after both single and repeated APOBEC-related mutagenesis (-C). Particularly, an increase of +15/+69% (after one or 20 APOBEC-related mutagenesis iteration, respectively) was observed for cysteine residues (hydropathic index = +2.5 AU) and +6/+28% for phenylalanine (+2.8 AU), whereas serine (−0.8 AU) was the amino acid most commonly lost (−15/-53%) (). Additionally, we noticed an important increase in the number of stop-codons (+116/+364%) ().
Taken together, we demonstrated that the APOBEC-related mutagenesis process induces a significant modification of the coding genome template, possibly resulting in an increase of synthesis of hydrophobic residues by the mutagenic tumor cell.
APOBEC-related mutagenesis-positive tumors show an increase in peptide hydrophobicity
A subset of 469 highly-mutated tumor samples (top 30% tumors in term of mutation burden, exempt from mismatch repair or DNA polymerases deficiencies) was selected from The Cancer Genome Atlas (TCGA) database. These tumors presented an average of 335 mutations (95% confidence interval CI95% = 302–368 alterations) and 230 of them presented at least one APOBEC-related mutagenesis pattern. APOBEC-related mutagenesis-positive tumors carried an average of 84 APOBEC-related substitutions per tumor (CI95% = 67–101 substitutions).
An analysis considering full-length mutated transcripts was first performed: 93,465 different transcripts corresponding to 15,163 unique genes were reviewed. The difference in hydrophobicity evaluated for each transcript before and after mutagenesis was summed by tumor. Highly-mutated tumors presenting alterations possibly caused by APOBEC (as evaluated by P-MACD results) showed a significant increase in hydrophobicity change of their transcriptome/proteome in comparison to tumors not altered by APOBEC (+6,775 AU versus +2,759 AU; p-value < 0.0001) and this difference remained significant when the hydrophobicity change was weighted by the expression level of each transcript (+11x108 AU versus +3.5x10⁸ AU; p-value < 0.0001) (Supplemental Table 2). Similar results were found for tumors presenting an intermediate or low TMB (Supplemental Table 2).
Another analysis consisted in the generation of presentable 8- to 10-mer neo-peptides: 2,660,232 neo-peptides (all possible 8- to 10-mer peptides encompassing the mutations observed in the tumors of interest) were generated. shows a significant increase in overall hydrophobicity for tumors positive for APOBEC-related mutagenesis compared to those without APOBEC-related alterations (+8,702 AU versus +3,374 AU; p-value < 0.0001), The significant differences are maintained when the change in total hydrophobicity is weighted by neo-peptide expression level (+22.2x10⁸ AU versus +2.6x10⁸ AU; p-value < 0.0001), and this held true when examining the entire group of tumors, as well as for tumors in the lower 70% TMB ().
Table 2. Comparison of change in hydrophobicity of the neo-peptide library (8- to 10-mer peptides) of TCGA tumors (whole exome sequencing) with and without APOBEC-related mutagenesisa.
Tumor neo-peptide hydrophobicity correlates with the number of APOBEC-related mutations
For highly-mutated TCGA tumors presenting an APOBEC-related mutation signature (N = 230), the overall hydrophobicity change was significantly and positively correlated to the number of mutations specifically caused by APOBEC (R2 = 0.27; p-value < 0.0001). Of interest, this correlation revealed two distinct groups of tumors: a group composed of melanomas (N = 52; R2 = 0.90; p-value < 0.0001) and a group of tumors with diagnoses other than melanoma, that disclosed a lower regression slope than that of the melanoma group (N = 178; R2 = 0.70; p-value < 0.0001) (). These results mirrored those calculated by our in silico computation observed above (); the latter demonstrated that both UV-related (the hallmark of melanoma) and APOBEC-related mutagenesis processes specifically cause an increase in overall coding genome hydrophobicity.
Figure 2. Overall change in hydrophobicity in human tumors positive for APOBEC-related mutagenesis.
Panel A. Correlation between the overall neo-peptide hydrophobicity change and the total number of APOBEC-related mutations in highly-mutated human tumors positive for APOBEC-related mutagenesis.Panels B-E. Comparison of neo-peptide hydrophobicity change in highly mutated tumors with or without APOBEC-related mutagenesis, in different subgroups of tumors (non-melanoma (B, D) and melanoma tumors (C, E)), considering the hydrophobicity scores before (B, C) or after (D, E) weighting by the mRNA-expression levels. Mean and 95% confidence intervals are represented in bold bars.
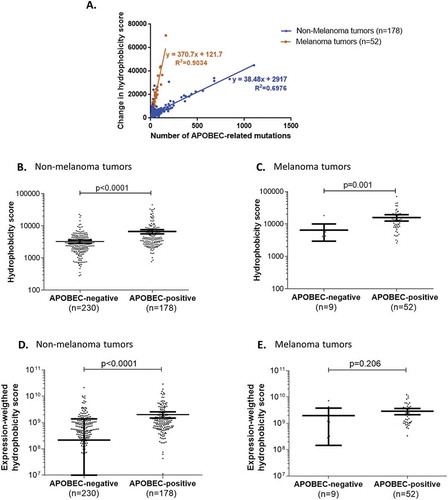
Further analysis showed that, in highly-mutated tumors, the change in hydrophobicity for 8- to 10-mer peptides (i.e. the sum of hydrophobicity of all 8- to 10-mer neo-peptides generated per tumor) was significantly higher in APOBEC-related-mutagenesis-positive versus APOBEC-related-mutagenesis-negative tumors, regardless of whether these tumors were diagnosed as non-melanoma or melanoma (p-value < 0.001) (-C). Similar results were seen for non-melanoma tumors when the hydrophobicity score was weighted by the corresponding expression level (p-value < 0.0001) (), but not for melanoma perhaps because of the small number of melanomas exempt of APOBEC-related mutagenesis (N = 9; p-value = 0.206) ().
The following analyses were performed in non-melanoma tumors exclusively, in order to avoid possible spurious associations due to the UV-related mutagenesis confounder factor.
APOBEC-related mutagenesis is associated with immune cell marker expression
The presence of an APOBEC-related mutagenesis pattern in non-melanoma malignancies was associated with the overexpression of PD-L1/2 ligands (odds ratio (OR) = 1.9; p-value = 0.006). The overexpression of IFNγ, a marker of lymphocyte activation, and the overexpression of T-cell specific markers, such as CD4 (associated with the presence of CD4+ helper T-cells) and CD8A (associated with the presence of CD8+ cytotoxic T-cells), were also significantly associated with the presence of APOBEC-related mutagenesis in the cohort of non-melanoma tumors (OR > 2.85; p-value < 0.0001) (Supplemental Table 3). We have previously shown that lymphocyte infiltration is independently associated with both TMB and APOBEC mutagenesis.Citation12
APOBEC-related mutagenesis is associated with immunotherapy response in cancer patients
We analyzed a cohort of 99 non-melanoma patients previously treated by immunotherapy at the UCSD Moores Cancer Center, Center for Personalized Cancer Therapy. Mutation assessment was performed by next-generation sequencing using a 315-gene panel (FoundationOne® assay, Foundation Medicine Inc.).
First, we evaluated if results from panel-based assays could be used as a surrogate for whole-exome APOBEC-related mutational signature enrichment (AMSE) score. Using the TCGA pan-cancer cohort, the correlation between the results obtained by using all exome regions versus these obtained using only the regions covered by the commercial panel was estimated at R2 = 0.7225 and was considered significant (p-value < 0.0001) (Supplemental Figure 1).
The threshold segregating patients between levels of APOBEC-related mutagenesis was determined using the Receiver Operating Curve (ROC) method. An AMSE score threshold of 0.727 permitted discrimination between patients with or without response to immunotherapy with a sensitivity of 95% (18/19 patients that responded to immunotherapy had high AMSE score) and a specificity of 35% (28/80 patients who did not respond to immunotherapy had low AMSE score). Using this threshold, AMSE score has a negative predictive value of 97% and a positive predictive value of 26%.
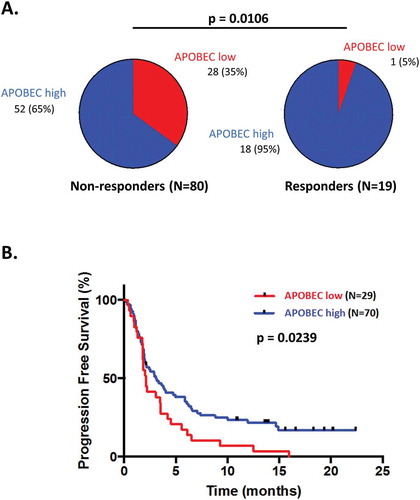
In the cohort of 99 patients having received immunotherapy, demographic and molecular features significantly associated with a high AMSE score were the gender (men are more likely to present an ‘APOBEC-high’ phenotype; p-value = 0.0032) and the presence of an intermediate or high TMB (p-value = 0.0187 and 0.0060, respectively). Patients with a high AMSE score were more likely to have a complete (CR) or partial (PR) response (OR = 9.69; p-value = 0.0106) and presented a median PFS of 3.1 months, while those with low AMSE score had a median PFS of 2.1 months (Hazard Ratio (HR) = 0.60; p-value = 0.0239) (Supplemental Table 4 and ).
Figure 3. Response and progression-free survival comparison between patients treated with checkpoint blockade presenting differential APOBEC-related mutagenesis phenotypes.
An estimate of the APOBEC-related mutagenesis was obtained for each patient using the AMSE tool. Patients were classified in low APOBEC-related mutagenesis phenotype for scores ≤ 0.727 and in high APOBEC-related mutagenesis phenotype for scores > 0.727. Panels A: Pie-charts of response in patients presenting a low versus high APOBEC-related mutagenesis score. Panel B: Kaplan-Meier curve for progression-free survival of patients with APOBEC-related mutagenesis score low versus high.Abbreviations: CI = confidence interval; HR = hazard ratio; OR = odds ratio.
In univariate analysis, the factors positively associated with a response to immunotherapy were high TMB and high APOBEC/AMSE score (p-value = 0.0027 and 0.0106, respectively), whereas a low TMB was negatively associated with the response (p-value = 0.0006). In multivariate analysis, the only factor remaining independently and positively associated with the outcome was the APOBEC/AMSE score (OR = 10.99; p-value = 0.031) (, Supplemental Table 5 and Supplemental Table 6).
Table 3. Factors affecting the outcome of patients treated with immunotherapy agents.
In addition, we also generated exploratory empirical probabilistic models combining TMB and APOBEC/AMSE score to predict clinical response to immunotherapy. These models allow us to estimate the complementarity of TMB (an established biomarker of response to immunotherapyCitation20,Citation21) and APOBEC-related mutagenesis process, assuming that these criteria are either 1/independent or 2/dependent and partially sharing common information, without discretization, thresholding or other simplifying assumptions. As can be seen in the ROC curves presented in Supplemental Figure 2A-B, the model with the highest area under the curve (AUC) corresponds to the one that combines TMB and APOBEC/AMSE score (AUC = 0.892 and AUC = 0.862 with or without common polymorphisms filtering, respectively). This model shows significant model-fit (p-value < 0.0001). When TMB and APOBEC/AMSE score are considered together, the optimized sensitivity and specificity are about 90% and 65% (Supplemental Figure 2A-B). To note, further predictive power would have to be evaluated using an independent set.
Discussion
Immunotherapy uses the innate immune system’s ability to detect and fight abnormal cells (such as ‘non-self’, infected, or tumor cells) in order to treat cancer. Recent successes of exceptional responses to PD-1/PD-L1 blockade in melanoma, NSCLC, and Hodgkin lymphoma, have led to an exponential interest in this matter.Citation5,Citation22,Citation23 Interestingly, while immunotherapy may lead to complete responses in certain types of cancer, other tumors seem resistant to checkpoint blockade agents, with overall response of 19% in unselected populations.Citation7 The causes for such dichotomous results are still unclear, and biomarkers allowing an early stratification of patients susceptible to benefit from such agents are needed.Citation24 It appears that microsatellite instability (MSI)-high tumors present high response rates to pembrolizumab, explaining its recent approval by the Food and Drug Administration (FDA) regardless of tumor type.Citation10,Citation25,Citation26 Patients whose tumor exhibits PD-L1 expression by immunohistochemistry.Citation4–Citation6 or PD-L1 amplification by sequencing Citation27 achieve higher response rates to blockade than patients without these features. However, some patients who do not express PD-L1 can still have impressive responses to PD-1 blockade. Lastly, virally-induced tumors such as Merkel cell carcinoma also responds well to checkpoint blockade.Citation28
PD-L1 overexpression itself has been linked to high TMB, polymerases δ (POLD1) and ε (POLE) alterations and, more recently, to APOBEC cytidine-deaminases hyper-activity.Citation6,Citation11,Citation12 It is plausible that highly mutated or immunogenic tumors require PD-L1 overexpression (or other alterations that result in immune tolerance) in order to survive.Citation12 Interestingly, our previous data Citation12 have shown that, in multivariate analysis, APOBEC overexpression or APOBEC-related mutagenesis pattern are independently correlated with high PD-1 ligand expression. Further, if both APOBEC–related signature and TMB are included in the multivariate analysis, TMB is no longer selected as an independent correlate of PD-1 ligand overexpression, suggesting that only certain hyper-mutated subtypes elicit the immune shielding that PD-L1 or PD-L2 provides.
In this study, we found that the mutational signatures specifically caused by APOBEC enzymes (often in response to virus infection) Citation29 significantly increase the overall hydrophobicity of the human coding genome, as shown by in silico computation and by examining pan-cancer TCGA sequencing data. The increased APOBEC-associated hydrophobicity was seen regardless of the TMB. Importantly, the overall change in hydrophobicity of putative neo-antigens presented was proportionally correlated to the number of APOBEC-related mutations, as assessed by both computation method or observed from TCGA data. This escalation in hydrophobicity indices is relevant because T-cells preferentially recognize antigens containing hydrophobic residues.Citation17 It is also known that the binding affinity of 8- to 10-mer peptides to MHC class I proteins (which present antigens to T-cells) is largely determined by the anchor amino acids allowing the interaction with the MHC hypervariable region,Citation16 and these anchor residues also tend to be hydrophobic.Citation16 Therefore, it appears that peptide hydrophobicity is a mandated physicochemical feature eliciting both antigenicity and immunogenicity Citation18 and we hypothesized that, by modifying the peptide physicochemical feature, APOBEC hyper-activity may, at least indirectly, play a role in the tumor immune response. Indeed, a recent study reports a positive correlation between APOBEC3B upregulation, i.e. enrichment in the APOBEC mutation signature, and known immunotherapy response biomarkers such as PD-L1 expression and T-cell infiltrates in non-small cell lung carcinoma.Citation30 Interestingly, UV-related mutation signature also seems to promote an increase in hydrophobic 8- to 10-mer peptides, as assessed by both methods, and this may be consistent with the high response rates to checkpoint blockade observed in melanoma patients.Citation31 The implication of APOBEC hyper-activity in the tumor immune response may also be suspected, because in the TCGA pan-cancer cohort, the presence of APOBEC-related mutagenesis was significantly associated with the expression of IFNγ and T-cell specific markers CD4 and CD8A. These cytokine and lymphocyte markers are known to be associated with lymphocyte activation and response to checkpoint blockade.Citation32 It is important to note that other well-known mutagenic processes, such as mismatch repair, BRCA1/2 or polymerase deficiency mutation patterns, however, do not seem to increase the neo-peptide hydrophobicity.
Importantly, this analysis indicates that APOBEC signature is correlated with higher rates of objective response to immunotherapy and longer PFS in patients treated with PD-1/PD-L1 checkpoint blockade. The correlation between APOBEC-related mutagenesis and immunotherapy response was independent of high TMB in multivariate analysis. Of interest, of the 19 patients presenting an objective response to immunotherapy, 18 had a high APOBEC estimate. The sensitivity of APOBEC-related signature for response was therefore 95%; the negative predictive value was 97%. Even so, the specificity was low (35%) since there were patients that did not respond that had high APOBEC-associated signature. Indeed, the combination of APOBEC-related mutagenesis and TMB was a more effective predictor of outcome (by model fit) than either alone. The optimized sensitivity and specificity for the combination of APOBEC-related signature and TMB was 90% and 65%. Therefore, it seems possible to postulate that the non-responders who have high TMB/APOBEC may have additional biomarkers that correlate with outcome. Studies are ongoing in an expanded cohort of patients to determine if lack of PD-L1 expression would identify the TMB/APOBEC high tumors that do not respond to immunotherapy with PD-1/PD-L1 checkpoint blockade. Such a scenario could occur, even in the presence of highly immunogenic APOBEC-related mutagenesis bearing tumors, if other checkpoints were operative.
There might also be other potential complexities associated with PD-1/PD-L1 response that depend on specific functional characteristics of distinct cellular states and may not be easily captured in a single mutation signature index. For instance, the molecular differences inherent to each tumor type may lead to conflicting conclusions. In breast cancer, Smid et al. 2016 Citation33 showed that expression of immunotherapy predictive biomarkers is linked to an increase in amino acid charge but not in amino acid hydrophobicity when the tumor is impacted by the APOBEC-related mutation signature. Our observations may be different because they are based on analysis of a pan-cancer group including 30 distinct tumor types, as well as using a different type of metric. Smid et al. 2016Citation33 refers to hydrophobic amino acid content increase (in percent), while we calculated the overall hydrophobicity increase across the entire coding genome (using the Kyte-Doolittle scale for hydrophobicityCitation34). Finally, other factors may be operative that could moderate immunogenicity. For instance, binding of specific peptides to MHC I molecules influences presentation and immune responseCitation35,Citation36 and warrants investigation in the context of APOBEC signatures.
In conclusion, both in silico computation and curation of human cancer samples indicates that APOBEC-related mutagenesis results in hydrophobic neo-peptides, with hydrophobicity being a known feature that increases immunogenicity. In patients treated with immunotherapy, APOBEC-related signature was predictive of response and PFS and, in multivariate analysis, the correlation with response was independent of high TMB. The combination of TMB and APOBEC-related signature had higher predictive value for the outcome than either alone. At the operating point with 90% sensitivity, the combined model had a specificity of 65%. Additionally, this study highlights the possibility of using panel-based DNA-sequencing results (commonly used in clinical practice) rather than whole-genome sequencing methods, in order to estimate the impact of APOBEC-related signature on patient’s tumors. The use of APOBEC-related mutagenesis estimates may represent a new biomarker of response to immunotherapy that could be used alone or in combination with already described criteria, in order to improve the selection of patients that would benefit from such agents and, therefore, merits further investigations.
Methods
In silico modeling of APOBEC-related mutagenesis
We recreated all possible 6-nucleotide stretches and, on these stretches, we applied the APOBEC-related mutational signatures (as an average of signatures 2 and 13 previously described by ref.Citation19, Supplemental Figure 3). The use of 6-nucleotide stretches was chosen in order to take into consideration the three distinct reading frames of the template for further translation. If we had considered only 3-nucleotide stretches, we would not have been able to determine the effects of mutations at the 1st and 3rd positions, since APOBEC requires a leading and trailing nucleotide when creating a mutation. The use of 6-nucleotide stretches also facilitated the calculation of the amino-acid product hydrophobicity, as those were encoding clearly-defined dipeptides. Using the Kyte-Doolittle hydropathy scale Citation34, we calculated the hydrophobicity corresponding to the amino-acid products of all existing 4,096 stretches, before and after in silico mutagenesis (either with or without the reciprocal strand). The hydrophobicity of the products before and after mutagenesis were compared after adjusting for the probability of observing that 6-nucleotide stretch in the human coding genome (derived from the Kazusa’s codon usage databaseCitation37) and the probability of mutagenesis occurring at that site Citation19. An example of calculation is given in Supplementary Methods.
The method above, corresponding to the generation of a single APOBEC-related alteration, was repeated 100-times, in order to simulate the accumulation of alterations observed in human tumors (estimated at 84 APOBEC-related substitution per sample, see below).
Analysis of APOBEC-related mutational signature in TCGA pan-cancer tumor samples
Data retrieval
Mutation description and mRNA expression profiles of human tumors were downloaded from the TCGA project, using the Broad GDAC Firehose website (https://gdac.broadinstitute.org – standardized data run 2016_01_28). All samples were available without restriction of use on April 2018. Data used in this study respected the TCGA Human Subjects Protection and Data Access Policies (https://cancergenome.nih.gov/abouttcga/policies/tcga-human-subjects-data-policies).
APOBEC-related mutational signature enrichment estimation for TCGA samples
The analysis of APOBEC-related mutations was performed using the P-MACD (Pattern of Mutagenesis by APOBEC Cytidine Deaminases) tool.Citation13 The results were given as number of mutations probably due to APOBEC. Tumors were classified as APOBEC-mutagenesis positive if presenting at least one alteration caused by APOBEC, and negative if not presenting any alteration caused by APOBEC.
Hydrophobicity analysis
From 9,166 samples in the TCGA database (33 distinct tumor types), we selected a subset of highly mutated tumors (the top 30% in mutational burden) and eliminated tumors with POLE, POLD1, mismatch repair (MMR) genes or microsatellite instability high (MSI-high) alterations (N = 469 samples were left for study) (description of the study cohort is presented in Supplemental Table 7). Using the mutation description available for these tumors, we then considered, for each sample, two variables: (i) the difference in total hydrophobicity (after versus before mutagenesis) of all existing full-length transcripts; and (ii) the difference in total hydrophobicity (after versus before mutagenesis) of all possible 8-mer to 10-mer neo-peptides encompassing a mutation (since MHC-I presents 8 to 10 amino acid peptides). The calculations of both (i) and (ii) above were computed in two ways – either not weighted by mRNA expression levels or weighted by these levels (in order to take into consideration whether the neo-peptides were actually expressed). All mutations, regardless of their origin, where considered in the hydrophobicity analysis of full-length transcripts and 8-mer to 10-mer neo-peptides. The tumors harboring at least one APOBEC-related mutation (as described by the P-MACD method) were compared to those without.
Immune marker analysis
Expression levels of immune markers in tumors presenting an APOBEC-related signature were compared to those not harboring an APOBEC-related signature. The mRNA expression signal (RNAseqV2, level 3) were integrated and normalized for each gene, per sample, using the protocol RSEM (RNA-Sequencing by Expectation Maximization). The standard score (z-score) for each transcript was calculated using the mean and distribution values found in all samples of same tumor type that are diploid for the said gene. A z-score ≥ 2 standard deviations was used as threshold for overexpression. For each tumor, immune markers considered were as follows: presence of a lymphocyte or monocyte infiltrate determined by immunohistochemistry, CD3G (T-cell specific marker), CD8A, CD4, MS4A1 (B-cell marker), CD14 (monocyte marker), CD33 (macrophage marker), IL3RA (dendritic cell marker), NCAM1 (Natural Killer cell marker), IFNG (interferon gamma), PD-L1 and PD-L2 mRNA expression. The analysis was performed using the complete set of non-melanoma, non-MSI/MMR/POLE/POLD1 altered tumors from TCGA (N = 3,300 samples).
Analysis of APOBEC-related mutagenesis signature and tumor neo-peptide features in patients receiving PD-1/PD-L1 blockade agents
Patient selection
We reviewed the charts of 1,638 cancer patients who had undergone next-generation sequencing (NGS) (Foundation Medicine, Cambridge, MA) at UC San Diego Moores Cancer Center (eligible patients starting in October 2012). Only patients with non-melanoma malignancies and having received at least one line of immunotherapy were considered (N = 99). For each case, responses to therapy were assessed based on physician notation, using the RECIST (Response Evaluation Criteria in Solid Tumors) criteria. This study was performed and consents were obtained in accordance with UCSD Institutional Review Board guidelines (NCT02478931).
Next-generation sequencing and assessment of tumor mutational burden (TMB)
Formalin-fixed paraffin-embedded (FFPE) tumor samples were submitted for NGS to Foundation Medicine (clinical laboratory improvement amendments (CLIA)-certified lab). The FoundationOne® assay was used (hybrid-capture-based 315 gene-panel exome NGS – http://www.foundationone.com/). The methods have been previously described in.Citation38 Average sequencing depth of coverage was greater than 250X, with more than 100X for more than 99% of the exons covered. For TMB, the number of somatic mutations detected on NGS (interrogating 1.2 mega-bases of the genome) was quantified and that value was extrapolated to the whole exome using a validated algorithm.Citation25,Citation39 Alterations likely to be bona fide oncogenic drivers and germline polymorphisms were excluded. TMB was measured in mutations per mega-base (Mb). TMB levels were divided into three groups: low (1–5 mutations/Mb), intermediate (6–19 mutations/Mb), and high (≥ 20 mutations/Mb).Citation40
APOBEC-related mutational signature enrichment estimation for patient samples
Results from the FoundationOne® assay were used to first generate variants and then compute an APOBEC mutational signature estimate (AMSE, available at https://github.com/KwatME/mutational_signature) for each of the 99 patient samples. Binary Sequence Alignment/Map format (.BAM) files were processed using the variant detection FreeBayes algorithm to generate Variant Call Format (.VCF) files. Low quality variants (QUAL score of less than 50 or read depth of less than 100X) were removed. We then defined single-strand DNA-specific APOBEC cytidine deaminase(s) signatures as designated in Citation13 and Citation19.
Details of calculations are given in Supplementary Methods.
Validation of APOBEC mutational signature enrichment (AMSE) method on panel-based sequencing method
To assess if the genomic regions represented in a gene-panel assay were suitable to estimate the AMSE score of the whole exome, we compared the computation obtained for TCGA samples using the full exome regions versus those obtained using the FoundationOne® panel-limited assay. The results (Supplemental Figure 1) show that for samples with mutations encompassing the same range as those in our 99 patients (remaining after filtering based on the FoundationOne sequencing region), the correlation (R2) of the AMSE score considering the full exome versus the limited panel regions is 0.7225 (p-value < 0.0001).
Clinical outcome analysis of patients receiving PD-1/PD-L1 blockade agents
Patients were divided in two groups of interest: (i) patients presenting a tumor with a high load of APOBEC-related mutations (‘APOBEC high’); and (ii) patients presenting a tumor with a low load of APOBEC-related mutations (‘APOBEC low’). The optimal threshold for APOBEC estimate was selected using the Receiver-Operating Characteristic (ROC) curve method, evaluating the performance of the APOBEC score to discriminate patient outcomes. Patients were also grouped by best response: patients having presented a complete or partial response (CR/PR) were considered of favorable outcome, whereas patients having presented a stable or progressive disease (SD/PD) were considered of poor outcome. Best response, progression-free survival (PFS) in months, TMB and patient demographics were compared between ‘APOBEC high’ versus ‘APOBEC low’ patients. We also developed an exploratory probabilistic model combining TMB and APOBEC to predict clinical response to immunotherapy without discretization or other simplifying assumptions. We modeled the conditional probability p(R|T,A) of response (R), defined as complete response or partial response (R = 1), or stable disease or progressive disease (R = 0), as a function of the values of TMB (T) and AMSE score (A).Citation41
Statistical analysis
All statistical and bioinformatics analyses were conducted by AB and PT using SAS® University Edition software (http://support.sas.com/software/products/university-edition/) and GraphPad Prism® version 6.01 (http://www.graphpad.com/scientific-software/prism/). For all analysis, two-tailed tests were used and p-value ≤ 0.05 was considered significant.
Statistical significance for the in silico modeling results were assessed using a Wilcoxon signed-rank test (non-parametric paired test) for the comparison of change in total hydrophobicity before and after APOBEC-related mutagenesis in 6-nucleotide stretches. Change in total hydrophobicity were also calculated in TCGA cohort samples and those with and without APOBEC-related mutagenesis were compared; these calculations were performed for the products of full-length transcripts as well as for 8- to 10-mer peptides; the Mann–Whitney U-test (non-parametric unpaired test) was used. Comparisons of lymphocyte marker expression (defined as number of tumors presenting a marker over-expression versus number of tumors not presenting a marker over-expression) between groups of interest were assessed using a Fisher’s exact test. For the clinical study, the Fisher’s exact test was used to assess for the univariate association between categorical variables and the response to therapy, defined as CR/PR and SD/PD. A logistic regression based on all factors presenting a two-tailed p-value ≤ 0.05 in the univariate analysis was later run to assess for the set of predictors independently associated with the response (multivariate analysis). The association with PFS, calculated using the Kaplan-Meier method, was assessed using the Mantel-Cox log-rank test. For patients who received multiple immunotherapy regimens, the treatment with the longest PFS was chosen for analysis. Patients were considered not evaluable for inclusion in the survival analysis if they were lost to follow-up before their first restaging. Patients were censored if they had not progressed or died at date of last follow-up. The exploratory probabilistic modeling the joint probability of TMB, APOBEC and a binary variable representing the outcome was fitted using kernel-density estimation.
Author contributions
A.B. and T.P. performed most of the experiments and data analysis; H.Y., A.G. and P.T. performed validation analysis; G.F. provided sequencing, mutation burden and microsatellite status data for the validation analysis; A.B and R.K. designed the study, performed in-depth review of all analyses, wrote and revised the manuscript; S.L. and R.K. edited the manuscript.
Personal financial interests
T.P. and I.T. are employees and shareholder at CureMatch Inc. G.F. is employee and shareholder at Foundation Medicine Inc. R.K. receives consultant fees from X-biotech, Loxo and Actuate Therapeutics, as well as research funds from Incyte, Genentech, Pfizer, Sequenom, Guardant, Foundation Medicine and Merck Serono, speaker fees from Roche, and has an ownership interest in CureMatch Inc.
Supplemental Material
Download MS Word (47.6 KB)Supplemental Material
Download MS Word (314.4 KB)Supplemental material
Supplemental data for this article can be accessed here.
Additional information
Funding
Related Research Data
References
- Guermonprez P, Valladeau J, Zitvogel L, Théry C, Amigorena S. Antigen presentation and T cell stimulation by dendritic cells. Annu Rev Immunol. 2002;20:621–667. doi:10.1146/annurev.immunol.20.100301.064828.
- Ni L, Dong C. New B7 family checkpoints in human cancers. Mol Cancer Ther. 2017;16(7):1203–1211. doi:10.1158/1535-7163.MCT-16-0761.
- Miller RA, Miller TN, Cagle PT. PD-1/PD-L1, only a piece of the puzzle. Arch Pathol Lab Med. 2016 Jul 11. doi:10.5858/arpa.2016-0252-ED.
- Patel SP, Kurzrock R. PD-L1 expression as a predictive biomarker in cancer immunotherapy. Mol Cancer Ther. 2015;14(4):847–856. doi:10.1158/1535-7163.MCT-14-0983.
- Goodman A, Patel SP, Kurzrock R. PD-1-PD-L1 immune-checkpoint blockade in B-cell lymphomas. Nature reviews. Clin Oncol. 2016 Nov 2. doi:10.1038/nrclinonc.2016.168.
- Khagi Y, Kurzrock R, Patel SP. Next generation predictive biomarkers for immune checkpoint inhibition. Cancer Metastasis Rev. 2016 Nov 21. doi:10.1007/s10555-016-9652-y.
- Goodman AM, Kato S, Bazhenova L, Patel SP, Frampton GM, Miller V, Stephens PJ, Daniels GA, Kurzrock R. Tumor mutational burden as an independent predictor of response to immunotherapy in diverse cancers. Mol Cancer Ther. 2017 Aug 23. doi:10.1158/1535-7163.MCT-17-0386.
- Robert C, Schachter J, Long GV, Arance A, Grob JJ, Mortier L, Daud A, Carlino MS, McNeil C, Lotem M, et al. Pembrolizumab versus Ipilimumab in Advanced Melanoma. N Engl J Med. 2015;372(26):2521–2532. doi:10.1056/NEJMoa1503093.
- Brahmer J, Reckamp KL, Baas P, Crinò L, Eberhardt WEE, Poddubskaya E, Antonia S, Pluzanski A, Vokes EE, Holgado E, et al. Nivolumab versus Docetaxel in advanced squamous-cell non-small-cell lung cancer. N Engl J Med. 2015;373(2):123–135. doi:10.1056/NEJMoa1504627.
- Le DT, Uram JN, Wang H, Bartlett BR, Kemberling H, Eyring AD, Skora AD, Luber BS, Azad NS, Laheru D, et al. PD-1 blockade in tumors with mismatch-repair deficiency. N Engl J Med. 2015;372(26):2509–2520. doi:10.1056/NEJMoa1500596.
- Howitt BE, Shukla SA, Sholl LM, Ritterhouse LL, Watkins JC, Rodig S, Stover E, Strickland KC, D’Andrea AD, Wu CJ, et al. Association of polymerase e-mutated and microsatellite-instable endometrial cancers with neoantigen load, number of tumor-infiltrating lymphocytes, and expression of PD-1 and PD-L1. JAMA Oncol. 2015;1(9):1319–1323. doi:10.1001/jamaoncol.2015.2151.
- Boichard A, Tsigelny IF, Kurzrock R. High expression of PD-1 ligands is associated with kataegis mutational signature and APOBEC3 Alterations. Oncoimmunology. 2017;(ja). doi:10.1080/2162402X.2017.1284719.
- Roberts SA, Lawrence MS, Klimczak LJ, Grimm SA, Fargo D, Stojanov P, Kiezun A, Kryukov GV, Carter SL, Saksena G, et al. An APOBEC cytidine deaminase mutagenesis pattern is widespread in human cancers. Nat Genet. 2013;45(9):970–976. doi:10.1038/ng.2702.
- Nik-Zainal S, Alexandrov LB, Wedge DC, Van Loo P, Greenman CD, Raine K, Jones D, Hinton J, Marshall J, Stebbings LA, et al. Mutational processes molding the genomes of 21 breast cancers. Cell. 2012;149(5):979–993. doi:10.1016/j.cell.2012.04.024.
- Lada AG, Dhar A, Boissy RJ, Hirano M, Rubel AA, Rogozin IB, Pavlov YI. AID/APOBEC cytosine deaminase induces genome-wide kataegis. Biol Direct. 2012;7(47):discussion 47. doi:10.1186/1745-6150-7-47.
- Germain RN. MHC-dependent antigen processing and peptide presentation: providing ligands for T lymphocyte activation. Cell. 1994;76(2):287–299.
- Chowell D, Krishna S, Becker PD, Cocita C, Shu J, Tan X, Greenberg PD, Klavinskis LS, Blattman JN, Anderson KS. TCR contact residue hydrophobicity is a hallmark of immunogenic CD8+ T cell epitopes. Proc Natl Acad Sci U.S.A. 2015;112(14):E1754–1762. doi:10.1073/pnas.1500973112.
- Huang L, Kuhls MC, Eisenlohr LC. Hydrophobicity as a driver of MHC class I antigen processing. Embo J. 2011;30(8):1634–1644. doi:10.1038/emboj.2011.62.
- Alexandrov LB, Nik-Zainal S, Wedge DC, Aparicio SAJR, Behjati S, Biankin AV, Bignell GR, Bolli N, Borg A, Børresen-Dale A-L, et al. Signatures of mutational processes in human cancer. Nature. 2013;500(7463):415–421. doi:10.1038/nature12477.
- Bonta I, Isac JF, Meiri E, Bonta D, Rich P. Correlation between tumor mutation burden and response to immunotherapy. J Clin Oncol. 2017;35(15_suppl):e14579–e14579. doi:10.1200/JCO.2017.35.15_suppl.e14579.
- Steuer CE, Ramalingam SS. Tumor mutation burden: leading immunotherapy to the era of precision medicine? J Clin Oncol. 2018;36(7):631–632. doi:10.1200/JCO.2017.76.8770.
- Postow MA, Callahan MK, Wolchok JD. Immune Checkpoint Blockade in Cancer Therapy. J Clin Oncol. 2015;33(17):1974–1982. doi:10.1200/JCO.2014.59.4358.
- Brahmer JR, Tykodi SS, Chow LQM, Hwu W-J, Topalian SL, Hwu P, Drake CG, Camacho LH, Kauh J, Odunsi K, et al. Safety and activity of anti-PD-L1 antibody in patients with advanced cancer. N Engl J Med, 2012;366(26):2455–2465. doi:10.1056/NEJMoa1200694.
- Spencer KR, Wang J, Silk AW, Ganesan S, Kaufman HL, Mehnert JM. Biomarkers for immunotherapy: current developments and challenges. Am Soc Clin Oncol Educ Book. 2016;35:e493–503. doi:10.14694/EDBK_160766.
- Johnson DB, Frampton GM, Rioth MJ, Yusko E, Xu Y, Guo X, Ennis RC, Fabrizio D, Chalmers ZR, Greenbowe J, et al. Targeted next generation sequencing identifies markers of response to PD-1 Blockade. Cancer Immunol Res. 2016;4(11):959–967. doi:10.1158/2326-6066.CIR-16-0143.
- Poh A. First tissue-agnostic drug approval issued. Cancer Discov. 2017;7(7):656. doi:10.1158/2159-8290.CD-NB2017-078.
- Green MR, Monti S, Rodig SJ, Juszczynski P, Currie T, O’Donnell E, Chapuy B, Takeyama K, Neuberg D, Golub TR, et al. Integrative analysis reveals selective 9p24.1 amplification, increased PD-1 ligand expression, and further induction via JAK2 in nodular sclerosing Hodgkin lymphoma and primary mediastinal large B-cell lymphoma. Blood. 2010;116(17):3268–3277. doi:10.1182/blood-2010-05-282780.
- Kaufman HL, Russell J, Hamid O, Bhatia S, Terheyden P, D’Angelo SP, Shih KC, Lebbé C, Linette GP, Milella M, et al. Avelumab in patients with chemotherapy-refractory metastatic Merkel cell carcinoma: a multicentre, single-group, open-label, phase 2 trial. Lancet Oncol. 2016;17(10):1374–1385. doi:10.1016/S1470-2045(16)30364-3.
- Rebhandl S, Huemer M, Greil R, Geisberger R. AID/APOBEC deaminases and cancer. Oncoscience. 2015;2(4):320–333. doi:10.18632/oncoscience.
- Wang S, Jia M, He Z, Liu X-S. APOBEC3B and APOBEC mutational signature as potential predictive markers for immunotherapy response in non-small cell lung cancer. Oncogene. 2018;37(29):3924–3936. doi:10.1038/s41388-018-0245-9.
- Daud AI, Wolchok JD, Robert C, Hwu W-J, Weber JS, Ribas A, Hodi FS, Joshua AM, Kefford R, Hersey P, et al. Programmed death-ligand 1 expression and response to the anti–programmed death 1 antibody pembrolizumab in Melanoma. J Clin Oncol. 2016;34(34):4102–4109. doi:10.1200/JCO.2016.67.2477.
- Jamieson NB, Maker AV. Gene expression profiling to predict responsiveness to immunotherapy. Cancer Gene Ther. 2017;24(3):134–140. doi:10.1038/cgt.2016.63.
- Smid M, Rodríguez-González FG, Sieuwerts AM, Salgado R, Prager-Van der Smissen WJC, Vlugt-Daane M, van Der, van Galen A, Nik-Zainal S, Staaf J, Brinkman AB, et al. Breast cancer genome and transcriptome integration implicates specific mutational signatures with immune cell infiltration. Nat Commun. 2016;7:12910. doi:10.1038/ncomms12910.
- Kyte J, Doolittle RF. A simple method for displaying the hydropathic character of a protein. J Mol Biol. 1982;157(1):105–132. doi:10.1016/0022-2836(82)90515-0.
- Marty R, Kaabinejadian S, Rossell D, Slifker MJ, van de Haar J, Engin HB, de Prisco N, Ideker T, Hildebrand WH, Font-Burgada J, et al. MHC-I genotype restricts the oncogenic mutational landscape. Cell. 2017;171(6):1272–1283.e15. doi:10.1016/j.cell.2017.09.050.
- Łuksza M, Riaz N, Makarov V, Balachandran VP, Hellmann MD, Solovyov A, Rizvi NA, Merghoub T, Levine AJ, Chan TA, et al. A neoantigen fitness model predicts tumour response to checkpoint blockade immunotherapy. Nature, 2017;551(7681):517–520. doi:10.1038/nature24473.
- Nakamura Y, Gojobori T, Ikemura T. Codon usage tabulated from international DNA sequence databases: status for the year 2000. Nucleic Acids Res. 2000;28(1):292. doi:10.1093/nar/28.1.292.
- Frampton GM, Fichtenholtz A, Otto GA, Wang K, Downing SR, He J, Schnall-Levin M, White J, Sanford EM, An P, et al. Development and validation of a clinical cancer genomic profiling test based on massively parallel DNA sequencing. Nat Biotechnol, 2013;31(11):1023–1031. doi:10.1038/nbt.2696.
- Rosenberg JE, Hoffman-Censits J, Powles T, van der Heijden MS, Balar AV, Necchi A, Dawson N, O’Donnell PH, Balmanoukian A, Loriot Y, et al. Atezolizumab in patients with locally advanced and metastatic urothelial carcinoma who have progressed following treatment with platinum-based chemotherapy: a single-arm, multicentre, phase 2 trial. Lancet. 2016;387(10031):1909–1920. doi:10.1016/S0140-6736(16)00561-4.
- Chalmers ZR, Connelly CF, Fabrizio D, Gay L, Ali SM, Ennis R, Schrock A, Campbell B, Shlien A, Chmielecki J, et al. Analysis of 100,000 human cancer genomes reveals the landscape of tumor mutational burden. Genome Med. 2017;9(1):34. doi:10.1186/s13073-017-0424-2.
- Billingsley P. Probability and Measure. 3rd edn. New York: John Wiley and sons; 1995.