
 ?Mathematical formulae have been encoded as MathML and are displayed in this HTML version using MathJax in order to improve their display. Uncheck the box to turn MathJax off. This feature requires Javascript. Click on a formula to zoom.
ABSTRACT
Few studies were conducted investigating the immunological profiles in gastrointestinal stromal tumors (GIST). Adaptive and innate immune cells are present in the tumor microenvironment, indicating GIST as inflamed tumors. In addition, murine models suggested a potential interaction between immune components and imatinib. In this retrospective study, the GIST immunological profile was investigated through in silico analysis and immunohistochemistry (IHC), exploring the basis for immunotherapy approaches. Gene expression profiles (GEP) from 31 KIT/PDGFRA-mutant GIST were analyzed to evaluate the tumor microenvironment and immunotherapy predictive signatures such as the expanded IFN-γ-induced immune signature (EIIS) and the T-cell-inflamed signature (TIS). GEP and IHC supported the presence of immune infiltrate in GIST, with dominance of CD4+ and CD8+ T cells and M2 macrophages showing a remarkable similarity with melanoma microenvironment. The EIIS genes were expressed in most of GIST samples and positively correlated with PD-L1 abundance (p < .0001). Co-expression was also found between PD-L1 and CD8A (p < .0001) or CD8B (p = .0003). Moreover, the median TIS score for GIST was between the 65th and 70th percentile of the Cancer Genome Atlas dataset, in the same range of tumors responding to anti-PD-1/PD-L1. Analysis of the Gene Expression Omnibus database GIST samples pre- and post-treatment confirmed that imatinib downregulates PD-L1 and IRF1 expression through the inhibition of KIT and PDGFRA, thus contributing to counteract the suppressed adaptive immune response against GIST. The presence of a rich immune infiltrate in GIST along with the presence of TIS and EIIS suggests that GIST may benefit from immunotherapy along with tyrosine kinase inhibitors.
Introduction
Gastrointestinal stromal tumors (GIST) are rare mesenchymal tumors characterized in the vast majority of cases by mutations of KIT proto-oncogene (KIT) and Platelet derived growth factor receptor alpha (PDGFRA) genes that are targets of tyrosine kinase inhibitors (TKI). The TKI revolutionized the treatment strategy of GIST and dramatically improved the clinical outcomes of patients with advanced disease.Citation1–Citation3 Unfortunately, even imatinib-responder patients invariably develop treatment resistance. A second generation of TKI, sunitinib and then regorafenib, targeting also kinases involved in tumor-related angiogenesis, was developed and approved for imatinib-refractory GIST treatment. However, the benefit of these second and third generations of TKI is very limited because patients again develop resistance after a median time of 4–6 months. Recently, new pan-TKI inhibitors demonstrated good and interesting results in the prolongation of survivals in early phase trials.Citation4,Citation5 However, the molecular background of GIST resistant to TKI is very complex due to the acquisition of new mutations and several genome alterations. Patients’ prolonged life expectancy associated with the complex biology involved in progressive disease led to a growing urgency and interest in developing new strategies to overcome the TKI resistance.
Recently, the introduction of immunotherapy in oncology with the monoclonal antibodies against the immunological checkpoints PD-1 and CTLA-4 revolutionized the treatment of cancer improving survival rates.Citation6–Citation8 Many studies on predictive factors of treatment response such as PD-1/PD-L1 expression, tumor mutational burden (TMB), immunogenic antigens or tumor-infiltrating immune cell presence and activation are under evaluation.
Only few studies, in preclinical and clinical setting, were conducted investigating the immunological profile of GIST. Available data showed that tumor-infiltrating immune cells are present in GIST, and seem to play a role in disease outcome and in increasing the antitumor activity of imatinib. In a transgenic mouse GIST model imatinib could polarize tumor-associated macrophages (TAM) to an M2-like phenotype.Citation9 The TAM was described in the microenvironment of GIST, in particular M2 macrophages were most enriched in metastatic and in imatinib-treated cases.Citation9–Citation11 Imatinib can promote natural killer (NK) activation and IFN-γ production, through stimulation of a KIT-dependent cross-talk between host dendritic cells and NK.Citation11 In particular, the NK infiltrate predicts progression-free survival in GIST, and patients classified as immunological responders on the basis of NK-interferon levels showed a better survival while treated with imatinib.Citation12
Tumor-infiltrating lymphocytes (TIL) are the second most enriched immune cell population in GIST samples.Citation9,Citation11,Citation13,Citation14 Balachandran et al. demonstrated that CD8+ T cells contribute to antitumor effects of imatinib.Citation15 They showed that imatinib leads to the activation of CD8+ T cells and inhibition of Treg through the inactivation of indoleamine 2,3-dioxygenase 1 (IDO). In preclinical GIST murine model, it was also shown that the therapeutic efficacy of imatinib was increased by combination with immune checkpoint inhibitors.Citation16 Few data on PD-1/PD-L1 expression in GIST are available showing that PD-L1 tumor expression by immunohistochemistry (IHC) was higher in GIST than in other sarcoma and PD-L1 expression at the mRNA level was heterogeneous across tumors.Citation13–Citation17
With regard to GIST patients, a clinical trial on the combination of KIT and CTLA-4 blockade with dasatinib and ipilimumab in GIST reported no synergistic activity, but the number of patients was limited to derive any conclusion.Citation18 The aim of this retrospective study was to dissect the immunological landscape of GIST to provide further rationale for immune-based approach and eventually develop basis to improve the treatment of GIST.
Results
GIST immune microenvironment
The abundance of 22 immune cell types within the tumor-infiltrating leukocyte population was estimated on 31 GIST retrospectively collected samples, in which gene expression profiles (GEP) were previously obtained with microarray (19 samples) and RNA-seq (12 samples) techniques. The two independent deconvolution analyses highlighted the prevalence of T cells, both CD4+ and CD8+, and macrophages (M2 and M1) (, and Supplementary Table S1). Overall, the absolute abundance estimation of tumor-infiltrating cells revealed some degree of variability, not due to the different molecular classes (KIT of PDGFRA mutant, Supplementary Figure S1A). It was also clarified that the two methods employed for immune cell deconvolution (microarray and RNA-seq) are actually comparable since variability found did not depend on the type of platform employed to perform the gene expression quantification (Supplementary Figure S1B) and Cibersort results obtained with the two methods on the same samples are highly correlated (Pearson r = 0.82–0.89) and cluster together (Supplementary Figure S2).
Figure 1. Heatmap representing the composition of the immune infiltrate signatures by microarray (a) and RNA-seq (b) data with CIBERSORT analysis (absolute abundance). Hierarchical clustering was performed on the infiltrating immune populations using Euclidean distance as a metric of similarity and average linkage as clustering method. The gray bars indicate the total absolute score for each sample. KIT- and PDGFRA-mutant GIST are labeled in cyan and yellow respectively. Tissue samples are labeled in green for primary tumors and purple for metastasis. The tumor site instead is represented with pink and brown boxes for stomach and intestine respectively.
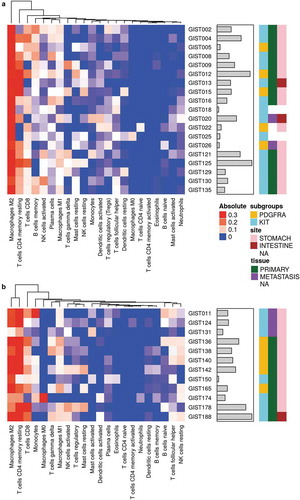
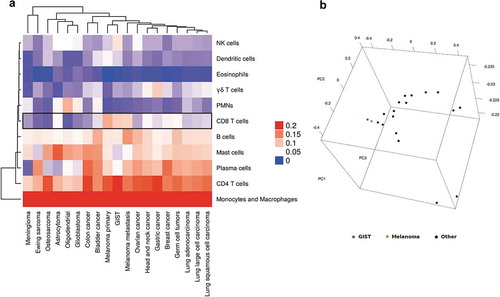
Examining the relative abundance of the single hematopoietic cell types (Supplementary Table S2), significant correlations between pairs of subpopulations could be identified. In particular, the abundance of macrophages negatively correlated with T cells presence (CD4+ and CD8+ together) supporting the existence of a reciprocal balance between the myeloid and lymphoid components of the immune infiltrate at the tumor site (Supplementary Figure S3). The comparison of the global GIST immune profile with that of other solid tumor types showed remarkable similarity to that of melanoma, one of the tumors that mostly benefits from immunotherapeutic approaches (). The immune microenvironment of GIST display a high abundance of infiltrating CD8+ T cells, similarly to primary and metastatic melanoma, where it is known to be particularly enriched. This evidence was also supported by other unsupervised approaches like the principal component analysis (PCA) ().
Figure 2. (a) Unsupervised hierarchical clustering of the tumor-infiltrating composition of GIST and other solid tumor types. The heatmap shows that CD8+ T cells are particularly enriched in GIST and melanoma (primary and metastatic). (b) Principal component analysis of CIBERSORT results of GIST (in purple) and other solid tumors.
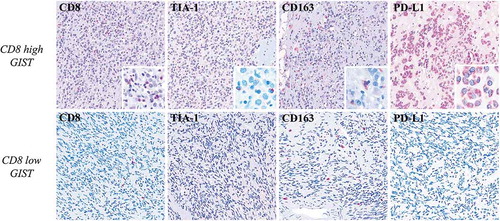
The IHC characterization corroborated the significant presence of an intra- and peri-tumoral immune infiltrate in GIST samples, consisting mostly of CD8+ T cells and CD163+ M2 macrophages (, Supplementary Table S3). The number of CD8+ lymphocytes and CD163+ elements varied from 5.6 to 88.9 mm2 (median 17.5 mm2) and 4.9 to 49 mm2 (median 27.2 mm2) respectively (Supplementary Table S3). These CD8+ and CD163+ immune populations were also observed at the invasive margin of the tumors (Supplementary Table S3). Expression of Tia-1 was also found in agreement with the presence of active cytotoxic elements (mainly located between neoplastic cells) (Supplementary Table S3) (). NK CD16+/granulysin(GNLY)+ were also detected in most of the GIST samples (5/8) both in the core and in the invasive margin of the tumors (Supplementary Table S3) (Supplementary Figure S4). Intra-tumoral FOXP3+ T-regulatory lymphocytes were revealed in 4/8 of the cases. Furthermore, the IHC study showed a PD-L1 protein expression on neoplastic cells in 50% of the samples analyzed (score +2) (Supplementary Table S3).
Figure 3. Immunohistochemical characterization of GIST samples. In the upper row, one high-CD8+ GIST shows high number of Tia-1+ (x100) (inset: x400) cell of microenvironment, presence of M2 CD163+ macrophages (x100) (inset: x400), and PD-L1 positivity (x100) (inset: x400) in the neoplastic population. The lower row shows one low-CD8+ sample that is characterized instead by a very low number Tia-1+ (x100) cells, presence of M2 CD163+ macrophages (x100), and PD-L1 negativity (x100) in the neoplastic population. The comparison between the two GIST groups high-CD8+ versus low-CD8+ highlights significant differences in the CD8 and TIA1 proteins expression (p = 0.01 and p = 0.02 respectively); differently, there are no significant differences in terms of CD163 and PD-L1 (p = 0.37 and p = 0.71 respectively).
GIST express immune signatures predictive of immune checkpoint inhibitor response
Beyond the estimation of tumor-infiltrating cells abundance, GEP were also interrogated in order to evaluate the expression in the 31 GIST samples of the expanded IFN-γ-induced immune signature (EIIS), identified as a predictor of immunotherapy response in head and neck squamous cell carcinoma and melanoma (Supplementary Table S4).Citation19,Citation20 This signature encompasses 18 genes related to cytolitic activity, inflammatory cytokines, T-cell markers, antigen presentation, and immunomodulatory factors. We found that this signature was clearly expressed in the majority of GIST samples and, interestingly, it positively correlated with PD-L1 expression (p < 0.0001) (,). Interestingly, even in melanoma samples from the Cancer Genome Atlas (TCGA), the EIIS signature correlates with PD-L1 expression (Supplementary Figure S5).
Figure 4. (a) Heatmap representing the positive correlation between the expanded IFN-γ-induced immune signature and PD-L1 expression (cyan bars) in GIST sample. (b) Scatterplot between the average expression of the EIIS per sample and the PDL1 expression. (c) Positive correlation between PD-L1 and both CD8A and CD8B expressions.
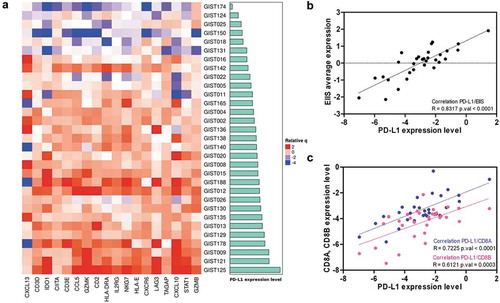
Moreover, the PD-L1 transcript abundance also positively correlated with the expression of CD8 receptor alpha and beta chains (respectively p < 0.0001 and p = 0.0003) that are expressed on cytotoxic T cells (). Of note, a good average expression of PD-1 (6.05 ± 0.04 log2Signal by microarray; 0.68 ± 0.1 tpm by RNA-seq) was found in all samples, supporting the hypothesis that GIST could be a good candidate for novel immune checkpoint treatments.
Gene expression data were also exploited to investigate another immune signature related to clinical response to checkpoint inhibitor treatments. In particular, we focused also on the T-cell-inflamed signature (TIS) proposed by Ayers et al. as an improvement of the EIIS described above. This signature (characterized by markers of an active IFN-γ signaling, cytotoxic effector molecules, antigen presentation and T-cell active cytokines) measures the presence of a suppressed adaptive immune response and was previously shown to be enriched in patients responsive to PD-1 inhibitor treatment (Supplementary Table S5).Citation19,Citation20
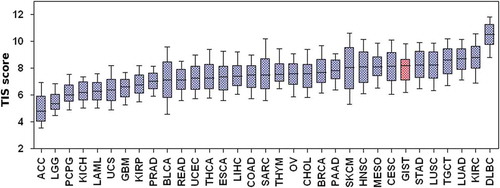
Adopting the TIS algorithm,Citation19 we compared the TIS score between our series and other tumors from TCGA dataset (Supplementary Table S6) showed that GIST have a high median TIS score (8.22), very close to tumor types with the highest response rates to anti-PD-1/PD-L1 inhibitors, such as head and neck squamous cell carcinoma (8.10), lung squamous cell carcinoma (8.26), and kidney clear cell carcinoma (8.79) ().
Figure 5. T-cell-inflamed signature score of GIST and other solid tumor types from TCGA. ACC: adrenocortical carcinoma; BLCA: bladder urothelial carcinoma; BRCA: breast invasive carcinoma; CESC: cervical squamous cell carcinoma and endocervical adenocarcinoma; CHOL: cholangiocarcinoma; COAD: colon adenocarcinoma; DLBC: lymphoid neoplasm diffuse large B-cell lymphoma; ESCA: esophageal carcinoma, GBM: glioblastoma multiforme; HNSC: head and neck squamous cell carcinoma; KICH: kidney chromophobe; KIRC: kidney renal clear cell carcinoma; KIRP: kidney renal papillary cell carcinoma; LAML: acute myeloid leukemia; LGG: brain lower grade glioma; LIHC: liver hepatocellular carcinoma; LUAD: lung adenocarcinoma; LUSC: lung squamous cell carcinoma, MESO: mesothelioma; OV: ovarian serous cystadenocarcinoma; PAAD: pancreatic adenocarcinoma; PCPG: pheochromocytoma and paraganglioma; PRAD: prostate adenocarcinoma; READ: rectum adenocarcinoma; SARC: sarcoma; SKCM: skin cutaneous melanoma; STAD: stomach adenocarcinoma; TGCT: testicular germ cell tumors; THCA: thyroid carcinoma; THYM: thymoma (THYM); UCS: uterine carcinosarcoma; UVM: uveal melanoma.
Imatinib downregulates PD-L1 expression in GIST samples
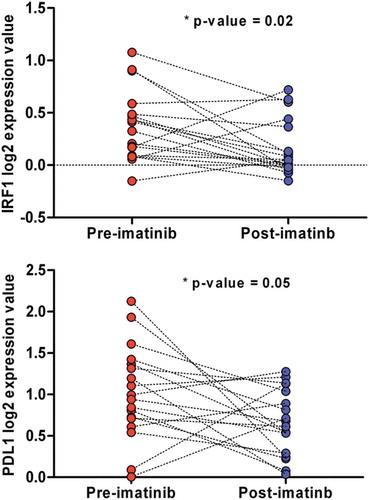
Since the current medical treatment of GIST relies on multiple and different generations of TKI, it is mandatory that any new treatment approach is conceived in combination with a TKI. It is already known that imatinib can exert immune modulatory effects, that PD-1/PD-L1 blockade enhances the antitumor efficacy of imatinib in murine GIST model,Citation16 and that JAK inhibitors and imatinib decrease the expression of PD-L1 in vitro in GIST882 and GIST-T1 cell lines. We therefore explored the possible modulatory effect of imatinib on the expression of the immune checkpoint inhibitors targets in a The Gene Expression Omnibus database (GEO) dataset of GIST tumor samples pre- and post-imatinib treatment. Since there are already evidences that KIT and PDGFRA interact with STAT1,Citation21,Citation22 it is conceivable that their signaling may regulate the expression of PD-L1 through the phosphorylation of STAT1 and the upregulation of IRF1, as it was described in melanoma.Citation23 Analysis conducted on public available GIST data showed that IRF1 and PD-L1 were significantly repressed in imatinib-treated with respect to pre-treatment samples (). Together with the previous knowledge reached by in vitro studies, these data from patient samples confirmed the hypothesis of a repressive role of imatinib on PD-L1 expression, supporting a view in which both TKI and checkpoint inhibitors cooperate in the activation of an adaptive immune response against GIST.
Figure 6. IRF1 and PD-L1 normalized expression between pre- and post-imatinib-treated GIST samples of the GEO dataset GSE15966.
Discussion
A comprehensive immunological evaluation of GIST showed a significant presence of immune infiltrate in GIST samples, with a predominance of T cells, both CD4+ and CD8+, and M2 macrophages. This immune profile emerges as closely similar to that of other solid tumor types in particular of melanoma, one of the most striking clinical responders to immunotherapy. The CD4+ and CD8+ expression patterns were slightly different from the previously published report by D’Angelo S. et al., in which it is mainly with a percentage <5%. The same report documented the presence of a high percentage of FOXP3+ cells, and of PD-L1 expression, positively correlated with higher amounts of infiltrating CD8+ or CD3+ cells, suggesting that these T cells may be functionally deficient due to the upregulated inhibitory receptor expression.Citation14 The different number of cases and probably also the different quantification methods may have contributed to the slight discrepancy of some subsets of immune cells. Anyway, notwithstanding this little different amount of TILs, altogether these data demonstrate that TILs are present in GIST and that the immune cell infiltrate may be considered a feature of GIST.Citation13
In fact, a recent work by Vitiello A et al.Citation24 on the immune profiling of GIST reported a difference of immune cell infiltrate, immunological activity and expression of immune-related genes between PDGFRA- and KIT-mutant GIST. Moreover, another recent study reported the expression of PD-L1 in around 70% of GIST, and identified an association between the expression of PD-L1 and tumor size.Citation25 In our series, there was no clear correlation between TIL amount and clinical and tumor features, and the limited number of samples did not allow to derive clinical correlations from the study results.
Additionally, an relevandata resulting from our work is the expression in GIST tumor samples of gene signatures, both the EIIS and TIS, that were recently identified as predictors of immune checkpoint inhibitors response in multiple tumor types. The EIIS was clearly expressed in the majority of GIST samples and, interestingly, it positively correlated with PD-L1 expression. This signature was considered a predictor of immunotherapy response in head and neck squamous cell carcinoma, melanoma, and gastric cancer.Citation19,Citation20 Indeed, it is known that PD-L1 expression is directly induced in tumor, immune infiltrate, and stromal cells by sustained IFN-γ signaling, representing feedback inhibition of anti-tumor immune responses. Few studies addressed the PD-1/PD-L1 expression in GIST and the available data showed that PD-L1 tumor expression by IHC was higher in GIST than in other sarcomas and PD-L1 expression at the mRNA level was heterogeneous across tumors.Citation14,Citation17 In fact, tumor heterogeneity could have an impact on the evaluation of the tumor immune microenvironment; therefore, we included in the analysis a representative number of tumor tissues, considering that it is a rare tumor, and also performed data validation by IHC on formalin-fixed paraffin-embedded (FFPE) samples, scoring different areas of the tumor specimen.
In our series, we found a positive correlation between the EIIS and PD-L1 expression and a positive correlation between PD-L1 expression and CD8A/CD8B genes supporting an adaptive mechanism of immune escape, as described in other oncological settings.
In addition, GIST showed high expression of the TIS signature and therefore high values of TIS score that were very close to tumor types in which high rates of response to PD-1/PD-L1 inhibitors were seen. The TIS score was recently evaluated together with the TMB to assess the predictive power in clinical response to anti-PD-1/PD-L1 therapy, stratifying human cancers into different clustersCitation26 capturing independently distinct tumor and microenvironment features.
Finally, in vitro (GIST882 and GIST-T1 cell lines) and in vivo murine models showed that IFN-γ regulates PD-L1 expression by the activation of the JAK-STAT signaling. Indeed, the induced upregulation of PD-L1 was abolished with imatinib and PD-1/PD-L1 blockade enhanced T-cell activity and increased the antitumor effects of imatinib.Citation16 This is in agreement with the evidences accumulating on other driver oncogenes and tumor histotypes, where for example oncogenic RAS signaling contributes to the evasion from the host immune system through upregulation and stabilization of PD-L1 that can be reversed by MEK inhibitor treatment.Citation27,Citation28
Indeed, multiple reports have shown that imatinib has an immune-modulatory effect, ranging from the increase in the number and activation of CD8+ T cells and NK cells to the decrease of Tregs and of IDO expression in the tumor.Citation13,Citation15,Citation29–Citation31 Moreover, imatinib can synergize with immunotherapy since the treatment with anti-PD-1 or anti-PD-L1 in the Kit V558Δ/+ GIST murine model increases the effect of imatinib by enhancing CD8+ T-cell function.Citation16
The results of our study on the presence of the immune microenvironment in GIST along with the expression of specific signatures, that are known to be predictive of response to checkpoint inhibitors, suggest that GIST may benefit from immunotherapy together with TKI.
The study on the combination of KIT and CTLA-4 blockade with dasatanib and ipilimumab reported a limited clinical efficacy of this combination in GIST but, as the authors stated, the enrolled patients were extensively pretreated and most of them were not evaluable for response.Citation18 Definitely, novel immunological approaches are emerging that exploit different immunomodulatory molecules to synergize with imatinib. One strategy could be to target the M2 macrophages polarization through the use of anti-CD40 antibody or TLR3 agonist or other compounds able to revert the M2-like phenotype induced by KIT inhibition.Citation32 Future clinical trials with new and more effective checkpoint inhibitors and IDO inhibitors in selected patients should be encouraged. In fact, despite new TKIs, BLU285, DCC2618, and crenolanib demonstrated good and interesting results in the prolongation of survival in early phase trials,Citation4,Citation5 in the future it is expected that TKI resistance develops and thus more efforts are needed to find a cure beyond or along with TKI for long-term advanced GIST.
In conclusion, our study provides a comprehensive picture of the microenvironment in GIST with a rich immune infiltrate in the majority of GIST along with the presence of TIS and IFN-γ signatures, predictive of immunotherapy response in multiple tumors, suggesting a potential susceptibility to respond to PD-1/PDL1 inhibitors and adds new data useful to build a robust basis for an immunotherapy approach in GIST treatment.
Patients and methods
Patients and tumor samples
A total of 31 GIST tumor samples were retrospectively collected and analyzed. The tumor and clinical characteristics are reported in . All cases were revised by two pathologists with expertise in GIST diagnosis, and all samples were characterized by the presence of KIT or PDGFRA mutation. KIT/PDGFRA WT GIST cases were excluded. Twenty-six samples were from primary tumors and five from metastases. In 26/31 patients, the analysis was done in absence of TKI therapy and only in 5 patients after TKI therapy (2 cases after imatinib and 3 cases after imatinib and sunitinib). Fresh tumor tissue was snap-frozen in liquid nitrogen and stored at −80°C until RNA extraction. In 19 specimens, the analysis was done on HG-U133Plus 2.0 Affymetrix arrays while in 12 tumors by Whole-Transcriptome RNA Sequencing on Illumina platform. This study was performed in agreement with the Declaration of Helsinki and approved by the local institutional ethical committee of Azienda Ospedaliero-Universitaria Policlinico S.Orsola-Malpighi (approval number 113/2008/U/Tess). All patients provided written informed consent.
Table 1. GIST samples included in series.
Gene expression analysis
Whole transcriptome sequencing and microarray samples were previously analyzed in Nannini et al.Citation33 In detail, RNeasy Mini Kit (Qiagen, Milan, Italy) was employed to extract the total RNA from tumor specimens. For the RNA-seq samples, the cDNA libraries were synthesized starting from 250 ng total RNA with TruSeq RNA Sample Prep Kit v2 (Illumina, San Diego, CA, USA) following the manufacturer’s protocol. HiScanSQ sequencer (Illumina) was used to generate sequences at 75bp in paired-end mode yielding an average of 61 million mapped reads/sample, reaching an average coverage of 44X. Read pairs were mapped on reference human genome and the gene expression was quantified using kallisto adopting the transcript per million (TPM) normalization.Citation34 For microarray samples, the RNA was quality-controlled and labeled as indicated by the Affymetrix expression technical manual and then hybridized to HG-U133Plus 2.0 arrays. Gene expression data were normalized and quantified by the RMA algorithm (package oligo, R-bioconductor).
Bioinformatics analysis
The analytical tool CIBERSORT (Cell-type Identification By Estimating Relative Subsets Of RNA Transcripts)Citation35 was applied on 31 tumors samples that were analyzed either with Affymetrix Array (19 samples) or Illumina whole transcriptome sequencing (12 samples) as described in . CIBERSORT uses a set of 22 immune cell reference profiles to derive a signature matrix which can be applied to deconvolute mixed samples in order to determine relative proportions of immune cells. Even if the CIBERSORT algorithm was originally developed using microarray data, it was declared as “platform agnostic”Citation36 and, therefore, applicable to both Affymetrix and Illumina data. The analysis was performed separately for the two set of data obtained with different techniques (microarray and RNA-seq). For each set, an unsupervised hierarchical clustering analysis was adopted using the CIBERSORT absolute estimation with the aim to evaluate the variability of the main microenvironment cells subpopulations. On the other hand, the CIBERSORT relative abundance scores were compared between GIST and 18 different solid tumors previously analyzed by Gentles et al.Citation37 For this purpose, we adopted the microarray subset of GIST since the reference authors based their study as well. More specifically, the 22 immune subpopulations were aggregated into 11 cell classes following the representation given by Gentles et al.,Citation37 then the similarity between GIST and other solid tumor was evaluated applying two different unsupervised approaches: the hierarchical clustering method and PCA (R-bioconductor, stats package). All the hierarchical clustering were performed adopting the ComplexHeatmap package within R-bioconductor (distance: Euclidean, clustering method: average linkage). For both microarray and RNA-seq samples, the transcriptome data were also used to quantify the expression of specific signatures known to be related to the cancer immune landscape. The transcript quantification data were first normalized and log2 transformed either with quantile normalization or log2TPM calculation respectively for microarray and RNA-seq data. An additional normalization was performed by subtracting the arithmetic mean of ten housekeeping gene expression (Supplementary Table S7). This group of genes was previously identified as low variance within a large set of cancer types and was adopted as a normalization factor for each sample.Citation19
The gene expression data, transformed as described above, were used to evaluate the expression of EIIS, an 18 genes signature defined by Ayers et al. (Supplementary Table S4). The global EIIS score for each sample was calculated by averaging the expression values of the 18 genes. The obtained scores were correlated with the corresponding PD-L1 expression by sample using the R package stats. Besides EIIS, we also evaluated the TIS.Citation19 Starting from a larger and more diverse tumor data set spanning nine cancer types (KEYNOTE-012 and -028 studies), the authors defined the TIS as a 18 genes signature (Supplementary Table S5), and basing on this improved set of genes they determined the TIS score as a linear function defined as: , where xi is the ith gene’s expression value obtained as described above and wi is a predefined weight for the ith gene derived by Ayers et al. that were derived from logistic regressions model.
Recently, Danaher et al. computed the TIS score adopting the gene expression data from the tumor included in TCGA.Citation20 Following their strategy of analysis, we evaluated the TIS score in our GIST series with respect to TCGA cancer types. Considering that the entire TCGA was derived from RNA-seq as TPM (https://osf.io/gqrz9/), we referred to RNA-seq GIST subgroup for the TIS score calculation in order to provide consistent and comparable expression data.
Other source of open data were explored in order to identify the effect of imatinib on PD-L1 and IRF1 expression. In particular, the GSE15966 dataset (GEO) was adopted as microarray expression series of 18 coupled GIST samples, pre- and post-imatinib treatment.Citation38 The LOESS normalized expression data of the coupled GIST samples were obtained with GEO2R tool and the differential expression of PD-L1 and IRF1 between pre- and post-imatinib-treated GIST was evaluated by a paired t-test analysis.
Immunohistochemistry
Eight FFPE samples were profiled by IHC. Unstained slides were dewaxed and rehydrated through Histoclear and graded alcohols. For antigen retrieval, slides were incubated in a PT-Link for 5 min at 92°C in EnVision Flex Target retrieval solution High pH (K 8004, Dako, Glostrup, Denmark). Incubation with the following primary antibodies was carried for 30 min at room temperature: anti-CD8 (dilution 1:100, clone 144b, Dako), anti-TIA-1 (dilution 1:300, clone 2G9, Immunotech), FOXP3 (dilution 1:100, clone SP97, Abnova), anti-CD163 (dilution 1:100 clone 10D6, Leica), and anti-PD-L1 (dilution 1:100, clone E1L3N, Cell Signaling). Immunostaining was performed employing the Dako Real Detection System Alkaline Phosphatase Kit (K5005, Dako) and chromogen (Fast Red) provided with the kit. For double immunostainings, the following mouse monoclonal antibodies were used: anti-granulysin (clone F-9, dilution1:300, Santa Cruz, Santa Cruz Biotechnology, Inc., Texas, U.S.A) and anti-CD16 (clone 2H7, dilution 1:40, Leica Microsystems Ltd., Newcastle-upon-Tyne, UK) according to the protocol described elsewhere.Citation39
The immunostained slides were scanned at 200× magnification by Olympus Dot-slide microscope digital system equipped with image analysis software VS-ASW and then evaluated in representative areas: each microenvironment marker was separately scored both in the core of the tumor (ten randomly selected fields) and in the invasive margin of tumor (ten randomly selected fields); the results were first reported as mean number of positive tumor-infiltrating immune cells/high power field and than mathematically referred to 1 mm2. The PD-L1 immunostaining in neoplastic cells was scored as 1+ when <5% positive cells were counted; 2+ when the percentage of stained cells was >5% and <50%; and 3+ when the number of stained cells was >50%.
Authors’ contributions
MAP, GT, VI, AA: conceived and designed the work, manuscript writing, manuscript approval. MU, AA: provided wet laboratory technical support in NGS data analysis, manuscript approval. MAP, GT, CC, SS, EF, VI, AA: data interpretation, manuscript approval. GT, VI: performed bioinformatics data analysis, manuscript approval. MAP, MN, MS, LG: contributed to patients and samples recruitment, manuscript approval. CA, DS, ADL, ES, TM, AAk: morphological and immunohistochemical diagnosis and analysis, manuscript approval. MAP, AP, AA: project overview, manuscript approval
Disclosure of potential conflicts of interest
No potential conflicts of interest were disclosed.
Ethics approval and consent to publication
This study was performed in agreement with the Declaration of Helsinki and approved by the local institutional ethical committee of Azienda Ospedaliero-Universitaria Policlinico S.Orsola-Malpighi (approval number 113/2008/U/Tess).
All patients provided written informed consent.
Availability of data and materials
Data generated and analyzed during this study are mostly are included in this published article as supplementary tables. Additional data are available from the corresponding author on reasonable request.
Supplemental Material
Download MS Excel (80 KB)Supplemental Material
Download MS Power Point (3.3 MB)Acknowledgments
Special thanks to the GIST Study Group members, University of Bologna, Bologna, Italy: Sabrina Angelini, Annalisa Altimari, Francesco Buia, Ilaria Caldarera, Paolo Castellucci, Maurizio Cervellera, Claudio Ceccarelli, Matteo Cescon, Massimo Del Gaudio, Antonietta D’Errico, Stefano Fanti, Michelangelo Fiorentino, Elisa Gruppioni, Fabio Niro, Maria Giulia Pirini, Nico Pagano, Matteo Ravaioli, Gloria Ravegnini, Valeria Tonini, and Valerio Di Scioscio.
Supplementary material
Supplemental data can be accessed here.
Additional information
Funding
References
- Demetri GD, von Mehren M, Blanke CD, Van Den Abbeele AD, Eisenberg B, Roberts PJ, Heinrich MC, Tuveson DA, Singer S, Janicek M, et al. Efficacy and safety of imatinib mesylate in advanced gastrointestinal stromal tumors. N Engl J Med. 2002;347:472–480. doi:10.1056/NEJMoa020461.
- Demetri GD, van Oosterom AT, Garrett CR, Blackstein ME, Shah MH, Verweij J, McArthur G, Judson IR, Heinrich MC, Morgan JA, et al. Efficacy and safety of sunitinib in patients with advanced gastrointestinal stromal tumour after failure of imatinib: a randomised controlled trial. Lancet (London, England). 2006;368:1329–1338. doi:10.1016/S0140-6736(06)69446-4.
- Demetri GD, Reichardt P, Kang Y-K, Blay J-Y, Rutkowski P, Gelderblom H, Hohenberger P, Leahy M, von Mehren M, Joensuu H, et al. Efficacy and safety of regorafenib for advanced gastrointestinal stromal tumours after failure of imatinib and sunitinib (GRID): an international, multicentre, randomised, placebo-controlled, phase 3 trial. Lancet. 2013;381:295–302. doi:10.1016/S0140-6736(12)61857-1.
- Heinrich M, Jones R, Von Mehren M, Schöffski P, Mir O, Cassier PA, Eskens F, Shi H, Alvarez Diez T, Schmidt-Kittler O, et al. Clinical activity of BLU-285, a highly potent and selective KIT/PDGFR α inhibitor designed to treat gastrointestinal stromal tumor (GIST). J Clin Oncol. 2017;35:11011. doi:10.1200/JCO.2017.35.15_suppl.11011
- Janku F, Razak ARA, Gordon MS, Flynn D, Kaufman M, Pitman J, Smith B, Somaiah N, Jennings J, Salah S, et al. Encouraging activity of novel pan-KIT and PDGFRα inhibitor DCC-2618 in patients (pts) with Gastrointestinal Stromal Tumor (GIST). Ann Oncol. 2017;28:v521–v538. doi:10.1093/annonc/mdx387.
- Grant RM, Lama JR, Anderson PL, McMahan V, Liu AY, Vargas L, Goicochea P, Casapía M, Guanira-Carranza JV, Ramirez-Cardich ME, et al.. Improved survival with ipilimumab in patients with metastatic melanoma. N Engl J Med. 2010;363:711–723. 10.1056/NEJMoa1011205.
- Reck M, Rodríguez-Abreu D, Robinson AG, Hui R, Csőszi T, Fülöp A, Gottfried M, Peled N, Tafreshi A, Cuffe S, et al. Pembrolizumab versus chemotherapy for PD-L1–positive non–small-cell lung cancer. N Engl J Med. 2016;375:1823–1833. doi:10.1056/NEJMoa1606774.
- Motzer RJ, Escudier B, McDermott DF, George S, Hammers HJ, Srinivas S, Tykodi SS, Sosman JA, Procopio G, Plimack ER, et al. Nivolumab versus everolimus in advanced renal-cell carcinoma. N Engl J Med. 2015;373:1803–1813. doi:10.1056/NEJMoa1510665.
- van Dongen M, Savage NDL, Jordanova ES, Briaire-de Bruijn IH, Walburg KV, Ottenhoff THM, Hogendoorn PCW, van der Burg SH, Gelderblom H, van Hall T. Anti-inflammatory M2 type macrophages characterize metastasized and tyrosine kinase inhibitor-treated gastrointestinal stromal tumors. Int J Cancer. 2010;127:NA–NA. doi:10.1002/ijc.25113.
- Thomas-Claudepierre A-S, Schiavo E, Heyer V, Fournier M, Page A, Robert I, Reina-San-Martin B. The cohesin complex regulates immunoglobulin class switch recombination. J Exp Med. 2013;210:2495–2502. doi:10.1084/jem.20130166.
- Tan Y, Trent JC, Wilky BA, Kerr DA, Rosenberg AE. Current status of immunotherapy for gastrointestinal stromal tumor. Cancer Gene Ther. 2017;24:130–133. doi:10.1038/cgt.2016.58.
- Rusakiewicz S, Perier A, Semeraro M, Pitt JM. Pogge von Strandmann E, Reiners KS, et al. NKp30 Isoforms And NKp30 Ligands Are Predictive Biomarkers Of Response To Imatinib Mesylate In Metastatic Gist Patients. Oncoimmunology. 2017;6:e1137418.
- Rusakiewicz S, Semeraro M, Sarabi M, Desbois M, Locher C, Mendez R, Vimond N, Concha A, Garrido F, Isambert N, et al. Immune infiltrates are prognostic factors in localized gastrointestinal stromal tumors. Cancer Res. 2013;73:3499–3510. doi:10.1158/0008-5472.CAN-13-0371.
- D’Angelo SP, Shoushtari AN, Agaram NP, Kuk D, Qin L-X, Carvajal RD, Dickson MA, Gounder M, Keohan ML, Schwartz GK, et al. Prevalence of tumor-infiltrating lymphocytes and PD-L1 expression in the soft tissue sarcoma microenvironment. Hum Pathol. 2015;46:357–365. doi:10.1016/j.humpath.2014.11.001.
- Balachandran VP, Cavnar MJ, Zeng S, Bamboat ZM, Ocuin LM, Obaid H, Sorenson EC, Popow R, Ariyan C, Rossi F, et al. Imatinib potentiates antitumor T cell responses in gastrointestinal stromal tumor through the inhibition of Ido. Nat Med. 2011;17:1094–1100. doi:10.1038/nm.2438.
- Seifert AM, Zeng S, Zhang JQ, Kim TS, Cohen NA, Beckman MJ, Medina BD, Maltbaek JH, Loo JK, Crawley MH, et al. PD-1/PD-L1 blockade enhances T-cell activity and antitumor efficacy of imatinib in gastrointestinal stromal tumors. Clin Cancer Res. 2017;23:454–465. doi:10.1158/1078-0432.CCR-16-1163.
- Bertucci F, Finetti P, Mamessier E, Pantaleo MA, Astolfi A, Ostrowski J, Starmann J, Tjwa M, Plate KH, Sültmann H, et al. PDL1 expression is an independent prognostic factor in localized GIST. Oncoimmunology. 2015;4:e1002729. doi:10.1080/2162402X.2015.1008371.
- D’Angelo SP, Shoushtari AN, Keohan ML, Dickson MA, Gounder MM, Chi P, Loo JK, Gaffney L, Schneider L, Patel Z, et al. Combined KIT and CTLA-4 blockade in patients with refractory GIST and other advanced sarcomas: A phase Ib study of dasatinib plus ipilimumab. Clin Cancer Res. 2017;23:2972–2980. doi:10.1158/1078-0432.CCR-16-2349.
- Ayers M, Lunceford J, Nebozhyn M, Murphy E, Loboda A, Kaufman DR, Albright A, Cheng JD, Kang SP, Shankaran V, et al. IFN-γ–related mRNA profile predicts clinical response to PD-1 blockade. J Clin Invest. 2017;127:2930–2940. doi:10.1172/JCI91190.
- Danaher P, Warren S, Lu R, Samayoa J, Sullivan A, Pekker I, Wallden B, Marincola FM, Cesano A. Pan-cancer adaptive immune resistance as defined by the Tumor Inflammation Signature (TIS): results from The Cancer Genome Atlas (TCGA). J Immunother Cancer. 2018;6:63. doi:10.1186/s40425-018-0367-1.
- Deberry C, Mou S, Linnekin D. Stat1 associates with c-kit and is activated in response to stem cell factor. Biochem J. 1997;327(Pt 1):73–80. doi:10.1042/bj3270073.
- Valgeirsdóttir S, Paukku K, Silvennoinen O, Heldin C-H C-WL. Activation of Stat5 by platelet-derived growth factor (PDGF) is dependent on phosphorylation sites in PDGF β-receptor juxtamembrane and kinase insert domains. Oncogene. 1998;16:505–515. doi:10.1038/sj.onc.1201897.
- Garcia-Diaz A, Shin DS, Moreno BH, Saco J, Escuin-Ordinas H, Rodriguez GA, Zaretsky JM, Sun L, Hugo W, Wang X, et al. Interferon receptor signaling pathways regulating PD-L1 and PD-L2 Expression. Cell Rep. 2017;19:1189–1201. doi:10.1016/j.celrep.2017.04.031.
- Vitiello GA, Bowler TG, Liu M, Medina B, Zhang J, Param N, Loo JK, Goldfeder RL, Chibon F, Rossi F, et al. Differential immune profiles distinguish the mutational subtypes of gastrointestinal stromal tumor. J Clin Invest. 2019. doi:10.1172/JCI124108.
- Blakely AM, Matoso A, Patil PA, Taliano R, Machan JT, Miner T, Lombardo KA, Resnick MB, Wang L-J. Role of immune microenvironment in gastrointestinal stromal tumours. Histopathology. 2018;72:405–413. doi:10.1111/his.2018.72.issue-3.
- Cristescu R, Mogg R, Ayers M, Albright A, Murphy E, Yearley J, Sher X, Liu XQ, Lu H, Nebozhyn M, et al. Pan-tumor genomic biomarkers for PD-1 checkpoint blockade-based immunotherapy. Science (80-). 2018;362:eaar3593. doi:10.1126/science.aar3593.
- Coelho MA, de Carné Trécesson S, Rana S, Zecchin D, Moore C, Molina-Arcas M, East P, Spencer-Dene B, Nye E, Barnouin K, et al. Oncogenic RAS signaling promotes tumor immunoresistance by stabilizing PD-L1 mRNA. Immunity. 2017;47:1083–1099.e6. doi:10.1016/j.immuni.2017.11.016.
- Chen N, Fang W, Lin Z, Peng P, Wang J, Zhan J, Hong S, Huang J, Liu L, Sheng J, et al. KRAS mutation-induced upregulation of PD-L1 mediates immune escape in human lung adenocarcinoma. Cancer Immunol Immunother. 2017;66:1175–1187. doi:10.1007/s00262-017-2005-z.
- Borg C, Terme M, Taïeb J, Ménard C, Flament C, Robert C, Maruyama K, Wakasugi H, Angevin E, Thielemans K, et al. Novel mode of action of c-kit tyrosine kinase inhibitors leading to NK cell-dependent antitumor effects. J Clin Invest. 2004;114:379–388. doi:10.1172/JCI21102.
- Tazzari M, Indio V, Vergani B, De Cecco L, Rini F, Negri T, Camisaschi C, Fiore M, Stacchiotti S, Dagrada GP, et al. Adaptive immunity in fibrosarcomatous dermatofibrosarcoma protuberans and response to imatinib treatment. J Invest Dermatol. 2017;137:484–493. doi:10.1016/j.jid.2016.06.634.
- Delahaye NF, Rusakiewicz S, Martins I, Ménard C, Roux S, Lyonnet L, Paul P, Sarabi M, Chaput N, Semeraro M, et al. Alternatively spliced NKp30 isoforms affect the prognosis of gastrointestinal stromal tumors. Nat Med. 2011;17(6):700–707. doi:10.1038/nm.2366.
- Zhang JQ, Zeng S, Vitiello GA, Seifert AM, Medina BD, Beckman MJ, Loo JK, Santamaria-Barria J, Maltbaek JH, Param NJ, et al. Macrophages and CD8 + T cells mediate the antitumor efficacy of combined CD40 ligation and imatinib therapy in gastrointestinal stromal tumors. Cancer Immunol Res. 2018;6:434–447. doi:10.1158/2326-6066.CIR-17-0345.
- Nannini M, Astolfi A, Urbini M, Indio V, Santini D, Heinrich MC, Corless CL, Ceccarelli C, Saponara M, Mandrioli A, et al. Integrated genomic study of quadruple-WT GIST (KIT/PDGFRA/SDH/RAS pathway wild-type GIST). BMC Cancer. 2014;14:685. doi:10.1186/1471-2407-14-685.
- Bray NL, Pimentel H, Melsted P, Pachter L. Near-optimal probabilistic RNA-seq quantification. Nat Biotechnol. 2016;34:525–527. doi:10.1038/nbt.3519.
- Newman AM, Liu CL, Green MR, Gentles AJ, Feng W, Xu Y, Hoang CD, Diehn M, Alizadeh AA. Robust enumeration of cell subsets from tissue expression profiles. Nat Methods. 2015 May;12(5):453–457. doi:10.1038/nmeth.3337.
- Newman AM, Gentles AJ, Liu CL, Diehn M, Alizadeh AA. Data normalization considerations for digital tumor dissection. Genome Biol. 2017;18:128. doi:10.1186/s13059-017-1257-4.
- Gentles AJ, Newman AM, Liu CL, S V B, Feng W, Kim D, Nair VS, Xu Y, Khuong A, Hoang CD, et al. The prognostic landscape of genes and infiltrating immune cells across human cancers. Nat Med. 2015;21:938–945. doi:10.1038/nm.3909.
- Rink L, Skorobogatko Y, Kossenkov AV, Belinsky MG, Pajak T, Heinrich MC, Blanke CD, von Mehren M, Ochs MF, Eisenberg B, et al. Gene expression signatures and response to imatinib mesylate in gastrointestinal stromal tumor. Mol Cancer Ther. 2009;8:2172–2182. doi:10.1158/1535-7163.MCT-09-0193.
- Marafioti T, Jones M, Facchetti F, Diss TC, Du MQ, Isaacson PG, Pozzobon, M., Pileri, S.A., Strickson, A.J., Tan, S.Y. and Watkins, F. Phenotype and genotype of interfollicular large B cells, a subpopulation of lymphocytes often with dendritic morphology. Blood. 2003;15(102):2868–2876. doi:10.1182/blood-2003-03-0692.