
ABSTRACT
A diversity of T helper (Th) subsets (Th1, Th2, Th17) has been identified in the human tumor microenvironment. In breast cancer, the role of Th subsets remains controversial, and a systematic study integrating Th subset diversity, T cell inflammation, breast cancer molecular subtypes, and patient prognosis, is lacking. In primary untreated breast cancer samples, we analyzed 19 Th cytokines at the protein level. Eight were T cell-specific, and subsequently measured in 106 prospectively-collected untreated samples. The dominant Th cytokines across all breast cancer samples were IFN-γ and IL-2. Th2 cytokines (IL-4, IL-5, IL-13) were expressed at low levels and not associated with any breast cancer subtype. Th17 cytokines (IL-17A and IL-17F) were up-regulated in triple negative breast cancer (TNBC), specifically in T cell non-inflamed tumors. In order to get insight into prognosis, we exploited the METABRIC transcriptomic dataset. We derived Th1, Th2, and Th17 metagenes based on manually curated Th signatures, and found that a high Th17 metagene was of good prognosis in T cell non-inflamed TNBC. Multivariate Cox modeling selected the Nottingham Prognostic Index (NPI), Th2 and Th17 metagenes as additive predictors of breast cancer-specific survival, which defined novel and highly distinct prognostic groups within TNBC. Our results reveal that Th17 is a novel prognostic composite biomarker in T cell non-inflamed TNBC.
Integrating immune cell and tumor molecular diversity is an efficient strategy for prognostic stratification of cancer patients.
Introduction
It is now well established that immune cells are key players in cancer physiopathology.Citation1 Phenotypic characterization of the immune infiltrate in cancer revealed that immunity plays an important role as a prognostic factor among other hallmarks of cancer.Citation2 In particular, T cell inflamed (T-high) and T cell non-inflamed (T-low) tumors may exhibit different prognosis and response to immune checkpoint blockers.Citation3,Citation4
Among immune cells, T helper (Th) cells are central regulators of the immune response through the secretion of cytokines, and have been linked to either good or bad prognosis in various cancer types.Citation5 An increasing number of Th subsets have been characterized based on specific cytokine patterns.Citation6 These include Th1, Th2, Th17, Th9, Th22 and T follicular helper cells (Tfh).Citation7 Some efforts have been made to understand the role of T cells in human breast cancer pathology.Citation8,Citation9 Early studies showed that Th2 cells were present in breast cancer,Citation10,Citation11 potentially promoting tumor metastases through IL-13,Citation8 leading to the view that breast cancer was mostly a Th2 tumor type, and that Th2 responses were associated with poor prognosis.Citation10,Citation11 Subsequently, a Tfh signature was positively associated with survival in tumors expressing HER2,Citation9 suggesting that the link between Th subsets and prognosis may be influenced by the breast cancer molecular subtype. Other studies have shown the presence of IFN-γ-producing Th1 cells, associated with a good prognosis,Citation12,Citation13 while regulatory T cells (Treg) were associated with poor prognosis.Citation14,Citation15 Last, in situ studies found the presence of IL-17-producing cells,Citation16-Citation18 among which the role of Th17 cells remains controversial.Citation19,Citation20
In all these studies, Th subsets were defined by the production of one subset-defining cytokine. However, diversity exists within each Th subset based on its global cytokine secretion pattern. For example, Th1 and Th2 cells have been subdivided into inflammatory and regulatory, depending on their co-expression of TNF versus IL-10, respectively.Citation21 Th17 cells can express a diversity of cytokines besides IL-17, defining mixed profiles.Citation22-Citation24 Hence, only a global assessment of Th cytokine expression patterns can provide an unbiased characterization of the various human Th subsets. A main challenge is to decipher the role played by this important diversity of Th cell subsets and cytokines in cancer.
Here, we conducted a systematic analysis of Th cytokines in human breast cancer microenvironment taking into account all different subtypes of breast cancer and the T lymphocyte infiltrate. This enabled us to link breast cancer, T inflammation and Th heterogeneity, identifying the Th17 pathway as a hallmark and prognostic signature in T-low triple negative (TN) breast cancer.
Results
Unsupervised multiparametric analysis of T cell cytokines in human breast cancer
In a cohort of 106 patients with untreated breast cancer, we have collected tumoral (T) and juxta-tumoral (pathologically non-involved) (J) tissue. All three major breast cancer molecular subtypes were represented: Luminal (66%), HER2+ (11%), TN (23%) ()). T and J were sliced in small pieces and enzymatically digested prior to analysis for secreted T cell cytokines ()). First, we asked which cytokines were specifically produced by T cells in the breast tumor microenvironment. In the first 20 patient samples, we measured T cell cytokines following 24h culture of single cell suspensions in the presence and absence of anti-CD3/anti-CD28-coated beads. Thirteen out of 19 cytokines were significantly detected: IL-1β, IL-2, IL-4, IL-5, IL-6, IL-9, IL-10, IL-13, IL-17A, IL-17F, IL-33, IFN-γ, and TNF-α ()). IL-21, IL-31, IL-22, IL-15, IL-28A, and IL-17E were below detection range ()). Among detected cytokines, IL-2, IL-4, IL-5, IL-9, IL-13, IL-17A, IL-17F, and IFN-γ were found to be T cell-specific, i.e. only detected following agonistic anti-CD3/anti-CD28 polyclonal T cell stimulation. Conversely, IL-6, TNF-α, IL-33, IL-1β, and IL-10 were significantly detected both with and without stimulation by anti-CD3/28 beads, suggesting an innate, T cell receptor-independent production ()).
Figure 1. Th1, Th2 and Th17 cells infiltrate the breast cancer microenvironment.
(a) Clinical variables of the 106 patients included in the study. Age and tumor size units are, respectively, years and millimeters. (b) Overview of the experimental approach and data transformation performed in . (c) Analysis of the supernatant for 19 different cytokines in 20 tumoral and 18 juxta-tumoral tissues stimulated or not during 24 h with agonist anti-CD3/anti-CD28 coated beads. (d) Paired comparison using a Wilcoxon-Mann-Whitney test between tumor and juxta-tumor samples (n = 106 patients) for all T cell-specific cytokines. Concentrations for each cytokines were normalized by the percentage of CD4 plus CD8 T cells among living cells infiltrating the tissue (Supplementary Figure S1 A) on the log scale. (e) Heatmap of T cell-specific cytokines log-transformed and normalized expression (as in )) in stimulated breast cancer tumor samples. T samples (n = 106) are represented in columns while cytokines are presented in rows. Clustering was made using a metrics based on Pearson correlation coefficients. Significance was annotated as follows: * P ≤ 0.05; ** P ≤ 0.01; *** P≤ 0.001. EE: Elston Ellis Grade; ER: Estrogen receptor; PR: Progesterone receptor; HER2+: Her2 amplified; TN: Triple negative; Prim: Primitive; Rel: Relapse; T: Tumor; J: Juxta-tumor; NA: Not available.
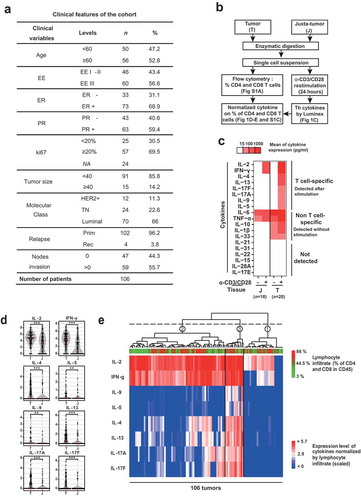
Subsequently, T cell-specific cytokine profiles were determined in 86 additional tumor samples, hence a final cohort of 106 patient samples with matched T and J ()). By comparing patient-matched T and J, we found that all T cell-specific cytokines were significantly higher in T compared to J ()). Levels of Th cytokines were normalized to the percentage of CD4 and CD8 T cells, to avoid a bias resulting from differences in T cell infiltration (Supplementary Figures S1(a)). In order to identify Th cytokine co-expression patterns, we performed a hierarchical clustering with Pearson correlation ()), which revealed three main clusters: cluster 1 expressed none or very few cytokines, cluster 2 predominantly expressed IL-2 and IFN-γ at high levels, and cluster 3 expressed all T cell-specific cytokines at variable levels. We conclude that multiple Th cell cytokines are secreted by breast cancer-infiltrating T cells, with distinct patterns of co-expression in different sample groups.
Th1, Th2, and Th17 subsets infiltrate breast cancer
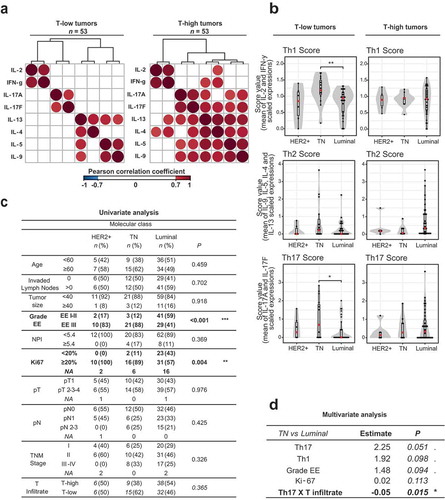
First, we questioned whether Th cytokine patterns were dependent on the T cell inflamed versus non-inflamed status of the tumors. We observed that T-high and T-low samples were distributed across the three clusters ()), preventing from capturing obvious patterns. Hence, we separated samples into T-low and T-high using a cut-off at the median (Supplementary Figure S1(b)), and repeated the clustering of the Th cytokines (Supplementary Figure S1(c)). This revealed distinct patterns, suggestive of specific cytokine co-regulation in relation to T cell infiltration. In T-low tumors, two main patterns were present: an IL-2- and IFN-γ-dominant expression, and a broader diversity of T cell-specific cytokines expressed at various levels. In T-high tumors, we distinguished three patterns: the two patterns observed in T-low tumors, and a pattern showing expression of all T cell-specific cytokines measured. We confirmed this differential cytokine co-regulation by analyzing the cytokine correlation matrixes in T-low and T-high tumors, respectively ()). In T-low tumors, T cell-specific cytokines clustered into three highly inter-correlated groups, characterized as Th1 for IFN-γ and IL-2, Th17 for IL-17F and IL-17A and Th2 for IL-9, IL-5, IL-13 and IL-4 ()). Conversely, only two patterns of co-regulation were found in T-high tumors: a Th1 cluster and a mixed Th2-Th17 cluster ()).
Figure 2. T cell non-inflamed triple negative breast tumors are associated with a Th17 phenotype.
(a) Representation of the Pearson correlation matrix of the T cell cytokine expression levels (log-transformed and normalized to the T cell infiltrate) for T-low (n = 53) and T-high (n = 53) tumors. Cut-off of significance was set up to a P-value strictly inferior to 0.05 and a correlation coefficient superior or equal at 0.7. (b) Boxplots representing the levels of each Th score among the three molecular subclasses of breast cancers: Luminal, TN and HER2+, for T-low (n = 53) and T-high (n = 53) tumors. The score values correspond to the mean of the expression of the cytokine belonging to the same cluster of high correlation defined in for T-low tumors. In a first step, cytokine expressions were normalized to the T cell infiltrate, log-transformed and scaled, as in ). Comparisons were made using the Wilcoxon-Mann-Whitney test. (c) Univariate analysis: table of comparison of all clinical variables and the T cell infiltrate with the breast cancer subtypes (n = 106). Comparisons were made with a fisher exact test. (d) Multivariate logistic regression was performed to explain the differences between Luminal and TN molecular subtypes (n = 94); variables found significant (P < .05) in the univariate analyses ( and ) were included in this analysis along with interaction between Th scores and T infiltrate. “Th1 X T infiltrate” (resp. “Th17 X T infiltrate”) represent the interaction term between Th1 (resp. Th17) and the T infiltrate percentage. Model selection was done by backward stepwise search with Akaike information criterion (AIC). Significance was annotated as follows: . P ≤ 0.10; * P ≤ 0.05; ** P ≤ 0.01; *** P≤ 0.001. T-low tumors: T cell non-inflamed tumors; T-high tumors: T cell inflamed tumors; TN: Triple negative; HER2+: Her2 amplified; EE: Elston Ellis Grade; NPI: Nottingham prognostic index; NA: Not available.
We then wondered whether the Th1, Th2 and Th17 cytokines were produced by the corresponding Th subsets, ex vivo. We analyzed breast tumor-infiltrating CD4 T cells using intracellular cytokine staining for IFN-γ, IL-13, and IL-17, respectively associated with the Th1, Th2, and Th17 clusters. We observed that breast tumors were infiltrated by CD4 T cells producing exclusively IFN-γ, or IL-13, or IL-17, hence representing three distinct Th cell populations (Supplementary Figure S1(d)). We also found that the majority of cells belonging to these three subsets produced only a single subset-defining prototypical cytokine (Supplementary Figure S1(e)), indicative of Th1, Th2 and Th17 cells, rather than T cells co-producing Th1, Th2, and/or Th17 cytokines. We conclude that Th1, Th2, and Th17 cells can be found within the same breast tumor microenvironment, each subset producing sets of highly inter-correlated subset-specific cytokines.
Th17 phenotype is associated with triple negative T cell non-inflamed breast cancer
We then asked whether these Th subsets were associated with a specific breast cancer subtype. We derived quantitative scores for the Th1, Th2 and Th17 clusters ()), representing the mean of the scaled value of all cytokines belonging to that cluster. Th scores were not significantly associated with T-low or T-high samples in the global cohort (Supplementary Figure S2(a)). Among T-high tumors, the scores fluctuated independently of breast cancer subtype. However, in T-low tumors, we found that Th1 (P = 0.005) and Th17 (P = 0.029) scores were higher in TN breast cancer as compared to Luminal ()).
Next, we asked whether clinical variables were associated with breast cancer subtypes and Th scores. We could confirm the increase of a high Elston-Ellis Grade (EE) and high ki-67 tumors in TN breast cancer and HER2 breast cancer subtypes, as compared to Luminal ()). We also found that the Th scores were higher in EE-high, as compared to EE-low tumors (Supplementary Figure S2(b)).
In the last step, we attempted to identify the relationship of all associations between breast cancer subtypes, Th scores and clinical variables at a multivariate level. Given that Th scores and breast cancer subtype were differentially associated depending on T inflammation, we derived two variables reflecting the interaction between the Th scores and T infiltration: “Th1 X T infiltrate” and “Th17 X T infiltrate”, which are the product of the respective score and the T infiltrate for each sample. We performed a multivariate logistic regression in order to determine which variables were associated with TN breast cancer as compared to Luminal breast cancer subtype. All variables identified by univariate analysis as associated with a specific breast cancer subtype (i.e. ki-67, EE, Th1, Th17, Th1 X T infiltrate and Th17 X T infiltrate) were included in the model. Backward variable selection rewarding goodness of fit – through Akaike information criterion (AIC) – excluded only the interaction of Th1 with the T infiltrate from the model. High EE, high ki-67 and high Th17 score were cumulatively associated with TN breast cancer as compared to Luminal. Moreover, the interaction term showed that high Th17 score was significantly more associated with TN breast cancer as compared to Luminal when cumulated with a low T cell infiltrate ()). Hence, our multivariate analysis uncovered that T-low TN breast cancer were associated with a Th17 phenotype, besides the previously described associations with high EE and high ki-67.
Triple negative breast tumors are enriched in a Th17 transcriptomic metagene
Taking advantage of the public METABRIC dataset,Citation25 containing data from 1977 breast cancer samples characterized by whole tumor transcriptomic analysis, we aimed at studying the positive association we identified between Th17 and TN breast cancer in an independent cohort offering prognostic information ()).
Figure 3. A Th17 metagene is a specific feature of T-low triple negative breast cancer.
(a) Overview of the experimental data features and statistical analysis performed in . (b) Heatmap of the scaled expression of Th17 related genes (Supplementary Table S2) for T-low tumors (n = 988). Genes are displayed in rows and order by a hierarchical clustering with Pearson distance and ward method. The tumor samples are displayed in columns and ordered by the values of their Th17 metagene. The Th17 metagene is the first component of the PCA of the 21 highly correlated genes included in the Th17 signature. Pie charts represent the proportion of the different BC subtypes in the three Th17 groups (Low, Intermediate and High) defined by k-means (Supplementary Table S1). The table displays the number of tumors in each group according to BC subtypes. (c) Heatmap of the regression coefficients estimated by a multivariate multinomial logistic elastic net regression used to assess relative contributions of Th scores and clinical variables to the three molecular subtypes (n = 988). All explanatory variables included in the multivariate model were prior found significant by univariate analysis (Supplementary Figure S3(d and e)). (d) Univariate multinomial logistic regression to assess which genes of the Th17 metagene are the most associated with TN, Luminal or HER2+ (n = 988). Genes from the Th17 metagene were ranked based on the value of their coefficient in the univariate test explaining TN. T-low tumors: T cell non-inflamed tumors; TN: Triple negative; HER2+: Her2 amplified; BC: Breast cancer; NPI: Nottingham prognostic index.
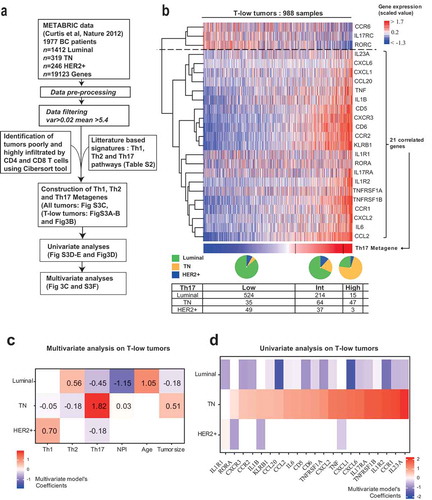
T cell-specific cytokines, with the exception of IFN-γ, were not detected in the METABRIC RNA dataset (data not shown), suggesting low production levels in the absence of TCR re-stimulation, as we have evidenced on ex-vivo samples ()). Therefore, to study Th phenotypes from transcriptomic data, we derived three manually curated signatures composed of key genes representative of the global Th1, Th2, and Th17 pathways (Supplementary Table S1). Each Th pathway signature contained Th subset-specific molecules, as well as upstream regulators and downstream targets. In order to establish a Th metagene from a Th signature, we selected the highly correlated genes of the signature in the METABRIC dataset. Then, a principal component analysis (PCA) was applied to this highly correlated genes list. The first component of the PCA defined the Th metagene. We also ensured that high values of the metagene were associated with high expression of the corresponding genes. This resulted in Th1, Th2 and Th17 metagenes (), Supplementary Figure S3(a and b)). Lastly, we generated three groups (low, intermediate and high) for each metagene using k-means clustering (Supplementary Table S1). The three metagenes were strongly correlated (coefficients over 0.8). However, we could observe over 20% mismatches between the low, intermediate and high groups (Supplementary Figure S3(c)). Only 66% of the samples were assigned to the same group for the 3 Th metagenes, meaning that 674 samples harbored different groups in their profiles of Th1, Th2, and Th17 metagenes. Hence, in spite of strong correlations, our three metagenes were variably distributed across the tumors.
In order to study the T-low tumors of the METABRIC dataset, we used CIBERSORTCitation26 to estimate T CD4 and T CD8 percentage among immune cells, and classified the tumors into T-low and T-high tumors with a median cutoff (Supplementary Table S1). For all subsequent analyses, we focused on T-low tumors, corresponding to a cohort of 988 patients. First, we could note that among the 674 samples harboring different groups, 306 were T-low (Supplementary Table S1). Indeed, Th1, Th2, and Th17 produced distinct classifications of the tumors, independently of the T cell estimate.
We found that the proportion of TN breast cancer was increased in the high-Th17 group, as compared to the low- and intermediate-Th17 groups ()), as identified at the protein level ( and ).
Subsequently, we used univariate analysis to identify clinical and immunological parameters associated with a given breast cancer subtype (Luminal, HER2+, TN), in addition to Th17. We found that older age, high NPI, large tumor size, and high EE grade were significantly associated with TN breast cancer as compared to Luminal breast cancer subtype (Supplementary Figure S3(d)), matching literature knowledge and our own results on the prospective cohort (). Th1 and Th2 metagenes were also significantly higher in TN breast cancer as compared to Luminal and HER2+ breast cancer (Supplementary Figure S3(e)).
We then wondered if those relationships to TN breast cancer were cumulative or if only a few of them could summarize the association. A multivariate model including the three metagenes along with age, NPI and tumor size revealed that Th17 was the most important feature to discriminate between TN breast cancer and the other subtypes ()). Luminal tumors were identified as having high Th2, together with low Th17, low NPI and older age. Her2+ tumors had high Th1, together with low Th17. As the EE grade is included in the NPI scoring, an independent model was fitted figuring the EE grade, confirming the association of Th17 metagene with TN breast cancer (Supplementary Figure S3 F). These results suggested that Th signatures were dominant biological features discriminating breast cancer molecular subtypes.
Next, we asked whether TN breast cancer was associated with individual genes of the Th17 pathway with higher or lower specificity. By ranking those genes based on their model coefficient, we found that CCR1 and IL23A, two important genes of the Th17 downstream and upstream pathways, respectively, were the top genes associated with TN breast cancer ()). This result specifies the association of Th17 with TN breast cancer at the global and single gene levels.
Taken together, these results provided an independent evidence for the specific and significant association between Th17 and TN breast cancer, as initially established in our prospective dataset on ex vivo-stimulated T cells.
Th17 metagene is associated with good prognosis in T-low TN breast cancer
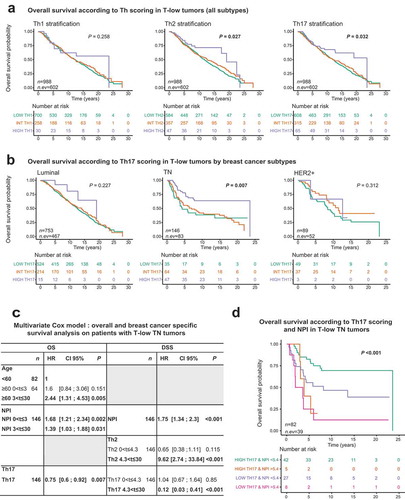
We asked whether Th17 could be a prognostic biomarker in T-low tumors within different breast cancer subtypes. First, we assessed overall (OS) and disease-specific survival (DSS) according to the Th metagene groups (high, intermediate and low) () and Supplementary Figure S3(a and b)). In all T-low tumors, we found a significant association of the Th17-high group with an improved OS (log-rank test with P = 0.032, ), but no significant association with DSS. However, in T-low TN tumors, we found a strong association between Th17-high group and both OS and DSS (log-rank OS P = 0.007 and DSS P = 0.019, ) and Supplementary Figure S4(b)). Th2-high group was associated with improved OS in T-low TN tumors (log-rank P = 0.022, Supplementary Figure S5 B). Surprisingly, Th1-based groups were not associated with survival for any of the breast cancer subtypes (Supplementary Figure S5(a)).
Figure 4. A high Th17 metagene is associated with improved overall survival in T-low triple negative breast cancer.
(a) Kaplan-Meier overall survival curves for T-low tumors stratified by the different Th scores (n = 988). Difference in survival was assessed by log rank test. (b) Kaplan-Meier overall survival curves for T-low tumors depending on the breast cancer subtype and stratified by the Th17 score (Luminal n = 753; TN n = 146; HER2 + n = 89). Difference in survival was assessed by log rank test. (c) Multivariate cox modeling was used to assess relative contributions of the Th scores and clinical variables to the overall and BC-specific survival of T-low TN patients (n = 146). All explanatory variables included in the multivariate model were prior found significant by univariate analysis (Supplementary Table S3). (d) Kaplan-Meier overall survival curves for T-low TN tumors and stratified by the interaction of the Th17-low/Th17-high with the NPI (n = 82). Difference was assessed by log rank test. T-low tumors: T cell non-inflamed tumors; TN: Triple negative; HER2+: Her2 amplified; BC: Breast cancer; NPI: Nottingham prognostic index; HR: Hazard ratio; CI 95%: 95% Confidence interval; OS: overall survival; DSS: Disease-specific survival.
Interestingly, Th-17 metagene prognostic role differed in the T-high cohort. Indeed, the metagene was not associated with improved survival in the total T-high cohort (log-rank OS P = 0.662 and DSS P = 0.718, Supplementary Figure S6 A). In T-high TN tumors, we found a borderline association between Th17-high group and both OS and DSS (log-rank OS P = 0.063, and DSS P = 0.051, Supplementary Figure S6 B).
Cox proportional hazard models were performed to determine the variables associated with survival for all T-low tumors, and for T-low TN tumors. All variables were first included in univariate models in their continuous form (when available). Log-linearity assumption was evaluated, and the categorical form of the variable was used when the assumption was found violated. This was the case for tumor size, age, and Th2 for OS outcome, and tumor size, and Th1 for DSS. Proportional hazard (PH) assumption was also evaluated and, in case of violation, several coefficients were estimated for the variable, each coefficient describing the effect of the variable on a different time interval. For example, a variable may be positively associated to OS in [0;5], meaningless deaths of any cause during that period, but may not significantly associate to survival in the other time intervals.
Variables with a low P-value (P < 0.10) in univariate analysis (Supplementary Table S3) were included in a multivariate Cox model, respectively for all T-low tumors, and T-low TN tumors. A stepwise variable selection approach based on the Bayesian information criterion (BIC) was then applied. Log-linearity and PH assumption were also evaluated on those multivariate models, and the necessary modifications were implemented (different time intervals may have been chosen, depending on how the assumptions were violated).
On total T-low tumors, univariate analyses selected EE grade, tumor size, age, NPI, Th1, Th2 and Th17 with time intervals of [0; 5],]5; 12], and]12; 30] for OS outcome. For DSS, the selected variables were EE grade, tumor size, age and Th17 with time intervals of [0; 5],]5; 12], and]12; 30] and NPI with time intervals of [0; 4],]4; 12], and]12; 30] (Supplementary Table S3). In the multivariate setting, after application of a stepwise procedure, we found that higher age at diagnosis was strongly associated to poor OS, in]5; 12] and]12; 30] (both P ≤ 0.001), with a stronger association on the last interval. NPI was associated with poor OS on [0; 5] and]5; 12] (both P ≤ 0.001), with a stronger association on the first interval. Lastly, Th1 was associated with improved OS (P = 0.015). Concerning the DSS outcome, only NPI was selected by the stepwise procedure. NPI was found associated to poor DSS on both [0; 5] and]5; 30] (both P ≤ 0.001), with a stronger impact on the first interval (Supplementary Table S4).
The same strategy was applied to T-low TN tumors. Univariate analyses selected EE grade with time intervals of [0; 2],]2; 7], and]7; 30], tumor size and NPI with time intervals of [0; 5] and]5; 30], Th2 with time intervals of [0; 3],]3; 5.5], and]5.5; 30], age, Th1 and Th17 for OS outcome. For DSS, the selected variables were EE grade with intervals of [0; 4] and]4; 30], tumor size with intervals of [0; 4.3] and]4.3; 30], Th2 and Th17 with intervals of [0; 2] and]2; 30] and NPI (Supplementary Table S3). In multivariate analysis, we found that higher age at diagnosis was strongly associated with poor OS, in [3; 30] only (P = 0.005). NPI was associated with poor OS in both [0; 3] and]3; 30] (P = 0.002 and P = 0.031, respectively), with a stronger association on the first interval. Lastly, Th17 was associated with improved OS (P = 0.007). For DSS, NPI was found associated with poor survival (P ≤ 0.001). Th2 was found associated with poor DSS in]4.3; 30] (HR = 9.62 and P ≤ 0.001). Lastly, Th17 was found associated with improved DSS in]4.3; 30] (HR = 0.12 and P ≤ 0.001) ()). This revealed the specificity of the Th17 prognostic value in TN breast cancer, and the importance of stratifying tumors based on molecular subtypes.
We then chose to explore further the Th17 – NPI interaction in the T-low TN breast cancer cohort to improve prognostic stratification towards clinical impact. We found that the group with low NPI and high Th17 metagene values presented a better survival as compared to the group with high NPI and low Th17 values (OS P = 0.00003, DSS P < 0.00001, Supplementary Figure S4(c and d)). Furthermore, within NPI-low TN breast cancer, Th17-high patients showed a significantly improved survival (OS P = 0.016, DSS P = 0.054, ), Supplementary Figure S4(c and d)). Hence, NPI and Th17 metagene define four distinct prognostic groups in T-low TN breast cancer.
Discussion
In this study, we uncovered the implication and prognostic impact of the Th17 pathway in human TN breast cancer. Since the identification of Th subsets producing specific sets of cytokines,Citation6,Citation27 a large number of diseases were associated with a unique Th type.Citation28 In cancer, it was generally shown that Th1 was associated with a good prognosis, but Th2 and Th17 associations with prognosis were study- and cancer type-dependent.Citation5 Some studies in breast cancer suggested that Th2 was the dominant profile, and that high Th2 was associated with a poor prognosis.Citation10,Citation11 It was shown that TSLP could promote a Th2 response with pro-tumoral effect in a mouse model.Citation8,Citation29 However, the prognostic impact of Th2 was not addressed in a specific patient cohort, and the expression of TSLP in breast cancer microenvironment remains controversial.Citation30 Other studies of Th cells in human breast cancer suggested a good prognostic impact of Th1 cells,Citation12,Citation13 and a negative prognostic impact of Treg cells,Citation14,Citation15 but without integrating the analysis of multiple Th subsets in various molecular breast cancer subtypes. IL-17E (IL-25) is another interesting cytokine acting by promoting tumor cell proliferation, and associated with bad prognosis in breast cancer.Citation31−Citation33 However, IL-17E is mostly epithelial cell-derived, and was not detected in our tumor-conditioned supernatants. In our study, we demonstrated that multiple Th cytokines and Th subsets co-occur within the same tumor microenvironment, without clear Th bias. Contrary to other reports, we found that Th17, and not Th1, was the most favorable prognostic signature in a subset of TN breast cancer with low T cell infiltrate, including in multivariate analysis. Hence, the prognostic value of Th subsets and signatures needs to be specifically assessed in defined cancer patient populations.
Tfh cells have been described in cancer and play an important role in promoting B cell maturation and antibody production.Citation34 Using transcriptomic signatures, Tfh cells were associated with survival in HER2 breast cancer,Citation9 although Tfh signatures were not confronted to other Th signatures in a multivariate testing. In our data, we could not detect any significant IL-21 production, which is the prototypical Tfh cytokine. Several underlying hypotheses can be proposed: i) the rarity of Tfh cells may lead to IL-21 levels below the detection limit of our assays; ii) Tfh could be present without producing IL-21; or iii) micro-environmental factors could inhibit IL-21 production by Tfh cells. In any case, further studies are needed to precisely characterize Tfh cells in the breast cancer microenvironment.
A number of studies have highlighted total T cell infiltration as a biomarker to stratify tumors in various anatomical locations. This led to the definition of T cell inflamed versus T cell non-inflamed tumors,Citation35 T cell inflamed being of better prognosisCitation36,Citation37 and responding more frequently to checkpoint inhibitors in many cancer types.Citation38 Most prognostic biomarkers in cancer were studied independently of T cell infiltration. In this study, we provide evidence that a Th17 signature is associated with good prognosis in TN breast cancer specifically in T-low tumors. We propose that other clinical and biological prognostic markers in cancer may have a different prognostic impact in T-low versus T-high tumors. This should encourage the reanalysis of established datasets following patient sample stratification according to T cell infiltration.
It was shown that TN breast cancer was the most heterogeneous subtype among all breast cancer in terms of clinical behavior, and large-scale molecular profiling.Citation39 Transcriptomic studies identified seven TN breast cancer subgroups, one of which is associated with an immune signature and good prognosis.Citation40,Citation41 By exploiting the large database METABRIC, we uncovered different clinical outcomes specifically based on T cell infiltration and the Th17 pathway, but not the Th1 or Th2 pathways. These results go beyond previous classifications, and shed light on a specific combination of immune parameters, with potential clinical implications.
Clinical variables in cumulative scores such as the NPI are commonly used to guide therapeutic strategies in breast cancer,Citation42 yet not very often integrated in combination with biomarkers. By combining our Th17 score with the NPI, we discriminated patients with a distinct prognosis, with the group having a high NPI and low Th17 showing the lowest breast cancer-specific survival. Hence, a Th-associated score improved the prognostic assessment as compared to currently used clinical and molecular parameters, which opens perspectives for improved patient stratification. Combining innovative biomarkers with known clinical and pathological variables seems a very promising avenue for optimizing prognostic evaluation in cancer.
Specific targeted therapies are lacking in TN breast cancer.Citation43 Whether Th17 has pro- or anti-tumoral functions remains controversial.Citation5,Citation17,Citation19,Citation44 In breast cancer, the role of Th17 differs across studies.Citation45,Citation46 Higher Th17 infiltration was shown in TN breast cancer,Citation17,Citation18, but its specific prognostic impact was not assessed within TN tumors (stratified as Th17 high or low) or across tumor types independently of its association with TN.Citation47 In our study, we have established a link between Th17 and prognosis by assessing the Th17 pathway at the protein and transcriptional levels in each breast cancer subtypes. Our results associate Th17 and improved survival specifically in T cell non-inflamed TN breast cancer patients. Our results pave the way for novel immune therapies aiming at enhancing this specific Th response, such as CD5/CD6 co-stimulation,Citation48,Citation49 and the cytokines IL-23 or IL-1β.Citation50 Improving breast cancer stratification on the basis of specific immune signatures should promote a personalized prognostic assessment, and help decision-making in immunotherapy strategies.
Material and methods
Human samples and patient characteristics
Breast tumor and juxta-tumor (adjacent to the tumor and pathologically exempt of malignant tumor cell infiltration) tissues from the same 106 patients were obtained within 2 h after surgical resection. Samples were collected based on the following inclusion criteria: age>18 years, pathological diagnosis of breast cancer, untreated tumors, absence of immune modulating factors (including steroids) within the past month. Exclusion criteria were any indication of neoadjuvant therapy.
Clinical characteristics of the cohort are summarized in ). Patients were included prospectively. All three major molecular subclasses were represented (ER, PR and HER2 expression were determined by immunohistochemistry and tumors were classified into three groups: Luminal (ER+HER2- and PR+HER2-), TN (ER-PR-HER2-), HER2+ (HER2+)). Mean age was 61 years old, 28% of the cohort had a TNM stage I, 44% stage II and 24% stage III or higher, mean Nottingham Prognostic Index (NPI) was 3.8, with 11% of the cohort having a high NPI (NPI >5.4).
All patients signed an informed consent after approval of the study by the Internal Review Board and Clinical Research Committee of the Curie Institute. These studies were conducted in a laboratory that operates under exploratory research principles.
Breast tissues collection and digestion
Whole tumor tissues were minced into small pieces and suspended in CO2 independent medium (Gibco) containing 5% FBS (HyClone). Tissues were digested 45 min at 37°C with 2 mg/mL Collagenase I (Sigma), 2mg/ml Hyaluronidase (Sigma) and 25 µg/ml DNAse (Roche). Cell suspension was filtered through a 40-μm nylon cell strainer (Fisher Scientific) and washed in 50 ml of PBS supplemented with 1% human serum (Biowest) and EDTA 2 mmol/L (Gibco). This tissue collection study was performed using established laboratory protocols developed and standardized by the authors.
Flow cytometry
Cell suspensions were stained with the following antibodies, and matched isotype controls: anti-CD45-APC-cy7, anti-CD3-Alexa-700 (BD Biosciences) anti-CD4-APC (Miltenyi); anti-CD8-PE-Texas-red (Life technologies) in phosphate-buffered saline (PBS) supplemented with 1% human serum (BioWest) and 2 mM EDTA (Gibco). DAPI was used for live/dead discrimination. For intracellular staining, cells were kept overnight at 4°C in RPMI supplemented as described above. Cells were cultured 5 h at 37°C with PMA, ionomycine and 1X Brefeldine A (Ebioscience). Cells were stained with the live/dead yellow kit (Invitrogen) for 30 min at 4°C. Then, surface staining was performed for 15 min at 4°C using the following antibodies: anti-CD3-A700 (BD Pharmingen), anti-CD4-PercP (Beckman-Coulter), anti-CD8-PE-Texas-Red (Life technologies) and anti-CD45-APC-cy7 (BD Pharmingen). Finally, cells were fixed and permeabilized according to guidelines using the manufacturer’s kit (eBioscience). Cells were then stained for 30 min at room temperature with the following antibodies and matching isotype controls: anti-IL17A FITC (Biolegend), anti-IL13 APC and anti-IFNγ PC7 (ebioscience). Data acquisition was made on a Fortessa (BD) flow cytometer, and then analyzed with FlowJo software (Tree Star). Positive Facs staining were determined as compared to isotype control performed on the same cells. For all flow cytometry experiments raw data, with DAPI staining, can be provided upon request.
T cell restimulation and analysis of cytokines production
Cell suspensions were cultured in a 96 round bottom well plate (Costar) for 24 h with anti-CD3 and anti-CD28 beads (Invitrogen) at a ratio of 1 bead per living cell, and a concentration of 1.5 million cells/mL in RPMI 1640 Glutamax (Gibco) supplemented with 10% heat inactivated foetal calf serum (HyClone), 1% pyruvate (Gibco), and 1% penicillin-streptomycin (Gibco), 1% nonessential amino acids (Gibco). Culture supernatants were collected and stored at −80°C until processed. Tumors were highly variable in terms of cell viability, ranging from 10% to 90% across all samples. We choose to normalize our experimental procedure on viable cells for culture restimulation, with 150 000 viable cells in 100 mL. Viable cells were counted using a neubauer counting chamber, using tryptan blue for live/dead discrimination. However, individual viable data count for each of the 106 tumors is not provided in this study.
A single multiplex Luminex assay was used to measure the 19 following cytokines simultaneously in the supernatants: IL-1β, IL-2, IL-4, IL-5, IL-6, IL-9, IL-10, IL-13, IL-15, IL-17F, IL-17A, IL-17E, IL-21, IL-22, IL-28A, IL-31, IL-33, IFN-γ, TNF-α, in accordance with manufacturer guidelines (Millipore). The detection limit was 16pg/ml for IL-33 and IL-21, and 4pg/ml for the 17 other measured cytokines. Raw data can be provided upon request. In our assay, cytokine detection limits of quantification, which defined “positive reactivity”, were pre-defined (before study). These studies were performed using general research investigative assays.
Cytokine dataset normalization
In order to compare the cytokine concentration across different breast cancer samples without being biased by the amount of T cell infiltration, each cytokine concentration was normalized to the percentage of T cells in the sample (sum of CD3CD4 and CD3CD8 percentages among DAPI-cells). Variables were then log-transformed to approach a normal distribution, and scaled (SD = 1) to avoid giving more weight to cytokines produced at higher concentrations. Th1, Th2, and Th17 scores were defined as the mean of the scaled, log-transformed and normalized values of highly correlated cytokine clusters.
Public transcriptomic dataset transformation
The METABRIC transcriptomic dataset was transformed as in ref.Citation3 for the 1977 patients for which we were able to extract survival information. In order to remove invariant and non-expressed genes, we plotted the distribution of the mean and variance of the genes. The first time the distribution slopes reached zero values indicated the cut-off values (5.4 for the mean and 0.02 for the variance). Genes with a mean or variance value lower than the corresponding cut-off were filtered out. Breast cancer subtypes were determined according to the METABRIC annotations of ER, PR and HER2 gene expression (Luminal: ER+HER2- and PR+HER2-, TN: ER-PR-HER2-, HER2+: HER2+ tumors).
Dataset stratification in T-low and T-high cohorts
The experimentally generated dataset was subdivided in two cohorts (T-low and T-high) based on the percentage of CD4 and CD8 T cells among CD45 cells, with a median cut-off (Supplementary Figure S1 B). The transcriptomic METABRIC dataset was also subdivided in T-low and T-high cohorts (Supplementary Table S1). CIBERSORT algorithmCitation26 was used to quantify CD4 and CD8 T cells among CD45 cells. A median cut-off was used to define T-low and T-high groups.
Metagene construction
Gene signatures of Th1, Th2, and Th17 pathways were manually curated based on literature knowledge, combining genes related to T cell parameters, as well as upstream regulators and downstream effectors for each T helper pathway (Supplementary Table S2).
In order to assign more weight to genes explaining a greater part of the variance, the following methodology was used to derive a Th metagene from a Th signature.
First, using the METABRIC dataset, we selected highly correlated genes within the signature. Then, a principal component analysis (PCA) was applied to those highly correlated genes. The first component of the PCA defined the Th metagene. To ensure that high values of the metagene were associated with high expression of the corresponding genes, we observed the correlation between the metagene and the mean expression of the highly correlated genes (when this correlation was negative, the metagene was multiplied by −1).
This resulted in Th1, Th2 and Th17 metagenes (), Supplementary Figure S3(a and b)). Lastly, K-means clustering was used to discriminate three groups (low, intermediate, high) for each metagene.
Statistical analysis
To compare continuous variables among different groups, Wilcoxon-Mann-Whitney test was used for groups including less than 30 patients, and for variables displaying multimodal distributions; otherwise, we used student t-test. Association between categorical variables was assessed with the chi-square test, or with the Fisher’s exact test if at least one category included less than three patients. Hierarchical clustering was performed using EMA package. Ward’s criterion and Pearson correlation metric were used to cluster cytokine data, while Ward’s criterion and Euclidean metric were used to cluster samples.
In boxplots, lower and upper bars represent the first and third quartile, respectively, the medium bar is the median, and whiskers extend to 1.5 times the inter-quartile range. When present, the grey area shows the density, the red dot is the median, and the black dots are the cytokine values (after the normalization steps described above).
Using the glmnet package in R software, we performed multivariate logistic regression with a backward variable selection approach based on Akaike information criterion (AIC) and multinomial logistic elastic net regression in both univariate and multivariate settings were performed to assess contributions of different variables to the breast cancer subtypes. Representations of the modeling results are tables with estimate and P-values for logistic regressions, and heatmaps of the estimates for elastic net models. The lambda parameters were assessed by 10-fold cross-validation. Only variables with a significant P-value (P < 0.05) in univariate analysis were included in the multivariate modeling.
Prognosis analysis
Survival was defined as the time between diagnosis and the occurrence of the death (602 events for overall survival (OS) and 329 events for disease-specific survival (DSS)). Patients still alive at the time of the analysis were censored at their last follow-up date. For the DSS outcome, patients who died of causes other than breast cancer were censored at their time of the event. OS and DSS were estimated using the Kaplan–Meier method, and survival curves were compared using a log-rank test. Univariate and multivariate Cox proportional hazard models were performed to determine the variables associated with survival. All variables were first included in univariate models in their continuous form when available. Log-linearity assumption was evaluated using a model extension with quartiles and the ordinal form of the variable was used when the assumption was found violated. Proportional hazard (PH) assumption was controlled with the Schoenfeld residuals and, in case of violation, 2 or 3 coefficients were estimated for the variable, each coefficient describing the effect of the variable on a different time interval. The time intervals were chosen based on the plots of the scaled Schoenfeld residuals as a function of time and may differ depending on the outcome (OS or DSS). Variables with a low P-value (P < 0.10) in univariate analysis were included in multivariate Cox models and were then selected using a stepwise approach based on the Bayesian information criterion (BIC). Log-linearity and PH assumption were also evaluated on the multivariate models, and the necessary modifications were implemented. Analyses were performed using R software.
Disclosure
The authors report no conflict of interest.
Supplemental Material
Download Zip (6.6 MB)Acknowledgments
The authors wish to thank the INSERM U932; the Institut Curie Flow-Cytometry facility, in particular Zofia Maciorowsky, Annick Viguier, and Sophie Grondin for their technical help and expertise; and Olivier Lantz for critical reading of the manuscript.
This study makes use of data generated by the Molecular Taxonomy of Breast Cancer International Consortium. Funding for the project was provided by Cancer Research UK and the British Columbia Cancer Agency Branch.
Supplemental data
Supplemental data for this article can be accessed on the http://dx.doi.org/10.1080/2162402X.2019.1624130.
Additional information
Funding
References
- Hanahan D, Weinberg RA. Hallmarks of cancer: the next generation. Cell. 2011;144(5):646–674. doi:10.1016/j.cell.2011.02.013.
- Galon J, Mlecnik B, Bindea G, Angell HK, Berger A, Lagorce C, Lugli A, Zlobec I, Hartmann A, Bifulco C, et al. Towards the introduction of the “Immunoscore” in the classification of malignant tumours. J Pathol. 2014;232(2):199–209. doi:10.1002/path.4287.
- Matsumoto H, Thike AA, Li H, Yeong J, Koo S-L, Dent RA, Tan PH, Iqbal J. Increased CD4 and CD8-positive T cell infiltrate signifies good prognosis in a subset of triple-negative breast cancer. Breast Cancer Res Treat. 2016;156(2):237–247. doi:10.1007/s10549-016-3743-x.
- Smid M, Rodríguez-González FG, Sieuwerts AM, Salgado R, Prager-Van der Smissen WJC, van der V-DM, van Galen A, Nik-Zainal S, Staaf J, Brinkman AB, et al. Breast cancer genome and transcriptome integration implicates specific mutational signatures with immune cell infiltration. Nat Commun. 2016;7:12910. doi:10.1038/ncomms12910.
- Fridman WH, Pagès F, Sautès-Fridman C, Galon J. The immune contexture in human tumours: impact on clinical outcome. Nat Rev Canc. 2012;12(4):298–306. doi:10.1038/nrc3245.
- O’Shea JJ, Paul WE. Mechanisms underlying lineage commitment and plasticity of helper CD4+ T cells. Science. 2010;327(5969):1098–1102. doi:10.1126/science.1178334.
- Sallusto F. Heterogeneity of human CD4(+) T cells against microbes. Annu Rev Immunol. 2016;34:317–334. doi:10.1146/annurev-immunol-032414-112056.
- Aspord C, Pedroza-Gonzalez A, Gallegos M, Tindle S, Burton EC, Su D, Marches F, Banchereau J, Palucka AK. Breast cancer instructs dendritic cells to prime interleukin 13-secreting CD4+ T cells that facilitate tumor development. J Exp Med. 2007;204(5):1037–1047. doi:10.1084/jem.20061120.
- Gu-Trantien C, Loi S, Garaud S, Equeter C, Libin M, de Wind A, Ravoet M, Le Buanec H, Sibille C, Manfouo-Foutsop G, et al. CD4+ follicular helper T cell infiltration predicts breast cancer survival. J Clin Invest. 2013;123(7):2873–2892. doi:10.1172/JCI67428.
- Varn FS, Mullins DW, Arias-Pulido H, Fiering S, Cheng C. Adaptive immunity programmes in breast cancer. Immunology. 2017;150(1):25–34. doi:10.1111/imm.12664.
- Coussens LM, Zitvogel L, Palucka AK. Neutralizing tumor-promoting chronic inflammation: a magic bullet? Science. 2013;339(6117):286–291. doi:10.1126/science.1232227.
- Teschendorff AE, Gomez S, Arenas A, El-Ashry D, Schmidt M, Gehrmann M, Caldas C. Improved prognostic classification of breast cancer defined by antagonistic activation patterns of immune response pathway modules. BMC Cancer. 2010;10:604. doi:10.1186/1471-2407-10-604.
- Bates GJ, Fox SB, Han C, Leek RD, Garcia JF, Harris AL, Banham AH. Quantification of regulatory T cells enables the identification of high-risk breast cancer patients and those at risk of late relapse. J Clin Oncol. 2006;24(34):5373–5380. doi:10.1200/JCO.2006.05.9584.
- Oldford SA, Robb JD, Codner D, Gadag V, Watson PH, Drover S. Tumor cell expression of HLA-DM associates with a Th1 profile and predicts improved survival in breast carcinoma patients. Int Immunol. 2006;18(11):1591–1602. doi:10.1093/intimm/dxl092.
- Plitas G, Konopacki C, Wu K, Bos PD, Morrow M, Putintseva EV, Chudakov DM, Rudensky AY. Regulatory T cells exhibit distinct features in human breast cancer. Immunity. 2016;45(5):1122–1134. doi:10.1016/j.immuni.2016.10.032.
- Oda N, Shimazu K, Naoi Y, Morimoto K, Shimomura A, Shimoda M, Kagara N, Maruyama N, Kim SJ, Noguchi S. Intratumoral regulatory T cells as an independent predictive factor for pathological complete response to neoadjuvant paclitaxel followed by 5-FU/epirubicin/cyclophosphamide in breast cancer patients. Breast Cancer Res Treat. 2012;136(1):107–116. doi:10.1007/s10549-012-2245-8.
- Cochaud S, Giustiniani J, Thomas C, Laprevotte E, Garbar C, Savoye A-M, Curé H, Mascaux C, Alberici G, Bonnefoy N, et al. IL-17A is produced by breast cancer TILs and promotes chemoresistance and proliferation through ERK1/2. Sci Rep. 2013;3:3456. doi:10.1038/srep03456.
- Chen W-C, Lai Y-H, Chen H-Y, Guo H-R, Su I-J, Chen HHW. Interleukin-17-producing cell infiltration in the breast cancer tumour microenvironment is a poor prognostic factor. Histopathology. 2013;63(2):225–233. doi:10.1111/his.12156.
- Young MRI. Th17 cells in protection from tumor or promotion of tumor progression. J Clin Cell Immunol. 2016;7(3):431. doi:10.4172/2155-9899.1000431.
- Fabre JAS, Giustinniani J, Garbar C, Merrouche Y, Antonicelli F, Bensussan A. The Interleukin-17 Family of Cytokines in Breast Cancer. Int J Mol Sci. 2018;19:12. doi:10.3390/ijms19123880.
- Ito T, Wang Y-H, Duramad O, Hori T, Delespesse GJ, Watanabe N, Qin -FX-F, Yao Z, Cao W, Liu Y-J. TSLP-activated dendritic cells induce an inflammatory T helper type 2 cell response through OX40 ligand. J Exp Med. 2005;202(9):1213–1223. doi:10.1084/jem.20051135.
- Volpe E, Servant N, Zollinger R, Bogiatzi SI, Hupé P, Barillot E, Soumelis V. A critical function for transforming growth factor-beta, interleukin 23 and proinflammatory cytokines in driving and modulating human T(H)-17 responses. Nat Immunol. 2008;9(6):650–657. doi:10.1038/ni.1613.
- Volpe E, Touzot M, Servant N, Marloie-Provost M-A, Hupé P, Barillot E, Soumelis V. Multiparametric analysis of cytokine-driven human Th17 differentiation reveals a differential regulation of IL-17 and IL-22 production. Blood. 2009;114(17):3610–3614. doi:10.1182/blood-2009-05-223768.
- Zielinski CE, Mele F, Aschenbrenner D, Jarrossay D, Ronchi F, Gattorno M, Monticelli S, Lanzavecchia A, Sallusto F. Pathogen-induced human TH17 cells produce IFN-γ or IL-10 and are regulated by IL-1β. Nature. 2012;484(7395):514–518. doi:10.1038/nature10957.
- Curtis C, Shah SP, Chin S-F, Turashvili G, Rueda OM, Dunning MJ, Speed D, Lynch AG, Samarajiwa S, Yuan Y, et al. The genomic and transcriptomic architecture of 2,000 breast tumours reveals novel subgroups. Nature. 2012;486(7403):346–352. doi:10.1038/nature10983.
- Newman AM, Liu CL, Green MR, Gentles AJ, Feng W, Xu Y, Hoang CD, Diehn M, Alizadeh AA. Robust enumeration of cell subsets from tissue expression profiles. Nat Methods. 2015;12(5):453–457. doi:10.1038/nmeth.3337.
- Mosmann TR, Cherwinski H, Bond MW, Giedlin MA, Coffman RL. Two types of murine helper T cell clone. I. Definition according to profiles of lymphokine activities and secreted proteins. J Immunol. 1986;136:2348–2357.
- Luckheeram RV, Zhou R, Verma AD, Xia B. CD4+T cells: differentiation and functions. Clin Dev Immunol. 2012;2012:925135. doi:10.1155/2012/925135.
- Pedroza-Gonzalez A, Xu K, Wu T-C, Aspord C, Tindle S, Marches F, Gallegos M, Burton EC, Savino D, Hori T, et al. Thymic stromal lymphopoietin fosters human breast tumor growth by promoting type 2 inflammation. J Exp Med. 2011;208(3):479–490. doi:10.1084/jem.20102131.
- Ghirelli C, Sadacca B, Reyal F, Zollinger R, Michea P, Sirven P, Pattarini L, Martínez-Cingolani C, Guillot-Delost M, Nicolas A, et al. No evidence for TSLP pathway activity in human breast cancer. Oncoimmunology. 2016;5(8):e1178438. doi:10.1080/2162402X.2016.1178438.
- Mombelli S, Cochaud S, Merrouche Y, Garbar C, Antonicelli F, Laprevotte E, Alberici G, Bonnefoy N, Eliaou J-F, Bastid J, et al. IL-17A and its homologs IL-25/IL-17E recruit the c-RAF/S6 kinase pathway and the generation of pro-oncogenic LMW-E in breast cancer cells. Sci Rep. 2015;5:11874. doi:10.1038/srep11874.
- Furuta S, Jeng Y-M, Zhou L, Huang L, Kuhn I, Bissell MJ, Lee W-H. IL-25 causes apoptosis of IL-25R-expressing breast cancer cells without toxicity to nonmalignant cells. Sci Transl Med. 2011;3(78):78ra31. doi:10.1126/scitranslmed.3001374.
- Merrouche Y, Fabre J, Cure H, Garbar C, Fuselier C, Bastid J, Antonicelli F, Al-Daccak R, Bensussan A, Giustiniani J. IL-17E synergizes with EGF and confers in vitro resistance to EGFR-targeted therapies in TNBC cells. Oncotarget. 2016;7(33):53350–53361. doi:10.18632/oncotarget.10804.
- Crotty S. T follicular helper cell differentiation, function, and roles in disease. Immunity. 2014;41(4):529–542. doi:10.1016/j.immuni.2014.10.004.
- Jochems C, Schlom J. Tumor-infiltrating immune cells and prognosis: the potential link between conventional cancer therapy and immunity. Exp Biol Med (Maywood). 2011;236(5):567–579. doi:10.1258/ebm.2011.011007.
- Adams S, Gray RJ, Demaria S, Goldstein L, Perez EA, Shulman LN, Martino S, Wang M, Jones VE, Saphner TJ, et al. Prognostic value of tumor-infiltrating lymphocytes in triple-negative breast cancers from two phase III randomized adjuvant breast cancer trials: ECOG 2197 and ECOG 1199. J Clin Oncol. 2014;32(27):2959–2966. doi:10.1200/JCO.2013.55.0491.
- Angell H, Galon J. From the immune contexture to the immunoscore: the role of prognostic and predictive immune markers in cancer. Curr Opin Immunol. 2013;25(2):261–267. doi:10.1016/j.coi.2013.03.004.
- Galon J, Bruni D. Approaches to treat immune hot, altered and cold tumours with combination immunotherapies. Nat Rev Drug Discov. 2019;18(3):197–218. doi:10.1038/s41573-018-0007-y.
- Bianchini G, Balko JM, Mayer IA, Sanders ME, Gianni L. Triple-negative breast cancer: challenges and opportunities of a heterogeneous disease. Nat Rev Clin Oncol. 2016;13(11):674–690. doi:10.1038/nrclinonc.2016.66.
- Lehmann BD, Bauer JA, Chen X, Sanders ME, Chakravarthy AB, Shyr Y, Pietenpol JA. Identification of human triple-negative breast cancer subtypes and preclinical models for selection of targeted therapies. J Clin Invest. 2011;121(7):2750–2767. doi:10.1172/JCI45014.
- Masuda H, Baggerly KA, Wang Y, Zhang Y, Gonzalez-Angulo AM, Meric-Bernstam F, Valero V, Lehmann BD, Pietenpol JA, Hortobagyi GN, et al. Differential response to neoadjuvant chemotherapy among 7 triple-negative breast cancer molecular subtypes. Clin Can Res. 2013;19(19):5533–5540. doi:10.1158/1078-0432.CCR-13-0799.
- Galea MH, Blamey RW, Elston CE, Ellis IO. The Nottingham Prognostic Index in primary breast cancer. Breast Cancer Res Treat. 1992;22(3):207–219. doi:10.1007/BF01840834.
- Palma G, Frasci G, Chirico A, Esposito E, Siani C, Saturnino C, Arra C, Ciliberto G, Giordano A, D’Aiuto M. Triple negative breast cancer: looking for the missing link between biology and treatments. Oncotarget. 2015;6(29):26560–26574. doi:10.18632/oncotarget.5306.
- Guéry L, Hugues S. Th17 Cell Plasticity and Functions in Cancer Immunity. Biomed Res Int. 2015;2015:314620. doi:10.1155/2015/314620.
- Langowski JL, Zhang X, Wu L, Mattson JD, Chen T, Smith K, Basham B, McClanahan T, Kastelein RA, Oft M. IL-23 promotes tumour incidence and growth. Nature. 2006;442(7101):461–465. doi:10.1038/nature04808.
- Yang L, Qi Y, Hu J, Tang L, Zhao S, Shan B. Expression of Th17 cells in breast cancer tissue and its association with clinical parameters. Cell Biochem Biophys. 2012;62(1):153–159. doi:10.1007/s12013-011-9276-3.
- Stovgaard ES, Nielsen D, Hogdall E, Balslev E. Triple negative breast cancer – prognostic role of immune-related factors: a systematic review. Acta Oncol. 2018;57(1):74–82. doi:10.1080/0284186X.2017.1400180.
- Ayyoub M, Raffin C, Valmori D. Generation of Th17 from human naive CD4+ T cells preferentially occurs from FOXP3+ Tregs upon costimulation via CD28 or CD5. Blood. 2012;119(20):4810–4812. author reply 4812-4813. doi:10.1182/blood-2012-02-409722.
- de Wit J, Souwer Y, van Beelen AJ, de Groot R, Muller FJM, Klaasse Bos H, Jorritsma T, Kapsenberg ML, de Jong EC, van Ham SM. CD5 costimulation induces stable Th17 development by promoting IL-23R expression and sustained STAT3 activation. Blood. 2011;118(23):6107–6114. doi:10.1182/blood-2011-05-352682.
- Mills KHG. Induction, function and regulation of IL-17-producing T cells. Eur J Immunol. 2008;38(10):2636–2649. doi:10.1002/eji.200838535.