
ABSTRACT
Changes in the immune system induced by tyrosine kinase inhibitors (TKI) have been shown to positively correlate with therapy responses in chronic myeloid leukemia (CML). However, only a few longitudinal studies exist and no randomized comparisons between two TKIs have been reported. Therefore, we prospectively analyzed the immune system of newly diagnosed CML patients treated with imatinib (n = 20) or bosutinib (n = 13), that participated in the randomized BFORE trial (NCT02130557). Comprehensive immunophenotyping, plasma protein profiling, and functional assays to determine activation levels of T and NK cells were performed at diagnosis, 3, and 12 months after therapy start. All results were correlated with clinical parameters such as Sokal risk and BCR-ABL load measured according to IS%.
At diagnosis, low Sokal risk CML patients had a higher frequency of cytotoxic cells (CD8 + T and NK cells), increased cytotoxic potential of NK cells and lower frequency of naïve and central memory CD4 + T cells. Further, soluble plasma protein profile divided patients into two distinct clusters with different disease burden at diagnosis. During treatment, BCR-ABL IS% correlated with immunological parameters such as plasma proteins, together with different memory subsets of CD4+ and CD8 + T cells. Interestingly, the proportion and cytotoxic potential of NK cells together with several soluble proteins increased during imatinib treatment. In contrast, no major immunological changes were observed during bosutinib treatment. In conclusion, imatinib and bosutinib were shown to have differential effects on the immune system in this randomized clinical trial. Increased number and function of NK cells were especially observed during imatinib therapy.
Introduction
There are currently five approved tyrosine kinase inhibitors (TKIs) for the treatment of chronic phase chronic myeloid leukemia (CP CML). Imatinib was first launched approximately 15 years ago, soon followed by the second-generation TKIs, dasatinib, nilotinib, and bosutinib, and last, the third-generation TKI, ponatinib.Citation1 All the TKIs, with the exception of ponatinib, are now approved as first-line treatments in CML.Citation2,Citation3 The advances in the treatment of CML with different TKIs have led to a vast decrease in patients who are overall unresponsive or intolerant to therapy, as they may be treated with several different TKIs sequentially.Citation4 Today, CP CML patients are likely to have a normal life expectancy, but the majority face a life-long exposure to TKIs. Recent evidence shows, however, that up to half the patients who have achieved an optimal therapy response are able to discontinue their treatment without relapse, which may be partly due to the immunological changes observed during the treatment.Citation5,Citation6
TKIs are not entirely selective for BCR-ABL1 kinase inhibition because they also inhibit a variety of other kinases that may ultimately cause off-target effects. Notably, the second-generation inhibitors bosutinib and dasatinib both inhibit Src-kinases, which are important mediators of T-cell function.Citation7,Citation8 In contrast, imatinib and nilotinib have a much more narrow inhibition profile.Citation7 Earlier data from us and others have shown that dasatinib, in particular, has significant effects on the BCR-ABL-negative healthy immune cell compartment of CML patients both in vivo and in vitro, Citation5,Citation9–Citation15 whereas the immunomodulatory effects of imatinib have been previously shown especially in CML (as reviewed by Zitvogel et al.)Citation16 and gastrointestinal stromal tumors and recently also in neuroblastoma .Citation13,Citation16–Citation18 However, no systematic analysis of the immunological effects of the other second-generation TKI bosutinib inhibiting SRC family kinases at clinically relevant concentrations has yet been performed. Therefore, we aimed to characterize the immunological changes during frontline bosutinib and imatinib treatments, and analyze how these changes would correspond with the primary clinical parameters, such as the Sokal risk and BCR-ABL IS%, in order to understand the overall effects on the immune system in CP CML patients.
Results
CML patients with low Sokal risk score present a more active immune system at diagnosis
In order to study the effects of disease burden on the immune system, we first divided our CP CML cohort (n = 33) into three groups based on their Sokal risk score at diagnosis: low (n = 11), intermediate (n = 15), and high-risk (n = 6) ( and ). The immune system before the start of treatment was studied by extensive phenotyping, functional assays to measure the potential activity of both T and NK cells, and measuring 92 different plasma analytes by a high-throughput, multiplex immunoassay.
Table 1. Characteristics of bosutinib-treated patients (n = 13).
Table 2. Characteristics of imatinib-treated patients (n = 20).
The highest median percentage of the main cytotoxic NK cell population (CD3negCD56+ CD16+) from the lymphocytes was observed in the low (12.1%) and intermediate Sokal risk groups (12.9%), compared to the high-risk patients (6.5%; p = .06 and 0.07) (). The low-risk patients had significantly less CD3 + T cells from lymphocytes (68.6% vs. 76.6%; p = .002) ()). The low-risk patients also had the highest percentage of CD8 + T cells from the CD3 + T cells (median 32.3%) compared to high-risk patients (24.2%; p = .08) ()). Consequently, low-risk patients had less CD4 + T cells (median 59.8%) compared to the intermediate (70.2%; p = .31) and high-risk patients (72.1%; p = .04) (data not shown). Further, low-risk patients had significantly less CD57 expressing CD8 + T cells (median 16.4%) compared to the rest of the Sokal groups (intermediate 37.3%; p = .24 and high risk 58.8%; p = .02) ()). When comparing the memory status of T cells by expression of CCR7 and CD45RA, Citation19 we observed that the low-risk patients had significantly less naïve CCR7+ CD45RA+ CD4 + T cells (median for low risk 0.5%, and intermediate 2.7%; p = .018 and high risk 2.2%; p = .036) and central memory CCR7+ CD45RAneg CD4 + T cells (median for low risk 0.6%, and intermediate 2.3%; p = .016 and high risk 1.4%; p = .052) (). No significant differences were observed in the absolute numbers for CD3+, CD4+, and CD8 + T cells, and CD3negCD56+ CD16+ NK cells (supplementary Figure 1).
Figure 1. Low Sokal risk CML patients present a more active immune system. Effects of disease burden on the immune system were studied by first dividing the patients (n = 33) into three groups (low, intermediate, and high risk) based on their Sokal score at diagnosis and then by performing phenotyping and functional assays as well as measuring plasma proteins. Low and intermediate-risk patients had a higher percentage of NK cells (CD3negCD56+ CD16+) from lymphocytes than high risk patients (a). The low-risk patients had also lower frequency of CD3 + T cells from lymphocytes (b), higher percentage of CD8+ from total T cells (c), and a lower proportion of CD57 positive CD8 + T cells (d). Moreover, the low-risk patients had also the lowest frequency of naïve (e) and central memory CD4 + T cells (f). Also, the degranulation of NK cells was highest in the low-risk patients after in vitro stimulation (g). Plasma protein measurements revealed that the highest concentration of TRAIL in the plasma at diagnosis was also observed in the low-risk patients (h). TRAIL level is expressed as Normalized Protein eXpression (NPX) values, an arbitrary unit on log2-scale. Non-parametric Wilcoxon signed-ranked test was performed to compute the differences among three groups and data are presented as boxplots, including the median values for each parameter.
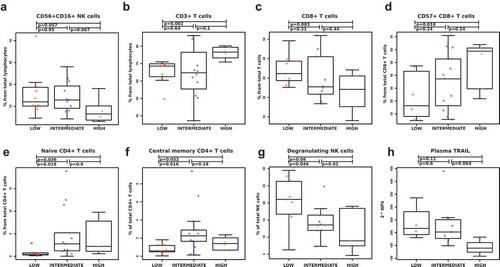
We further analyzed the function of the NK cells from a proportion of the patients (low n = 9, intermediate n = 9 and high risk n = 5) by stimulating the cells with the target cell line K562 and measuring the degranulation from CD107a/b expressions. The low Sokal risk patients had more functional NK cells (median 21.0%) at diagnosis when compared to the intermediate-risk (13.6%, p = .05) and high-risk patients (8.9%, p = .06) ()). Representative case of CD107 expression in unstimulated and K562-stimulated NK cells is shown in supplemental ). Interestingly, the comparison of unstimulated NK cells at diagnosis revealed a higher baseline degranulation in the low-risk patients (supplemental Figure 2(b)).
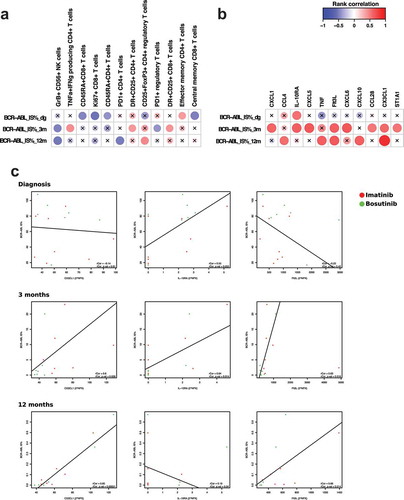
Figure 2. BCR-ABL burden correlates with immunological parameters during treatment time. Spearman rank correlation analysis revealed several significant hits when comparing BCR-ABL IS% at diagnosis, then 3 and 12 months after treatment start with multiple phenotyping parameters (a) as well at plasma proteins (b). The scale indicates correlation coefficient values: positive correlations are observed with red color and negative with blue color. Nonsignificant results are marked with an X. Individual correlation plots with regression were analyzed for CX3CL1, IL-10RA, and Flt3L at baseline, 3 months and 12 months (c). One outlier (abnormally high BCR-ABL IS%) was removed from the analysis. Bosutinib-treated patients are presented in the figures in green and imatinib-treated patients in red. Protein levels are expressed as Normalized Protein eXpression (NPX) values, an arbitrary unit on log2-scale. Regulatory T cells were gated as CD45+ CD3+ CD4+ CD25high FoxP3+, memory subsets of T cells were defined by expression of CCR7 and CD45RA, and cytokine-producing T cells refer to TNF-alpha and interferon-gamma-producing CD4 + T cells after in vitro-stimulation.
The analysis of plasma proteins revealed a higher concentration of TRAIL, a ligand that induces apoptosis, in low and intermediate-risk Sokal patients in comparison to the high-risk patients (p = .11 and 0.06; )).
Correlation of immunological parameters with BCR-ABL IS% at diagnosis and during treatment
To further evaluate the effects of disease burden on the immune system, we next correlated the immunological parameters to BCR-ABL at diagnosis, then at 3 and 12 months after therapy. We performed a rank correlation between the BCR-ABL IS% score (all patients combined) and characterized the immune system with phenotyping, functional assays, and plasma cytokine analyses. At diagnosis, both patient groups had similar leukemic cell burden; the median BCR-ABL IS% was 79 in the bosutinib and 75 in the imatinib group ( and ; p = .29). After 3 and 12 months on treatment, bosutinib-treated patients had better treatment responses with significantly lower BCR-ABL levels (at 3 months 1.51 vs. 8.48, p = .046 and at 12 months 0.01042 vs. 0.103, p = .0069, and ).
At diagnosis, a significant negative correlation to the IS% score was observed in CD45RA+ CD8+ and CD45RA+ CD4 + T cells, Ki67+ CD8 + T cells and central memory CD8 + T cells ()), suggesting that patients with higher tumor burden have more suppressed immune system at diagnosis.
Interestingly, both at 3 and 12 months GrB+ CD56+ NK cells showed significant negative correlation to disease burden suggesting that cytotoxic NK cells are associated with better treatment responses (lower BCR-ABL IS%). Moreover, positive correlation to the IS% score was observed cytokine-producing CD4 + T cells at 3 months (representative case of TNF-alpha and IFN-gamma production in unstimulated and stimulated T cells are shown in supplemental Figure 3, patient Im4, ). Other immune cell populations correlated only at 3- or 12-month time-points hindering definitive conclusions to be drawn ().
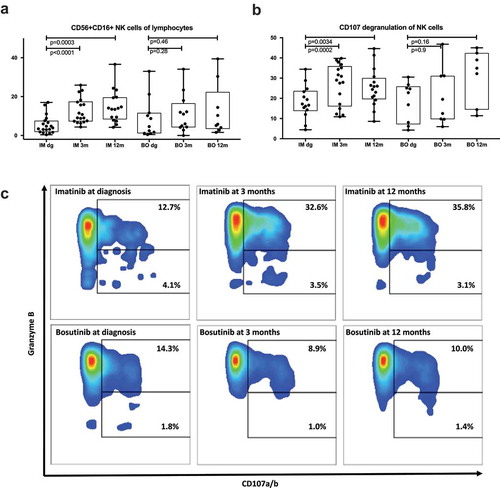
Figure 3. Imatinib therapy increases the proportion and function of NK cells. NK cells were characterized by flow analysis and functional assays. Imatinib-treatment significantly increases the proportion of NK cells from lymphocytes (a), as well as increase their responsiveness to K562-stimulation measured by degranulation (b-c). Non-parametric Wilcoxon signed-ranked test was performed to find the difference in functional assay at different timepoint and data are presented as boxplots.
From the plasma analysis (normalized with the values from healthy controls), we found a positive correlation at diagnostic IS% with only IL-10RA ()). However, at 3 months after the initiation of therapy, positive correlations were observed with the following cytokines: CXCL1, IL-10RA, CXCL5, Flt3L, CXCL6, CCL28, CX3CL1, and ST1A1. At the 12-month time-point, positive correlations between the IS% and CCL4, TNF-α, Flt3L, CXCL10, and CX3CL1 were detected ()). To further study the link between leukemic cells and cytokines, we next performed individual correlation plots with the BCR-ABL IS% for the most significant findings from the rank correlation analysis, namely CX3CL1, IL-10RA and Flt3L ().
The frequency and cytotoxic potential of NK cells increase during imatinib treatment
As NK cells are indicated to have a role in positive therapy response to imatinib and dasatinib, Citation5,Citation6,Citation20,Citation21 we next studied the evolution of the cells during the two treatments by phenotyping the NK cells and performing a degranulation assay from the pre-treated and follow-up samples (3 and 12 months after initiation of treatment).
During imatinib treatment, the median proportion of CD56+ CD16+ NK cells drastically increased (dg 3.9% vs. 3 months 9.9% p < .0001; vs 12 months 13.8% p = .0003). In contrast, no significant changes were observed in the NK cells during bosutinib treatment (dg 4.6%, 3 months 8.5%, 12 months 5.8%) ()). The cytotoxic potential of the NK cells, as measured by the expression of the degranulation marker CD107ab in NK cells after stimulation with target cell line K562, significantly increased after the start of imatinib treatment when compared to the samples from diagnosis (median at dg 16.9% vs. 3 months 29%, p = .0017; vs. 12 months 25.1%, p = .03) (). No significant changes were observed during bosutinib treatment (median at dg 22.8%, 3 months 16%, 12 months 34.9%). Representative case (Im3 in ) of CD107 expression in unstimulated NK cells and K562-stimulated cells is shown in supplemental Figure 2(a).
Plasma cytokine profile changes during imatinib treatment
We next studied the changes in the soluble plasma proteins and receptors in both treatment arms. Plasma samples from 8 imatinib- and 8 bosutinib-treated patients (all time-points) and 10 healthy volunteers (6 females, 4 males, mean age 51.7 years) were analyzed using the Proseek® Multiplex Inflammation immunoassay. Protein levels were expressed as Normalized Protein eXpression (NPX) values, an arbitrary unit on log2-scale.
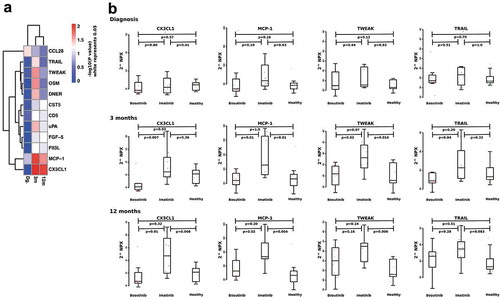
At diagnosis, the patients had significantly higher amounts of uPA (p = .0001), OSM (p = .00004), CD5 (p = .0002) and Flt3L (p = .03) compared to the healthy controls (). While comparing the patient groups and healthy controls, we observed that at 3 months, imatinib significantly increased the amount of soluble CXC3L1 (p = .007 compared to BO, p = .3 compared to healthy). CX3CL1 continued to increase in imatinib patients after 12 months of treatment (p = .01 compared to BO, p = .07 compared to healthy). At diagnosis, CX3CL1 levels were similar in the imatinib and bosutinib groups (p = .80). In contrast, MCP-1 was slightly higher at diagnosis in those patients who started on imatinib treatment (median for imatinib 586.7 and for bosutinib 370.4, p = .10), and although MCP-1 levels increased during both treatments, imatinib patients had still higher levels at 3 months (p = .01 compared to BO, p = .01 compared to healthy) and at 12 months (p = .02 compared to BO, p = .004 compared to healthy). Also, TWEAK increased during both TKIs, with a steeper rise during imatinib (at 3 months; p = .02 compared to BO, p = .01 compared to healthy; at 12 months p = .16 compared to BO, p = .006 compared to healthy) treatment. Similar results were observed with TRAIL (at 3 months; p = .04 compared to BO, p = .3 compared to healthy; at 12 months p = .28 compared to BO, p = .08 compared to healthy) (, , supplemental Figure 4). No differences at diagnosis were observed for TWEAK and TRAIL when comparing the two patient cohorts (p = .44 and 0.50).
Table 3. Protein levels were expressed as Normalized Protein eXpression (NPX) values, an arbitrary unit on log2-scale, and shown here as median values for each studied group.
Figure 4. Differences of plasma protein at diagnosis and during TKI therapy. A p-value heatmap presenting significant differences between imatinib- and bosutinib-treated patients’ plasma proteins (a). Imatinib-treated patients have a significant increase in MCP-1, CX3CL1. TWEAK and TRAIL at both 3-month and 12-month time-points (b). Non-parametric Wilcoxon signed-ranked test was performed to compare differences between treatments and data are presented as boxplots. Protein levels are expressed as Normalized Protein eXpression (NPX) values, an arbitrary unit on log2-scale.
Unsupervised clustering reveals distinct patient subsets
Different immune cell subclasses were clustered with unsupervised hierarchical clustering to detect specific cell phenotypes that associate with each other or with clinical factors such as Sokal risk score, BCR-ABL IS% and study drug. All data were normalized to diagnosis median values, in order to visualize treatment-induced changes for each parameter.
At diagnosis, three distinct patient subgroups were formed. Interestingly, the majority of low Sokal risk patients clustered based on the low levels of terminally differentiated effector CD8 + T cells, CD57+ CD8 + T cells (same as seen in )) and GrB+ CD8 + T cells (highlighted in ). The same sets of CD8 + T cells clustered together also at 3 and 12-month time-points. At 12 months, a cluster including mostly (6/7) imatinib-treated patients was formed based on the increased amount of the same CD8 + T cell populations (highlighted in ). In addition, one patient who was randomized to bosutinib arm but switched to imatinib due to side-effects already before the 3-month time-point was in the same cluster with the imatinib patients (Bo8, marked with an asterisk in the annotation).
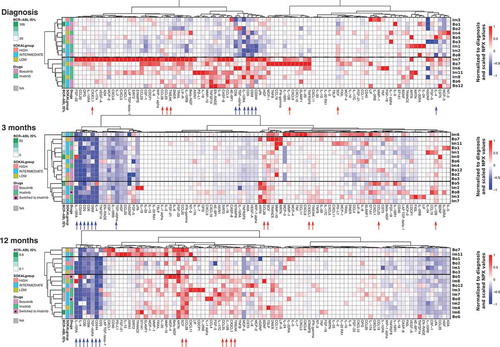
Figure 5. Unsupervised hierarchical clustering of immune cell subsets. Flow cytometry data for each timepoint were normalized to diagnosis median values and heatmap was drawn based on Euclidean distance and unsupervised hierarchical clustering methods for each timepoint independently. Annotations were added for Sokal risk at diagnosis, BCR-ABL IS% at each timepoint and study drug. Low Sokal risk patients at diagnosis clustered based on terminally differentiated effector CD8 + T cells, CD57+ CD8 + T cells and GrB+ CD8 + T cells, which are highlighted in each heatmap. At 12-month time-point, the majority of imatinib-treated patients cluster based on their T and NK cells phenotypes. Patients who started on bosutinib and switched to imatinib treatment during the 12-month follow up are marked with an asterisk.
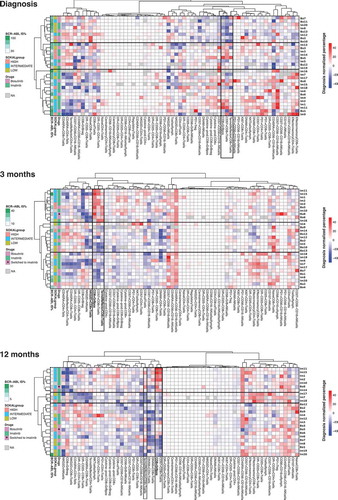
Same unsupervised clustering analysis, with 3 m and 12 m results normalized to diagnosis median values, was performed with the plasma proteins at each timepoint. Notably, cytokine profiles at diagnosis divided patients into two distinct subgroups (). Interestingly, the median BCR-ABL IS% clearly differed between the two clusters at diagnosis (34.1 vs. 80.4). The cluster with higher BCR-ABL IS% levels had increased amount of several different cytokines. At 12 months, a distinct cluster of 10 patients was formed by 6 imatinib-treated patients and two bosutinib-treated patients who had switched to imatinib before the sampling (marked with asterisk in the annotation in ). In addition, a group of soluble plasma proteins clearly decreased after TKI start, namely CD5, CD6, CD244, OSM, IL-10RA, IL-4, and TGF-alpha (marked with blue arrows). In contrast, CCL28, SCF, TWEAK, CX3CL1, IL-12B, and CCL25 (marked with red arrows) markedly increased after TKI start ().
Figure 6. CML patients with high BCR-ABL IS% at diagnosis have distinct soluble plasma protein and receptor profile. Soluble plasma proteins were calculated as NPX values at diagnosis and after therapy start. All data were normalized to baseline median values, in order to visualize treatment-induced changes in each parameter. Heatmap analysis was performed including Euclidean distance and unsupervised hierarchical clustering methods for each timepoint independently, and annotations were added for Sokal risk at diagnosis, BCR-ABL IS% at each timepoint and study drug. At diagnosis, two clusters with different BCR-ABL IS% (median values 34.1 and 80.4) are observed with distinctive plasma protein profiles. After the therapy start, a group of soluble proteins and receptors clearly decreased after TKI start, namely CD5, CD6, CD244, OSM, IL-10RA, IL-4, and TGF-alpha (marked with blue arrows). On the contrary, CCL28, SCF, TWEAK, CX3CL1, IL-12B, and CCL25 (marked with red arrows) prominently increased after TKI start. Patients who started on bosutinib and switched to imatinib treatment during the 12-month follow up are marked with an asterisk.
Normal blood counts are achieved faster in bosutinib-treated patients
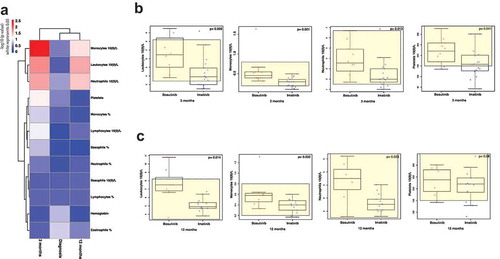
Complete blood counts (percentages and absolute counts) were compared between the two groups of patients at diagnosis, and then at 3 and 12 months. No differences were observed in between the groups at diagnosis, but at 3 months after therapy start, bosutinib-treated patients had significantly higher absolute numbers of leukocytes (p = .009), monocytes (p = .001), neutrophils (p = .013) and platelets (p = .041) (), whereas in some imatinib-treated patients the blood counts were below the lower normal limit. Further at 12 months, the leukocytes (p = .014), monocytes (p = .032) and neutrophils (p = .022) were still significantly higher in the bosutinib group (). No significant differences were observed in the percentage or absolute counts of lymphocytes between the two groups at either time-point ()).
Figure 7. Normal blood cell values are faster re-established during bosutinib-treatment. A p-value heatmap presenting significant differences between imatinib- and bosutinib-treated patients’ complete blood counts (a). At diagnosis, no differences were observed between the two groups of patients. Three months after therapy start, bosutinib-patients have higher absolute numbers of neutrophils, monocytes, platelets, and leukocytes (b). The same differences were observed also after 12 months of treatment (c). Non-parametric Wilcoxon signed-ranked test was performed to compare differences between treatments and data are presented as boxplots, showing the median value of each parameter.
No changes were observed in the blood cell counts after imatinib or bosutinib intake
The second-generation TKI, dasatinib, is known to induce a rapid mobilization of lymphocytes to the peripheral blood after drug intake.Citation22 In order to study whether similar changes would occur after imatinib or bosutinib intake, differential blood counts were taken before and after 2 h of drug intake at 3- and 12-month time-points. In contrast to what was observed in dasatinib-treated CML patients, no significant changes were observed in the hemoglobin and the absolute blood cell counts (leukocytes, erythrocytes, platelets, neutrophils, eosinophils, basophils or lymphocytes; supplemental Figure 5). A significant increase was observed only in the absolute monocyte counts (p = .027) at 3 months, and absolute neutrophil counts (p = .0029) at 12 months after imatinib admission (supplemental Figure 5).
Discussion
In principle, the immunological off-target effects of TKIs may improve or impair the overall therapy outcome in CML patients.Citation23 The immune system, notably NK cells, has recently been linked with successful treatment discontinuation.Citation5,Citation6,Citation20,Citation21 Therefore, several groups have lately attempted to understand the immunological effects of TKIs in CML patients and their impact on therapy responses. Especially, the SRC family of kinases and other signaling pathways involved in cellular activity of the immune system may play an important role for secondary, immune-mediated effects of TKIs. Still, no longitudinal studies have been performed to characterize the immunomodulatory effects of first-line imatinib and bosutinib in CP CML patients and how these changes correlate with the remaining disease burden.
Two large phase III clinical trials, BELA (NCT00574873) and BFORE (NCT02130557), have recently shown that bosutinib is superior to imatinib in the first-line setting regarding MMR rate at 12 months. Also, the complete cytogenetic response rate at 12 months was significantly higher in the bosutinib arms.Citation24–Citation26 These results are likely to be explained by bosutinib´s higher activity against BCR-ABL and various imatinib-resistant mutations.Citation27 Bosutinib also has a wider TK inhibitory profile than imatinib and thus more resembles dasatinib, another second-generation TKI, in the sense that for example, both inhibit the SRC kinase family.Citation7,Citation8 Interestingly, previous reports from our group and others have shown significant immunomodulatory effects of dasatinib.Citation5,Citation9–Citation15,Citation22 With this in mind, it is surprising that we did not detect immunomodulatory effects in the bosutinib-treated CML patients. In contrast, we observed that imatinib treatment induced multiple immunological changes. As seen in our study cohort as well as in the clinical trials, imatinib treatment resulted in slower therapy responses and recovery of the bone marrow, while bosutinib-treated patients mostly achieved quicker therapy responses and faster regain of normal bone marrow functions. We are not able to exclude the possibility that because bosutinib causes faster therapy responses, there is no need for the immune system to activate and clear remaining leukemic cells. In contrast, slower therapy responses induced by imatinib could leave time for the immune system to act after the initial immune suppression observed at diagnosis is reverted.Citation28 However, although dasatinib induces a more rapid molecular response than imatinib, significant immunological changes are observed during the treatment.Citation10 Therefore, it is also possible that imatinib has direct immunological effects in CML similarly as shown in gastrointestinal stromal tumors and neuroblastoma patients.Citation13,Citation17,Citation29
The initial fraction of leukemic stem cells at diagnosis is known to have an impact on the overall therapy outcome, Citation30,Citation31 but also on the immune system, causing significant malfunction and suppression of the lymphocytes in CML patients.Citation28,Citation32–Citation34 High Sokal risk CML patients have also been reported to have higher numbers of myeloid-derived suppressor and PD1-expressing CD8 + T cells.Citation35 In accordance, we show here, that patients with low and intermediate Sokal risk scores have more active immune systems compared to those in the high-risk category. This was particularly true for NK cells, which were more frequent and also had a superior cytotoxic potential in the low risk compared to the high-risk patients. Interestingly, recent papers published by us and others have described an important role for NK cells in achieving a deep molecular response and the successful discontinuation of imatinib treatment.Citation5,Citation6,Citation21,Citation36 Ilander et al. have shown that the proportion of NK cells was associated with molecular relapse-free survival as patients with a higher NK-cell percentage at the time of drug discontinuation had a better probability of staying in remission. In addition, Hughes et al. have recently reported that the quantitative and functional defects of NK cells were observed at diagnosis, and later, those patients who were in MMR and MR4.5 had acquired more mature, cytolytic CD57+ CD62L-NK cell.Citation36 Interestingly, our present results show that both the percentage and the cytotoxic potential of the NK cells increased especially in the imatinib-treated patients, while bosutinib did not significantly affect the NK-cell frequency or their function.
Cytokines are small proteins that are important for cell-cell signaling and therefore, they represent useful readouts to study changes in the immune system. In our CML cohort, we found that imatinib treatment led to elevated levels of several soluble proteins in the plasma, whereas bosutinib had minor effects. The most drastic differences between the two patient groups were observed at 3 months. TRAIL, TWEAK, CX3CL1, and MCP1 were significantly increased during imatinib treatment. These plasma proteins are either key players in cytotoxic pathways or function as chemoattractants for T cells among other cell types. Inflammatory cytokines belonging to tumor necrosis factor (TNF) family, such as TRAIL and TWEAK, are able to induce apoptosis in cancer cells while exhibiting little or no toxicity in normal cells.Citation37 Moreover, members of the TNF superfamily provide a communication complex that is essential in synchronizing multiple cell types into an effective host defense system against malignant cells. These pathways differentiate both innate and adaptive immune cells, and modulate stromal cells into microenvironments that are conducive to host defenses.Citation38
Chemokines on the other hand induce chemotaxis in responsive cells. We observed that CX3CL1 levels in particular increased during imatinib treatment. CX3CL1 and its cognate receptor CX3CR1 are involved in the recruitment of leukocytes to the inflamed vasculature.Citation39 CXC3L1 also induces active migration of NK cells and by blocking the CX3CL1/CXCR3 pathway it has been shown that the NK cells no longer were able to clear the cancer cells in a mouse tumor model.Citation40 We conclude that these elevated cytokine levels reflect an active immune system in the imatinib-treated patients, affecting mainly the NK cells, and this is also observed as an increased NK-cell percentage in these patients. Moreover, our analysis revealed that leukemic cell burden (as reflected by BCR-ABL IS%) during the treatment time correlated positively with several plasma proteins such as CCL4, CXCL1, CXCL5, CXCL6, CXCL10, CCL28, CX3CL1, IL-10RA, Flt3L, ST1A1, and TNF.
In conclusion, the disease burden, including both Sokal risk at diagnosis and BCR-ABL IS% during treatment, correlates with multiple immunological factors, providing further insight into the role of the immune system in CML. In addition, we observed that imatinib treatment generated a more active immune system, which correlated with the BCR-ABL IS%. In contrast, no clear immunomodulatory effects were detected during bosutinib treatment, despite the wide kinase inhibition profile of the drug. We conclude that the immune system in CML patients with a low disease burden is more active and has a higher functional capacity than in patients with a higher disease load.
Patients and methods
Study patients and samples
Newly diagnosed CP CML patients were enrolled in the BFORE clinical trial (NCT02130557). Peripheral blood samples were obtained from imatinib- (n = 20) and bosutinib-treated (n = 13) patients at diagnosis (dg), as well as 3 and 12 months after the start of TKI therapy. Moreover, differential blood counts were taken before and 2-h post drug intake at 3 and 12 months to examine the direct effects of the drug intake on lymphocyte counts.Citation22 Peripheral blood mononuclear cells (PB MNCs) from all patients and healthy controls were separated by Ficoll-Paque gradient centrifugation (GE Healthcare, Buckingham, UK) and were freshly used or stored as live vials at −150°C.
All patients and healthy controls gave a written informed consent and the study was approved by the ethical committees of each local university hospital. The study was conducted in accordance with the Declaration of Helsinki.
Phenotyping
PB MNC were isolated with Ficoll from fresh blood and the cells were immediately stained for 15 min with surface markers (CD3, CD4, CD8, CD14 (Invitrogen), CD16, CD19 (Invitrogen), CD25, CD27, CD38, CD45, CD45RA, CD56, CD57, CCR7 (RnD), HLA-DR, NKG2D, and PD1). Intracellular stains using FoxP3 (eBioscience) and Ki-67 antibodies were performed after permeabilizing the cells with the Transcription Factor Staining Buffer Set (eBioscience). A total of 50 000 lymphocytes were acquired with the FACS Verse and analyzed with FlowJo (Version 10.0.8r1, TreeStar) software. Dead cells were removed from analysis from SSC vs FSC and CD45 scatter. All antibodies were purchased from BD Biosciences (BD Biosciences, San Diego, CA, USA) unless mentioned otherwise.
NK-cell degranulation assay
Thawed PB MNCs were stimulated with the target cell line K562 at a 10:1 ratio. PB MNCs without target cells were used as negative controls. Cells were incubated for 6 h in the presence of antibodies containing degranulation markers, CD107a and CD107b. All cells were stained with CD45, CD3, CD16, and CD56. 50,000 CD45+ lymphocytes were acquired with FACS Verse and analyzed with FlowJo.
Activation of T-cells
Thawed PB MNCs were stimulated with anti-CD3 (2.5 μg/ml), co-stimulatory anti-CD28 (1 μg/ml), anti-CD49d (0.5 μg/ml) (BD Biosciences), and incubated for 6 h at +37°C. PB MNCs without stimulation were used as controls. GolgiStop (BD Biosciences) was added to each well. After the incubation, cells were stained with the following antibodies: CD45, CD3, CD4, CD8. Subsequently, cells were permeabilized and fixed according to the Cytofix Cytoperm (BD Biosciences) kit protocol. Intracellular stains were carried out with Granzyme B, and the cytokines IFN-γ and TNF-α, whereby 50 000 CD45+ lymphocytes were analyzed with FACS Verse.
Soluble plasma protein and receptor analysis by multiplex immunoassay
ACD plasma samples from 8 imatinib-treated, 8 bosutinib-treated patients (all time-points), and 10 healthy volunteers (6 females, 4 males, mean age 51.7 years) were analyzed using the Proseek® Multiplex Inflammation immunoassay. Proseek® is a high-throughput, multiplex immunoassay that enables the analysis of 92 inflammation-related protein biomarkers simultaneously (Proseek Multiplex CVD, Olink Bioscience, Uppsala, Sweden). Protein levels were expressed as Normalized Protein eXpression (NPX) values, an arbitrary unit on log2-scale.
Statistical analysis
For heatmaps, in the case of plasma protein data, the values measured in the patients were normalized using the plasma protein levels in healthy controls and scaled between −1 and +1. The Euclidean distance and complete clustering methods were used for the heatmap of both flow cytometry results and plasma protein data heatmap. The differences between the groups were analyzed using the non-parametric Wilcoxon signed-ranked test. The correlation between the data sets was computed using the Spearman rank correlation method.
Supplemental Material
Download Zip (262.1 KB)Acknowledgments
The authors would like to thank patients, study nurses, and other personnel in the clinical centers for their participation in this project.
Disclosure statement
PK has received honoraria from Novartis, BMS, Ariad, and Pfizer. UOS has received honoraria from Ariad. JR has received honoraria and research funding from Novartis and Bristol-Myers Squibb and honoraria from Ariad. HHjH has received honoraria from Pfizer, Novartis, Bristol-Myers Squibb, and Incyte. SM has received honoraria and research funding from Novartis, Bristol-Myers Squibb, Ariad, and Pfizer.
Supplementary material
Supplemental data for this article can be accessed on the publisher’s website.
Additional information
Funding
References
- Pasic I, Lipton JH. Current approach to the treatment of chronic myeloid leukaemia. Leukemia Res. 2017;55:65–78. doi:10.1016/j.leukres.2017.01.005.
- Rosti G, Castagnetti F, Gugliotta G, Baccarani M. Tyrosine kinase inhibitors in chronic myeloid leukaemia: which, when, for whom? Nat Rev Clin Oncol. 2017;14(3):141–154. doi:10.1038/nrclinonc.2016.139.
- Kennedy JA, Hobbs G. Tyrosine kinase inhibitors in the treatment of chronic-phase CML: strategies for frontline decision-Making. Curr Hematologic Malignancy Rep. 2018;13(3):202–211. doi:10.1007/s11899-018-0449-7.
- Kantarjian HM, Cortes JE, Kim DW, Khoury HJ, Brummendorf TH, Porkka K, Martinelli G, Durrant S, Leip E, Kelly V, et al. Bosutinib safety and management of toxicity in leukemia patients with resistance or intolerance to imatinib and other tyrosine kinase inhibitors. Blood. 2014;123(9):1309–1318. doi:10.1182/blood-2013-07-513937.
- Ilander M, Olsson-Stromberg U, Schlums H, Guilhot J, Bruck O, Lahteenmaki H, Kasanen T, Koskenvesa P, Söderlund S, Höglund M, et al. Increased proportion of mature NK cells is associated with successful imatinib discontinuation in chronic myeloid leukemia. Leukemia. 2017;31(5):1108–1116. doi:10.1038/leu.2016.360.
- Rea D, Henry G, Khaznadar Z, Etienne G, Guilhot F, Nicolini F, Guilhot J, Rousselot P, Huguet F, Legros L, et al. Natural killer-cell counts are associated with molecular relapse-free survival after imatinib discontinuation in chronic myeloid leukemia: the IMMUNOSTIM study. Haematologica. 2017;102(8):1368–1377. doi:10.3324/haematol.2017.165001.
- Hantschel O, Rix U, Superti-Furga G. Target spectrum of the BCR-ABL inhibitors imatinib, nilotinib and dasatinib. Leukemia & Lymphoma. 2008;49(4):615–619. doi:10.1080/10428190801896103.
- Remsing Rix LL, Rix U, Colinge J, Hantschel O, Bennett KL, Stranzl T, Müller A, Baumgartner C, Valent P, Augustin M, et al. Global target profile of the kinase inhibitor bosutinib in primary chronic myeloid leukemia cells. Leukemia. 2009;23(3):477–485. doi:10.1038/leu.2008.334.
- Kreutzman A, Ladell K, Koechel C, Gostick E, Ekblom M, Stenke L, Melo T, Einsele H, Porkka K, Price DA, et al. Expansion of highly differentiated CD8+ T-cells or NK-cells in patients treated with dasatinib is associated with cytomegalovirus reactivation. Leukemia. 2011;25(10):1587–1597. doi:10.1038/leu.2011.135.
- Kreutzman A, Ilander M, Porkka K, Vakkila J, Mustjoki S. Dasatinib promotes Th1-type responses in granzyme B expressing T-cells. Oncoimmunology. 2014;3:e28925. doi:10.4161/onci.28925.
- Salih J, Hilpert J, Placke T, Grunebach F, Steinle A, Salih HR, Krusch M. The BCR/ABL-inhibitors imatinib, nilotinib and dasatinib differentially affect NK cell reactivity. Int J Cancer. 2010;127(9):2119–2128. doi:10.1002/ijc.25233.
- Kreutzman A, Porkka K, Mustjoki S. Immunomodulatory effects of Tyrosine Kinase Inhibitors. Int Trends Immun. 2013;01:22–33.
- Balachandran VP, Cavnar MJ, Zeng S, Bamboat ZM, Ocuin LM, Obaid H, Sorenson EC, Popow R, Ariyan C, Rossi F, et al. Imatinib potentiates antitumor T cell responses in gastrointestinal stromal tumor through the inhibition of Ido. Nat Med. 2011;17(9):1094–1100. doi:10.1038/nm.2438.
- Hayashi Y, Nakamae H, Katayama T, Nakane T, Koh H, Nakamae M, Hirose A, Hagihara K, Terada Y, Nakao Y, et al. Different immunoprofiles in patients with chronic myeloid leukemia treated with imatinib, nilotinib or dasatinib. Leukemia & Lymphoma. 2012;53(6):1084–1089. doi:10.3109/10428194.2011.647017.
- Rohon P, Porkka K, Mustjoki S. Immunoprofiling of patients with chronic myeloid leukemia at diagnosis and during tyrosine kinase inhibitor therapy. Eur J Haematol. 2010;85(5):387–398. doi:10.1111/j.1600-0609.2010.01501.x.
- Zitvogel L, Rusakiewicz S, Routy B, Ayyoub M, Kroemer G. Immunological off-target effects of imatinib. Nat Rev Clin Oncol. 2016;13(7):431–446. doi:10.1038/nrclinonc.2016.41.
- Bellora F, Dondero A, Corrias MV, Casu B, Regis S, Caliendo F, Moretta A, Cazzola M, Elena C, Vinti L, et al. Imatinib and nilotinib off-target effects on human NK cells, monocytes, and M2 macrophages. J Immunol. 2017;199(4):1516–1525. doi:10.4049/jimmunol.1601695.
- Steegmann JL, Baccarani M, Breccia M, Casado LF, Garcia-Gutierrez V, Hochhaus A, Kim D-W, Kim TD, Khoury HJ, Le Coutre P, et al. European LeukemiaNet recommendations for the management and avoidance of adverse events of treatment in chronic myeloid leukaemia. Leukemia. 2016;30(8):1648–1671. doi:10.1038/leu.2016.104.
- Romero P, Zippelius A, Kurth I, Pittet MJ, Touvrey C, Iancu EM, Corthesy P, Devevre E, Speiser DE, Rufer N. Four functionally distinct populations of human effector-memory CD8+ T lymphocytes. J Immunol. 2007;178(7):4112–4119. doi:10.4049/jimmunol.178.7.4112.
- Ilander M, Kreutzman A, Rohon P, Melo T, Faber E, Porkka K, Vakkila J, Mustjoki S, Speletas M. Enlarged memory T-cell pool and enhanced Th1-type responses in chronic myeloid leukemia patients who have successfully discontinued IFN-alpha monotherapy. PLoS One. 2014;9(1):e87794. doi:10.1371/journal.pone.0087794.
- Imagawa J, Tanaka H, Okada M, Nakamae H, Hino M, Murai K, Ishida Y, Kumagai T, Sato S, Ohashi K, et al. Discontinuation of dasatinib in patients with chronic myeloid leukaemia who have maintained deep molecular response for longer than 1 year (DADI trial): a multicentre phase 2 trial. Lancet Haematol. 2015;2(12):e528–35. doi:10.1016/S2352-3026(15)00196-9.
- Mustjoki S, Auvinen K, Kreutzman A, Rousselot P, Hernesniemi S, Melo T, Lahesmaa-Korpinen A-M, Hautaniemi S, Bouchet S, Molimard M, et al. Rapid mobilization of cytotoxic lymphocytes induced by dasatinib therapy. Leukemia. 2013;27(4):914–924. doi:10.1038/leu.2012.348.
- Ilander M, Mustjoki S. Immune control in chronic myeloid leukemia. Oncotarget. 2017;8(61):102763–102764. doi:10.18632/oncotarget.22279.
- Isfort S, Brummendorf TH. Bosutinib in chronic myeloid leukemia: patient selection and perspectives. J Blood Med. 2018;9:43–50. doi:10.2147/JBM.S129821.
- Cortes JE, Kim DW, Kantarjian HM, Brummendorf TH, Dyagil I, Griskevicius L, Malhotra H, Powell C, Gogat K, Countouriotis AM, et al. Bosutinib versus imatinib in newly diagnosed chronic-phase chronic myeloid leukemia: results from the BELA trial. J Clin Oncol. 2012;30(28):3486–3492. doi:10.1200/JCO.2011.38.7522.
- Cortes JE, Gambacorti-Passerini C, Deininger MW, Mauro MJ, Chuah C, Kim DW, Dyagil I, Glushko N, Milojkovic D, le Coutre P, et al. Bosutinib versus imatinib for newly diagnosed chronic myeloid leukemia: results from the randomized BFORE Trial. J Clin Oncol. 2018;36(3):231–237. doi:10.1200/JCO.2017.74.7162.
- Redaelli S, Piazza R, Rostagno R, Magistroni V, Perini P, Marega M, Gambacorti-Passerini C, Boschelli F. Activity of bosutinib, dasatinib, and nilotinib against 18 imatinib-resistant BCR/ABL mutants. J Clin Oncol. 2009;27(3):469–471. doi:10.1200/JCO.2008.19.8853.
- Bruck O, Blom S, Dufva O, Turkki R, Chheda H, Ribeiro A, Kovanen P, Aittokallio T, Koskenvesa P, Kallioniemi O, et al. Immune cell contexture in the bone marrow tumor microenvironment impacts therapy response in CML. Leukemia. 2018;32(7):1643–1656. doi:10.1038/s41375-018-0175-0.
- Calafiore L, Amoroso L, Della Casa Alberighi O, Luksch R, Zanazzo G, Castellano A, Podda M, Dominici C, Haupt R, Corrias MV, et al. Two-stage phase II study of imatinib mesylate in subjects with refractory or relapsing neuroblastoma. Ann Oncol. 2013;24(5):1406–1413. doi:10.1093/annonc/mds648.
- Mustjoki S, Richter J, Barbany G, Ehrencrona H, Fioretos T, Gedde-Dahl T, Gjertsen BT, Hovland R, Hernesniemi S, Josefsen D, et al. Impact of malignant stem cell burden on therapy outcome in newly diagnosed chronic myeloid leukemia patients. Leukemia. 2013;27(7):1520–1526. doi:10.1038/leu.2013.19.
- Thielen N, Richter J, Baldauf M, Barbany G, Fioretos T, Giles F, Gjertsen B-T, Hochhaus A, Schuurhuis GJ, Sopper S, et al. leukemic stem cell quantification in newly diagnosed patients with chronic myeloid leukemia predicts response to nilotinib therapy. Clin Cancer Res. 2016;22(16):4030–4038. doi:10.1158/1078-0432.CCR-15-2791.
- Hughes A, Yong ASM. Immune effector recovery in chronic myeloid leukemia and treatment-free remission. Front Immunol. 2017;8:469. doi:10.3389/fimmu.2017.00469.
- Lindau D, Gielen P, Kroesen M, Wesseling P, Adema GJ. The immunosuppressive tumour network: myeloid-derived suppressor cells, regulatory T cells and natural killer T cells. Immunology. 2013;138(2):105–115. doi:10.1111/imm.12036.
- Mellqvist UH, Hansson M, Brune M, Dahlgren C, Hermodsson S, Hellstrand K. Natural killer cell dysfunction and apoptosis induced by chronic myelogenous leukemia cells: role of reactive oxygen species and regulation by histamine. Blood. 2000;96:1961–1968.
- Christiansson L, Soderlund S, Svensson E, Mustjoki S, Bengtsson M, Simonsson B, Olsson-Strömberg U, Loskog ASI, Das G. Increased level of myeloid-derived suppressor cells, programmed death receptor ligand 1/programmed death receptor 1, and soluble CD25 in Sokal high risk chronic myeloid leukemia. PLoS One. 2013;8(1):e55818. doi:10.1371/journal.pone.0055818.
- Hughes A, Clarson J, Tang C, Vidovic L, White DL, Hughes TP, Yong ASM. CML patients with deep molecular responses to TKI have restored immune effectors and decreased PD-1 and immune suppressors. Blood. 2017;129(9):1166–1176. doi:10.1182/blood-2016-10-745992.
- Mahalingam D, Szegezdi E, Keane M, de Jong S, Samali A. TRAIL receptor signalling and modulation: are we on the right TRAIL? Cancer Treat Rev. 2009;35(3):280–288. doi:10.1016/j.ctrv.2008.11.006.
- Ward-Kavanagh LK, Lin WW, Sedy JR, Ware CF. The TNF receptor superfamily in co-stimulating and co-inhibitory responses. Immunity. 2016;44(5):1005–1019. doi:10.1016/j.immuni.2016.04.019.
- Green SR, Han KH, Chen Y, Almazan F, Charo IF, Miller YI, Quehenberger O. The CC chemokine MCP-1 stimulates surface expression of CX3CR1 and enhances the adhesion of monocytes to fractalkine/CX3CL1 via p38 MAPK. J Immunol. 2006;176(12):7412–7420. doi:10.4049/jimmunol.176.12.7412.
- Robinson LA, Nataraj C, Thomas DW, Cosby JM, Griffiths R, Bautch VL, Patel DD, Coffman TM. The chemokine CX3CL1 regulates NK cell activity in vivo. Cell Immunol. 2003;225:122–130.