
ABSTRACT
Anti-PD-1 antibody therapy has achieved success in tumor treatment; however, the duration of its clinical benefits are typically short. The functional state of intratumoral CD8+ T cells substantially affects the efficacy of anti-PD-1 antibody therapy. Understanding how intratumoral CD8+ T cells change will contribute to the improvement in anti-PD-1 antibody therapy. In this study, we found that tumor growth was not arrested after the late administration of anti-PD-1 antibody and that the antitumor function of CD8+ T cells decreased with tumor progression. The results of the RNA sequencing of CD8+ T cells infiltrating the tumor site on days 7 and 14 showed that the cell adhesion molecule Lymphocyte Function-associated Antigen-1 (LFA-1) participates in regulating the antitumor function of CD8+ T cells and that decreased LFA-1 expression in intratumoral CD8+ T cells is associated with tumor progression. By analyzing the Gene Expression Omnibus (GEO) database and our results, we found that the antitumor function of intratumoral CD8+ T cells with high LFA-1 expression was stronger. The formation of immune synapses is impaired in Itgal-si CD8+ T cells, resulting in decreased anti-tumor function. LFA-1 expression in intratumoral CD8+ T cells is regulated by the IL-2/STAT5 pathway. The combination of IL-2 and anti-PD-1 antibody effectively enhanced LFA-1 expression and the antitumor function of intratumoral CD8+ T cells. The adoptive transfer of OT-1 T cells overexpressing LFA-1, STAT5A, or STAT5B resulted in higher antitumor function, deferred tumor growth, and prolonged survival. These findings indicate that LFA-1-mediated immune synapse acts as a regulator of the antitumor function of intratumoral CD8+ T cells, which can be applied to improve anti-PD-1 antibody therapy.
Introduction
Immune checkpoint blockade (ICB) therapy is approved for the treatment of several types of cancer. However, not all patients respond to ICB therapy.Citation1–4 CD8+ T cells experience dysfunction in the tumor microenvironment (TME), with continuously stimulated by antigens and various inhibitory factors in the TME, lose effector cytokine production and proliferation potential, and gradually increase the expression of inhibitory receptors, such as PD-1, LAG-3 and TIM-3, eventually leads to resistance to ICB immunotherapy in late cancer stages.Citation5–8 Recently, it has been reported that CD8+ T cells with high expression of T-cell factor 1 (TCF-1), massively amplified after anti-PD-1 therapy.Citation9 It has also been reported that tumor-specific CXCL13+ CD8+ T cells were significantly enriched in tumors that responded to ICB and increased significantly after effective treatment, indicating that tumor-specific CXCL13+ CD8+ T cells play a key role in the treatment process.Citation10 However, given the complexity of tumor immune ineffectiveness, we have to further explore the reasons for tumor immunotherapy failure.
As a T-cell growth factor, interleukin-2 (IL-2) can regulate T-cell proliferation and differentiation.Citation11 IL-2 regulates the developmental signaling and antitumor ability of T cells by regulating the serine phosphorylation of STAT5.Citation12–14 High-dose IL-2 therapy has been approved for treating metastatic melanoma and kidney cancer. However, the limited observed patient benefits and high systemic targeted toxicity have prevented their widespread application.Citation15,Citation16 However, the application and specific mechanism effect of IL-2 in solid tumors still require further investigation.
T cell-mediated cancer killing is dependent on the formation of immune synapses (ISs).Citation17 The IS is a specialized cell – cell junction between a T cell and its target cell and is the fundamental process underlying T-cell activation and function.Citation18 The formation of an IS requires the interaction of a T-cell receptor (TCR) with a peptide-loaded major histocompatibility complex-I (pMHC-I) as a central supramolecular activation cluster (cSMAC).Citation19 Additionally, leukocyte-function-associated antigen 1 (LFA-1) is indispensable for IS formation in peripheral SMAC (pSMAC).Citation20 LFA-1 is a type of integrin that is constitutively expressed in leukocytes and contributes to T-cell migration, differentiation, and effector functions. However, how LFA-1 changes the tumor microenvironment during late-stage cancer and its relationship with ICB resistance remain unknown.
In this study, we observed that LFA-1 expression and IS formation were impaired in late-stage tumors in a mouse model. We identified that the IL-2/STAT5 signaling pathways were involved in this process. Furthermore, the overexpression of LFA-1 or STAT5 in CD8+ T cells can increase the antitumor efficacy of adoptive transfer therapy. In addition, IL-2 treatment to increase LFA-1 expression synergistically achieved PD-1 blockade therapy at both the early and late tumor stages. The relationship between LFA-1 expression and the efficacy of PD-1 blockade therapy was also demonstrated in patients with cancer.
Results
Tumor growth not arrested after late administration of anti-PD-1 antibody
Although anti-PD-1 therapy has shown clinical efficacy, some patients remain resistant in clinical practice.Citation21,Citation22 In this study, we aimed to evaluate the antitumor effects of an anti-PD-1 antibody in a mouse model. First, B16 and LLC tumor-bearing mouse models were constructed. Anti-PD-1 antibody was administered on days 7 (D7) and 14 (D14) after tumor progression. In the B16 tumor model, tumor growth substantially decreased and survival time was prolonged after early administration of anti-PD-1 antibody (D7), whereas tumor growth did not decrease and survival time did not increase after late administration of anti-PD-1 antibody (D14) (). Similar phenomena were observed in the LLC tumor model (). CD8+ T cells are the major antitumor cells whose function can be rescued by anti-PD-1 antibody.Citation23,Citation24 Hence, we speculated that CD8+ T cells infiltrating the D14 tumor would exhibit exhaustion signatures, resulting in a nonresponse to anti-PD-1 antibody treatment. The expression of cytotoxic cytokines, activated and coinhibitory markers in B16-tumor-infiltrating CD8+ T cells at D7 and D14, was evaluated. We found that the secretion of IFN-γ and TNF-α significantly decreased in the CD8+ T cells that infiltrated the tumor on D7 compared with on D14 (). In addition, the proliferation of intratumoral CD8+ T cells on D7 was higher than on D14 (). We also detected the activated and coinhibitory markers of CD8+ T cells and found that compared with intratumoral CD8+ T cells on D14, CD8+ T cells on D7 showed higher expression of the activated marker CD69 and lower expressions of coinhibitory markers, including PD-1, Tim3, and LAG3 ().
Figure 1. Tumor growth was not arrested after late administration of anti-PD-1 antibody.
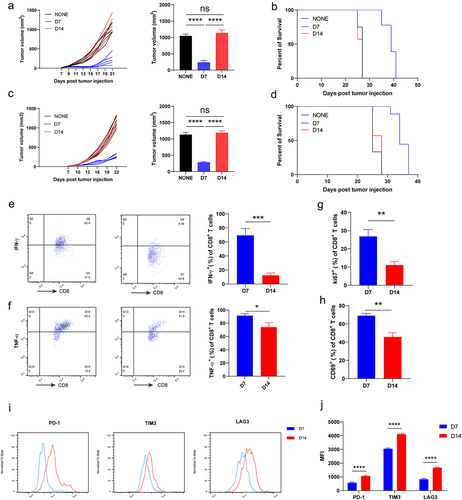
We also evaluated the function, activation, and proliferation of intratumoral CD8+ T cells in LLC tumors. The results showed that the CD8+ T cells that infiltrated the tumor on D7 exhibited higher expression of cytotoxic cytokines (IFN-γ and TNF-α), activation marker CD69, and proliferation marker Ki67 (Supplementary Fig. S1A-D). In addition, tumor-infiltrating CD8+ T cells on D7 expressed lower levels of coinhibitory markers (PD-1, Tim3, and LAG3) compared with intertumoral CD8+ T cells on D14 (Supplementary Fig. S1E and S1F). Taken together, these results indicate that the antitumor function of CD8+ T cells decreases with tumor progression.
LFA-1 expression on intratumoral CD8+ T cells decreased with tumor progression
To investigate the underlying regulatory mechanism mediating late-stage intratumoral T-cell dysfunction, we prepared CD8+ T cells infiltrating the tumor site on D7 and D14 and performed RNA sequencing (RNA-seq). Principal component analysis (PCA) was conducted, and the results showed that the features of CD8+ T cells infiltrated in tumor site at D7 and D14 were completely different (). The genes of the CD8+ T cells that differed between D7 and D14 were analyzed and used for pathway enrichment analysis (). The results of a Kyoto Encyclopedia of Genes and Genomes (KEGG) analysis showed that the T-cell receptor signaling pathway, natural-killer-cell-mediated cytotoxicity, and Jak – STAT signaling pathway were enriched, suggesting that functional differences exist in T cell function between D7 and D14, confirming our previous experimental results (). Moreover, based on the results of KEGG and gene set enrichment analysis (GSEA), we found that the pathway of cell adhesion molecules differed of the CD8+ T cells between D7 and D14 (). Cell adhesion is essential for the activation, proliferation, and differentiation of T cells. We further analyzed different cell adhesion molecules and found that the expression of Itgal was remarkedly downregulated in intratumoral CD8+ T cells on D14 (). LFA-1, which is encoded by Itgal, is crucial for regulating the antitumor effectors of CD8+ T cells.Citation25 In agreement with the RNA-seq results, the expression of LFA-1 showed a downward trend in intratumoral CD8+ T cells on D14 in the results of flow cytometry analysis ().
Figure 2. LFA-1 expression on intratumor CD8+ T cells decreased with tumor progression.
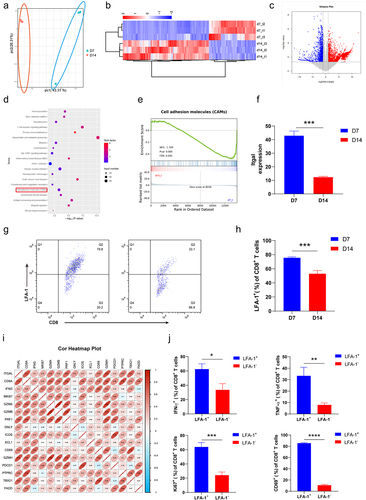
Published RNA-seq data (GSE90728) of tumor-infiltrating CD8+ T cells were downloaded and used for correlation analysis. The expression of Itgal was positively correlated with genes that regulate the activation, proliferation, and function of CD8+ T cells (), suggesting that CD8+ T cells with high LFA-1 expression exhibit antitumor effects. CD8+ T cells infiltrating B16 tumors on D7 were isolated to analyze their function and proliferation. We found that the LFA-1+CD8+ T cells secreted more cytotoxic cytokines (IFN-γ and TNF-α) than LFA-1−CD8+ T cells (). In addition, LFA-1+CD8+ T cells showed higher expressions of Ki67 and CD69 than LFA-1−CD8+ T cells (). Thus, CD8+ T cells with high LFA-1 expression exhibited enhanced proliferation, activation, and function.
LFA-1-mediated is responsible for increased antitumor function of CD8+ T cells
The ISs in CD8+ T cells are special structures formed during antigen recognition. ISs determine the antitumor effects of CD8+ T cells.Citation26–28 We speculated that the LFA-1-mediated regulation of antitumor function in CD8+ T cells is associated with the formation of ISs. Next, we constructed a B16 tumor mouse model and isolated intratumoral CD8+ T cells on D7 and D14, which were cocultured with B16 tumor cells. Image flow cytometry was used to identify the ISs. As expected, ISs formed between CD8+ T cells from D7 tumor tissues and tumor cells; however, the ISs in intratumoral CD8+ T cells at D14 were not found (). The results of statistical fluorescence analysis using image flow cytometry showed that the expression of LFA-1 decreased in tumor-infiltrating CD8+ T cells on D14 (). The expressions of LFA-1 and F-actin were robustly enriched in the ISs of CD8+ T cells on D7 (). F-actin accumulation contributes to IS formation.Citation29,Citation30 These results indicate that the expression and accumulation of LFA-1 favors IS formation. In this coculture system, apoptosis was detected in B16 tumor cells. The results revealed that the apoptosis of B16 tumor cells cocultured with intratumoral CD8+ T cells on D14 was significantly downregulated (). We also found that the concentrations of IFN-γ and IL-2 decreased on D14 in the supernatants of intratumoral CD8+ T cells that were cocultured with B16 tumor cells ().
Figure 3. LFA-1 mediated immune synapse was responsible for increased antitumor functions of CD8+ T cells.
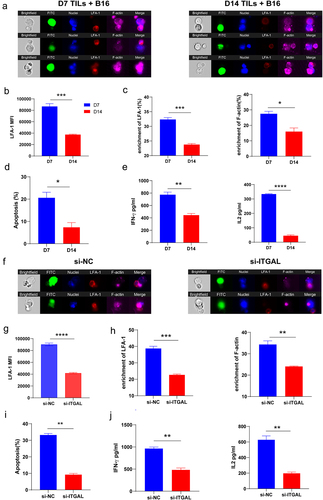
To assess whether the formation of ISs and enhanced antitumor effects were mediated by LFA-1, CD8+ T cells were isolated from tumor tissues on D7 and cocultured with B16 tumor cells. The expression of LFA-1 was downregulated by transfection with Itgal siRNA. The results of image flow cytometry revealed the successful formation of ISs between NC CD8+ T cells from D7 tumor tissues and tumor cells (), and the expression of LFA-1 was downregulated in Itgal-si CD8+ T cells (). The enrichment in LFA-1 and F-actin was markedly decreased in Itgal-si CD8+ T cells compared with that in the NC (); we also found that level of the apoptosis of tumor cells cocultured with Itgal-si CD8+ T cells was lower (). The downregulation of LFA-1 in CD8+ T cells contributed to the reduced secretion of IFN-γ and IL-2 in the supernatants co-cultured with T and tumor cells ().
To further verify these findings, an adoptive T-cell transfer model was developed. OT-1 T cells that infiltrated the tumor tissue on D3 showed higher expression of LFA-1 than those on D7, which was consistent with previous experimental results (Supplementary Fig. S2A). Moreover, the OT-1 T cells infiltrating the tumor tissue on D3 were isolated to knock down LFA-1 expression (Supplementary Fig. S2B) and cocultured with B16-OVA tumor cells. We found that the number of ISs in NC OT-1 T cells cocultured with B16-OVA tumor cells (Supplementary Fig. S2C) and enrichment of LFA-1 and F-actin were markedly decreased in Itgal-si OT-1 T cells compared with those in the NC (Supplementary Fig. S2D). The apoptosis of B16-OVA tumor cells cocultured with Itgal-si OT-1 T cells decreased (Supplementary Fig. S2E). In the coculture system, Itgal-si OT-1 T cells showed reduced secretion of IFN-γ- and IL-2 (Supplementary Fig. S2F). Therefore, these data collectively suggest that LFA-1 acts as an adjuster of ISs in CD8+ T cells, thereby regulating antitumor function.
LFA-1 expression on CD8+ T cells regulated by IL-2/STAT5 signaling
To understand the mechanisms underlying the LFA-1-promoted antitumor effect, RNA-seq of intratumoral CD8+ T cells was performed. The results showed that the Jak – STAT signaling pathway significantly differed between D7 and D14 intratumoral CD8+ T cells (). We conducted flow cytometry to evaluate LFA-1 expression in CD8+ T cells that infiltrated D7 tumor tissues following treatment with STAT inhibitors. The STAT5 inhibitor successfully inhibited the expression of LFA-1 in intratumoral CD8+ T cells (). IL-2 is an upstream regulatory molecule in the STAT5 signaling pathway.Citation31 LFA-1 expression was upregulated in intratumoral CD8+ T cells following treatment with IL-2. However, IL-2 treatment did not enhance LFA-1 expression in intratumoral CD8+ T cells treated with a STAT5 inhibitor (). Intratumoral CD8+ T cells were isolated on D7 and D14 to detect p-STAT5 expression: those on D14 showed lower p-STAT5 expression (Supplementary Fig. S3A), indicating that STAT5 signaling activation decreased with tumor progression. In addition, we found that IL-2 expression in B16 and LLC tumor tissues was downregulated during tumor progression (Supplementary Fig. S3B and S3C).
Figure 4. Low IL2/STAT5 signaling downregulated LFA-1 expression in tumor-infiltrating CD8+ T cells.
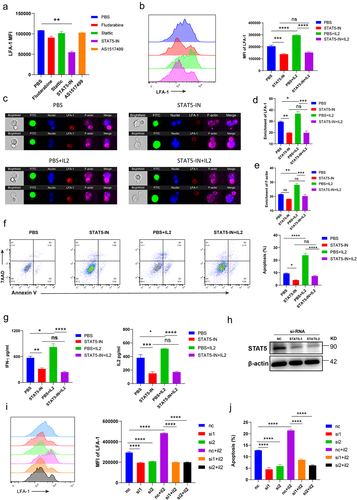
Moreover, to further investigate whether the IL-2/STAT5 signaling pathway participates in the regulation of LFA-1-mediated ISs, isolated intratumoral CD8+ T cells were cocultured with B16 tumor cells after treatment with PBS, a STAT5 inhibitor, IL-2, or a combination of STAT5 inhibitor and IL-2. Treatment with exogenous IL-2 promoted the formation of ISs in CD8+ T cells, but the inhibition of STAT5 prevented the formation of ISs in CD8+ T cells, with or without IL-2 (). We also observed that LFA-1 and F-actin were enriched in the structure of the ISs after treatment with IL-2 (). Compared with the control group, the enrichment of LFA-1 and F-actin did not change in CD8+ T cells after treatment with the STAT5 inhibitor by adding IL-2 (). IL-2 enhanced the capacity of CD8+ T cells to kill tumor cells, and inhibition of STAT5 decreased the IL-2-promoted antitumor function (). The supernatants of the coculture system were collected to detect the cytokines IFN-γ and IL-2. Consistent with the apoptosis of tumor cells, the secretion of IFN-γand IL-2 was upregulated by IL-2, and this phenomenon was inhibited by the addition of the STAT5 inhibitor ().
In addition, we designed STAT5 siRNAs to knock down the expression of STAT5. Compared with the NC, the expression of STAT5 in tumor infiltrating CD8+ T cells was successfully downregulated by STAT5-si1 and STAT5-si2 (). We then cultured these CD8+ T cells with or without IL-2. The results showed that IL-2 did not upregulate LFA-1 expression in STAT5-si1 or STAT5-si2 CD8+ T cells (). Apoptosis of tumor cells cocultured with STAT5-si1 or STAT5-si2 CD8+ T cells did not increase after treatment with IL-2 (). Taken together, these results suggest that IL-2 enhances the expression of LFA-1 in CD8+ T cells by activating STAT5 signaling.
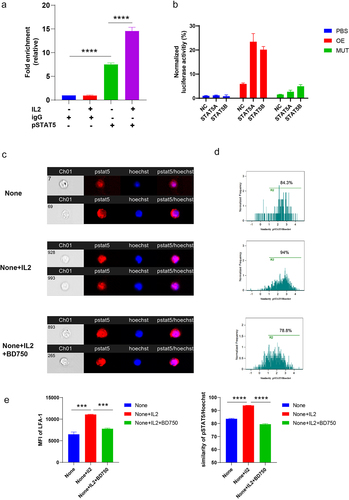
STAT5 is a transcription factor that binds to target genes in the nucleus and regulates their expression. To determine whether STAT5 binds to the promoter region of LFA-1, we performed ChIP-qPCR and luciferase assays. We found that pSTAT5 bound more promoter DNA of LFA-1 than IgG groups (). Furthermore, IL-2 enhanced the ability of pSTAT5 to bind the promoter DNA of LFA-1 (). The results of the luciferase assays showed that both STAT5A and STAT5B increased fluorescence by binding the promoter DNA of LFA-1 (). In addition, pSTAT5 translocation from the cytosol to the nucleus was elevated and the expression of LFA-1 was enhanced upon IL-2 treatment (). BD750Citation32, a dual inhibitor of JAK3 and STAT5, abolished the effects of IL-2 on the CD8+ T cells (). These results indicate that STAT5 regulates the expression by binding to the promoter region.
Figure 5. IL-2/STAT5 signaling regulated LFA-1 expression.
Activating IL-2/STAT5/LFA-1 signaling enhances antitumor function CD8+ T cells
Finally, we established a mouse model to verify the observed antitumor effects by targeting the IL-2/STAT5/LFA-1 signaling pathway in vivo. The tumor model was established and treated with PBS, IL-2, anti-PD-1 antibody, or a combination of anti-PD-1 antibody and IL-2. Tumor growth was stunted by the anti-PD-1 antibody on D7 but not on D14 (). However, the combination of anti-PD-1 antibody and IL-12 on D7 and D14 significantly delayed tumor growth and prolonged survival (). We then evaluated the expression of LFA-1 and the phosphorylation of STAT5 in CD8+ T cells in the tumor tissues of the treated mice. The expression of LFA-1 in CD8+ T cells was increased by the combination of anti-PD-1 antibody and IL-2 on D7 and D14 (). Consistent with the expression of LFA-1, the phosphorylation of STAT5 phosphorylation showed the same trend (). In addition, the combination of anti-PD-1 antibody and IL-2 at D7 and D14 enhanced the secretion of IFN-γ and TNF-α and Ki67 expression (). Tumor immune dysfunction and exclusion (TIDE) was used to analyze the effect of IL-2 on T-cell infiltration and prognosis. The results of our analysis of melanoma, lung adenocarcinoma (LUAD) and ovarian cancer showed that IL-2 positively correlated with T-cell infiltration, and patients with higher IL-2 expression had prolonged survival times (Supplementary Fig. S4C – E).
Figure 6. Activating IL2/STAT5/LFA-1 signaling enhanced antitumor function of CD8+ T cells.
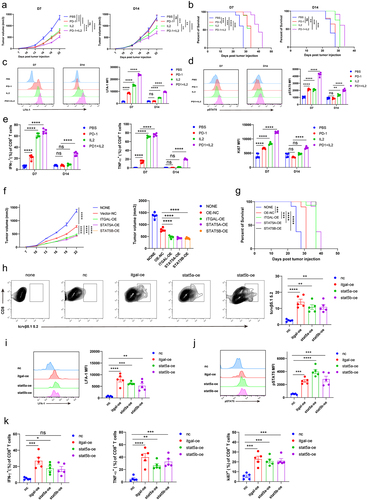
To accurately investigate the antitumor effects of IL-2/STAT5/LFA-1 signaling in CD8+ T cells, OT-1 T cells were overexpressed with Itgal, STAT5A, or STST5B for adoptive transfusion therapy. The results showed that therapies for transferring OT-1 T cells overexpressing Itgal, STAT5A, or STST5B successfully inhibited tumor growth and prolonged survival (). OT-1 T cells that overexpressed Itgal, STAT5A, or STAT5B showed more infiltration into the tumor tissues than in the NC (). We also detected the expression of LFA-1 in intratumoral OT-1 T cells and found that OT-1 T cells overexpressing STAT5A or STAT5B highly expressed LFA-1 (). Moreover, the phosphorylation of STAT5 was upregulated in intratumoral OT-1 T cells overexpressing STAT5A or STAT5B, suggesting that STAT5 is an upstream regulatory molecule of LFA-1 (). The expressions of IFN-γ, TNF-α, and Ki67 were strengthened in intratumoral OT-1 T cells overexpressing Itgal, STAT5A, or STST5B (). OT-1+ CD8+ T cells were knockdown Itgal or not for adoptive transfusion therapy. Treatment with Itgal knockdown OT-1+ CD8+ T cells caused significantly faster tumor growth. Meanwhile, Itgal knockdown OT-1+ CD8+ TILs have the low secretion of IFN-γ and TNF-α (Supplementary Fig. S5A and S5B). We collected PBMCs at baseline of advanced lung cancer patients treated with anti-PD-1 therapy and detected the LFA-1, IFN-γ expression of PD-1+ CD8+ T cells. Advanced lung cancer patients (n = 21) were treated with anti-PD-1 therapy. A 21-day cycle, with a course of 4–6 cycles, was used to evaluate the clinical outcome of anti-PD-1 treatment. PR: partial response; SD: stable disease; PD: progressive disease. Results showed that LFA-1 expression of PD-1+ CD8+ T cells was higher in the group with a better prognosis (PR) than in the group with a worse prognosis (SD, PD). Meanwhile, LFA-1+ CD8+ T cells secreted more IFN-γ than LFA-1− CD8+ T cells (Supplementary Fig. S4A and S4B). This statistic supports our results that the expression of LFA-1 of CD8+ T cells is correlated with the prognosis of patients treated anti-PD-1 therapy. Collectively, our findings show that targeting IL-2/STAT5/LFA-1 signaling successfully delays tumor growth and enhances the antitumor effect of anti-PD-1 therapy by boosting CD8+ T cell function.
Discussion
Although the state of T cells is a major factor affecting the efficacy of anti-PD-1 therapy, the underlying mechanism is still not completely understood. In this study, we established a mouse tumor model and found that the late administration of an anti-PD-1 antibody did not inhibit tumor growth. Moreover, the antitumor effect of CD8+ T cells weakened with tumor progression, suggesting that the effect of anti-PD-1 therapy may be manipulated by the state of CD8+ T cells. Therefore, we aimed to investigate the regulatory factors that mediate the decreased antitumor function of CD8+ T cells and provide insights into enhancing CD8+ T cells to improve the efficacy of anti-PD-1 therapy.
In our study, we performed RNA-seq to investigate the underlying mechanism regulating the antitumor function of intratumoral CD8+ T cells on D14 and observed that the cell adhesion molecule LFA-1 was the major regulatory factor. The LFA-1 activator facilitates the infiltration of tumor-specific T cells and enhances antitumor immunity.Citation27 Magnesium participates in LFA-1 signaling transduction, which supports calcium flux and the formation of ISs in CD8+ T cells.Citation26 LFA-1 plays an important role in T-cell activation and differentiation as well as effector function and migration.Citation25,Citation33,Citation34 Our study is the first to demonstrate that LFA-1 expression and antitumor function decrease in CD8+ T cells with tumor progression, indicating that the antitumor function of CD8+ T cells can be regulated by LFA-1, which has been reported in previous studies. In line with the results of published reports, we further verified that the formation of ISs was directly regulated by LFA-1 and accompanied by the regulation of antitumor immunity in CD8+ T cells. Furthermore, the results of KEGG pathway analysis of the genes in intratumoral CD8+ T cells on D7 and D14 showed that the Jak – STAT signaling pathway were significantly differentially expressed. STAT inhibitors were used to identify the STAT molecule regulating LFA-1 expression. Our findings suggest a possible regulatory mechanism for LFA-1 expression in tumors. Recently, Jak – STAT signaling was found to be beneficial for the antitumor response of T cells, and the inhibition of this signaling by cannabis impaired T-cell function.Citation35 Jak 1/3 inhibitor also induced T-cell exhaustion.Citation36 These studies support our finding that the LFA-1-mediated antitumor effect in CD8+ T cells is controlled by Jak – STAT signaling. The IL-2 cytokine family is a STAT5 signaling activator.Citation37,Citation38 Therefore, our study demonstrates that IL-2-mediated STAT5 activation enhances the expression of LFA-1 in CD8+ T cells, boosting antitumor immunity. IL-2 engineered mesenchymal stem cells and bispecific antibodies (PD-1-IL-2 v) boost CD8+ T-cell function and immunotherapy outcomes,Citation39,Citation40 supporting our findings. However, IL-2 signaling activation can induce CD8+ T-cell exhaustion.Citation12,Citation41 We considered that the differences in the finding of these studies might be caused by the different research models, T-cell states, or levels of IL-2, which need to be further explored. Additionally, we found that the expression of IL-2 in tumor tissues decreased as the tumor progressed; however, we did not clearly identify why IL-2 decreased as the tumor progressed. Recently, research was reported that Magnesium is sensed by LFA-1 expression and regulates the effector function of CD8+ T cells, and Low serum magnesium levels are associated with worse outcomes in cancer immunotherapy. This suggests that LFA-1 may be the considerable target to improve immunotherapy. In addition to PD-1 and CTLA4, there are a great many targets e.g. OX40, TIM-3, TCF1 currently being investigated and targeted in trials and pre-clinical studies to improve TIL function. For anti-CTLA-4 therapy, there is evidence of selective depletion of Treg cells in TME by macrophages expressing the FC-g receptor, suggesting that OX40-directed antibodies can also consume OX40+ Tregs in TME without reducing effectors T cells expressing the receptor. Koyama et al. reported that TIM-3 expression was elevated when patients developed adaptive resistance to PD-1. They found a survival advantage with addition of a TIM-3 blocking antibody following failure of anti-PD-1 therapy. TCF1 is a shining star in the field of immunotherapy. TCF1 plays an indispensable role during the early stages of anti-tumor CD8+ T cell responses. These molecules assist in enhancing anti-PD-1 therapy from a variety of angles, and in our study, we found LFA-1-mediated IS controls the antitumor function of CD8+ T cells in anti-PD-1 therapy. Further animal studies and preclinical studies are needed to discuss the relationship between LFA-1 expression and the immunotherapy inhibitors. LFA-1 agonists and CART structure optimization are clearly deserved further exploration. In summary, we found that the antitumor effect of CD8+ T cells infiltrated into tumors decreased as the tumor progressed, leading to failure of anti-PD-1 therapy. RNA-seq was performed to reveal the mechanism underlying the antitumor effect of CD8+ T cells. Based on the results of in vivo and in vitro experiments, LFA-1-mediated IS controls the antitumor function of CD8+ T cells and is regulated by IL-2/STAT5 signaling. These findings suggest a novel strategy for improving immunotherapy.
Materials and methods
Cell lines
Mouse melanoma cell line B16 and mouse lung cancer cell line LLC were purchased from the Cell Resource Center, Institute of Basic Medicine, Chinese Academy of Medical Sciences. The mouse melanoma cell line, B16-OVA, was kindly provided by Professor Bo Huang of the Institute of Basic Medicine, Chinese Academy of Medical Sciences. The B16, LLC, and B16-OVA cells were cultured in high-glucose Dulbecco’s modified Eagle’s medium (DMEM) (Sigma, cat. #D6429-500 mL) supplemented with 10% fetal bovine serum (FBS) and 1% penicillin/streptomycin (ThermoFisher, cat. #15140–122). Tumor-infiltrating CD8+ T cells were cultured in RPMI1640 medium (Sigma, cat. #R8758-500 ml) supplemented with 10% FBS, 50 U/mL IL-2, and 1% penicillin/streptomycin (ThermoFisher, cat. #15140–122).
Mice, tumor models, and treatment
Female C57BL/6J mice (aged 6–8 weeks) were purchased from SPF Biotechnology Co., Ltd. (Beijing, China). For the tumor anti-PD-1 antibody treatment models, mice were subcutaneously implanted with 1 × 10⁶ B16 or LLC cells in the right flank on day 0. A total of 200 μg anti-PD-1 (BioXcell, clone 29 F.1A12) was administered by intraperitoneal injection every 2 days for a total of three times on D7 or D14 after tumor inoculation. Tumor growth was measured, and survival was observed. For the models of the combination of anti-PD-1 antibody and IL-2 treatment, mice were subcutaneously implanted with 1 × 10⁶ B16 cells into the right flank day 0. B16-bearing C57BL/6 mice were left untreated or treated with 200 μg anti-PD-1 (BioXcell, clone 29 F.1A12), IL-2 (1 × 10⁴ U per mouse) therapy, or combination therapy every 2 days for a total of three times, starting from D7 or D14. For OT1+ CD8+ T-cells adoptive transfusion therapy, mice were subcutaneously implanted with 1 × 10⁶ B16 cells into the right flank on day 0. PBS, OT1+ CD8+ T cells overexpression vector, ITGAL, STAT5A, and STAT5B (1 × 10⁶ cells per mouse) were administered via tail vein injection on D7. Tumor growth was measured every second or third day, and tumor volume was calculated as (length×width×width)/2. All animal experiments were approved by the Animal Care and Use Committee of Zhengzhou University.
Flow cytometry
Single-cell suspensions were prepared from the tumor tissues. For cell-surface staining, all samples were incubated with a Zombie Aqua Fixable Viability Kit (BioLegend, cat. #423101) for 15 min at room temperature. To detect cytokine production, cells were treated with a Cell Activation Cocktail (BioLegend, cat. #423304) for 4 h. The cells were stained with anti-CD45 antibody (BioLegend, cat. #103108), anti-CD8a (BioLegend, cat. #100714), anti-CD45.2 (BioLegend; cat. #109829), anti-TCR Vβ5.1,5.2 (BioLegend, cat. #139508), anti-CD11a (BioLegend; cat. #101119), anti-CD11a/CD18 (BioLegend; cat. #141012), and anti-CD69 (BioLegend; cat. #104539). After fixation and permeabilization, cells were stained with anti-IFN-γ (BioLegend, cat. #505808) and anti-TNF-α (BioLegend; cat. #506322). For intranuclear detection, the cells were fixed and permeabilized using a Transcription Factor Buffer Set (BD eBioscience, cat. #51–9008102) and stained with anti-Ki67 (BioLegend, cat. #652410), or anti-STAT5 phospho (Tyr694) (BioLegend, cat. #936906). Data were acquired on a Beckman Coulter CytoFLEX flow cytometer and analyzed using FlowJo software.
RNA-seq and bioinformatics analysis
CD8+ T cells in TILs from B16 tumor-bearing mice were sorted using mouse CD8a microbeads (Miltenyi Biotec, 130-117-044) according to the manufacturer’s protocol. In brief, single-cell suspensions from tumor tissues were incubated with mouse CD8a microbeads for 10 min at 4°C. After magnetic labeling, the CD8+ T cells were isolated using a column. RNA was isolated using a TRIzol reagent (Invitrogen, cat, #15596026CN). RNA-seq and data analyses were conducted by SeqHealth Technology Co., Ltd. (Wuhan, China). 2 μg total RNAs were used for stranded RNA sequencing library preparation KC-DigitalTM Stranded mRNA Library Prep Kit for Illumina® (Catalog NO. DR08502, Wuhan Seqhealth Co., Ltd. China) following the manufacturer’s instruction. Library strategy was UID-mRNA-seq PE-150. KEGG analysis: Differentially expressed genes are summarized by up-regulated and down-regulated genes. Differentially expressed genes are usually evaluated from the aspects of difference multiple and significance level, and the selection criteria for differentially expressed genes are as follows: absolute value of logFC > 1 and pvalue < 0.05. Then the differential Genes were analyzed by KEGG (Kyoto Encyclopedia of Genes and Genomes). The enriched KEGG data were screened, and P-Value <0.05 was used as the standard. Pathway significance enrichment analysis was used to find out the Pathway of significant enrichment in differentially expressed genes compared with the whole genomic background by KEGG Pathway as unit and hypergeometric test. The figure shows the top 20 KEGG pathways selected most prominently by pvalue.
GSEA analysis: All the gene expression matrix was analyzed, and the samples were divided into D7 and D14 groups. The difference multiple values of all the genes after pre-treatment were sorted from large to small to represent the change trend of gene expression between the two groups. The list of sequenced genes can be seen as up-regulated differential genes at the top and down-regulated differential genes at the bottom.
Luciferase assays
HEK 293T cells were transfected with 100 ng Renilla luciferase plasmid pRL-TK, 1 μg Firefly luciferase plasmid pGL3-Itgal promoter-luc or the corresponding mutant promoter-luc, and 4 μg of pcDNA3.1-Stat5a/b plasmid for 48 h. Then, cell lysates were analyzed using a Firefly & Renilla Assay kit (absin, cat. #abs60341) on a SpectraMax iD3 (Molecular Devices). The Firefly luciferase activity was normalized to the Renilla luciferase activity.
ChIP-qPCR
ChIP – qPCR was performed using a SimpleChIP Enzymatic Chromatin IP Kit (magnetic beads) (CST, cat. #9003), according to the manufacturer’s protocol. Briefly, CD8+ T cells were cross-linked, and the chromatin was sheared and immunoprecipitated with anti-STAT5 antibody (cat. #94205). The samples were incubated with protein-G magnetic beads. After the elution of chromatin and reverse cross-linking, the DNA was purified and used for qPCR. ChIP – qPCR primers for the Itgal promoter: 5’- TCACTACAACCTCCATCTCCTGG −3’, 5’- CAGCCTGGCCAACATGGAG −3’.
RT-qPCR analysis
Total RNA was extracted using TRIzol reagent (Invitrogen, 15596026CN), and cDNA was synthesized using HiScript III All-in-one RT SuperMix Perfect for qPCR (Vazyme, R333–01). qPCR was performed using SYBR qPCR master mix (Vazyme, Q711–02) on a Bio-Rad CFX Connect. The primer sequences used were as follows: m-IL-2 forward 5’-TGAGCAGGATGGAGAATTACAGG-3’ and reverse 5’-GTCCAAGTTCATCTTCTAGGCAC-3’.
Imaging flow cytometry
For IS analysis, tumor-infiltrating CD8+ T cells from D7 and D14 after B16 tumor inoculation were sorted and cocultured with GFP-expressing B16 tumor cells in vitro. After incubation, cells were stained with antimouse CD11a/CD18 (BioLegend, cat. #141012), Phalloidin-iFluor® 647 Conjugate (AAT Bioquest, cat. #23127), and nuclear dye (Hoechst 33,342; Solarbio, cat. #C0030). 20000 events were acquired per sample. The pictures are representative of 3–4 independent experiments (mean, SE). Data were acquired using an ImageStream system (Amnis) and analyzed using IDEAS 3.0. To identify the contact zone between CD8+ T cells and B16 cells, CD8+ T-cell/B16-cell couples were gated, and a valley mask was defined between these coupled cells. The ratio between the valley mask and the mean LFA-1 of CD8+ T cells was then calculated.
For p-STAT5 nuclear translocation analysis, tumor-infiltrating CD8+ T cells from D7 after B16 tumor inoculation were isolated and treated with IL-2 (100 U/mL) and the STAT5 inhibitor BD750 (MCE, cat. #HY-131140). The cells were stained with antimouse CD11a/CD18 (BioLegend, cat. #141012) and anti-STAT5 (Tyr694) (BioLegend, cat. #936906) using a Transcription Factor Buffer Set (BD Biosciences). Nuclei were stained with Hoechst 33,342 (cat. #C0030). Data were acquired using an ImageStream system (Amnis) and analyzed using IDEAS 3.0. The similarity between p-STAT5 and nuclear dyes was matched, and the mean of LFA-1 was calculated.
Killing assay
CD8+ T cells were cocultured with B16 tumor cells at an effector-to-target ratio of 10:1 in vitro. After 24 h, B16 tumor cells were collected and stained with Annexin V (BioLegend, cat. #640920) and 7-AAD Viability Staining Solution (BioLegend, cat. #420404). Flow cytometry was used to analyze the lysis of B16 tumor cells.
Elisa
The IFN-γ and IL-2 production in the supernatants from the CD8+ T cells and B16 tumor cells coculture system was measured with a Mouse IFN-γ Elisa Kit (NeoBioscience, cat #EMC101g) and a Mouse IL-2 Elisa Kit (NeoBioscience, cat #EMC002) according to the manufacturer’s protocol.
Statistical analysis
Data were analyzed using GraphPad Prism 9 software. Student’s t-test was used to compare two groups. One-way analysis of variance (ANOVA) with Tukey’s multiple comparison test was used to compare more than two groups. All results are presented as the mean ± SEM. Survival rates were evaluated using log-rank tests. Statistical significance reported shown as *(P < 0.05), **(P < 0.01), ***(P < 0.001), and **** (P < 0.0001); ns indicates no significance (P > 0.05)
Supplemental Material
Download Zip (2.8 MB)Disclosure statement
No potential conflict of interest was reported by the author(s).
Data availability statement
The date supporting the finding of this study are available from the corresponding author upon reasonable request.
Supplementary material
Supplemental data for this article can be accessed online at https://doi.org/10.1080/2162402X.2023.2293511.
Additional information
Funding
References
- Ganesan AP, Clarke J, Wood O, Garrido-Martin EM, Chee SJ, Mellows T, Samaniego-Castruita D, Singh D, Seumois G, Alzetani A, et al. Tissue-resident memory features are linked to the magnitude of cytotoxic T cell responses in human lung cancer. Nat Immunol. 2017;18(8):940–14. doi:10.1038/ni.3775.
- Luoma AM, Suo S, Williams HL, Sharova T, Sullivan K, Manos M, Bowling P, Hodi FS, Rahma O, Sullivan RJ, et al. Molecular pathways of colon inflammation induced by cancer immunotherapy. Cell. 2020;182(3):655–671 e622. doi:10.1016/j.cell.2020.06.001.
- Song Y, Zhang B, Xin D, Kou X, Tan Z, Zhang S, Sun M, Zhou J, Fan M, Zhang M, et al. First-line serplulimab or placebo plus chemotherapy in PD-L1-positive esophageal squamous cell carcinoma: a randomized, double-blind phase 3 trial. Nat Med. 2023;29(2):473–482. doi:10.1038/s41591-022-02179-2.
- Yan Q, Zhao Y, Ma R, Wang B, Zhu Z, Li T, He D, Hocart CH, Zhou Y. Capping the hydroxyl groups (-OH) of alpha-cellulose to reduce hy-groscopicity for accurate (18)O/(16)O measurement by EA/Py/IRMS. Talanta. 2023;262:124698. doi:10.1016/j.talanta.2023.124698.
- Li H, van der Leun AM, Yofe I, Lubling Y, Gelbard-Solodkin D, van Akkooi ACJ, van den Braber M, Rozeman EA, Haanen J, Blank CU, et al. Dysfunctional CD8 T cells form a proliferative, dynamically regulated compartment within human melanoma. Cell. 2019;176(4):775–789 e718. doi:10.1016/j.cell.2018.11.043.
- Beltra JC, Manne S, Abdel-Hakeem MS, Kurachi M, Giles JR, Chen Z, Casella V, Ngiow SF, Khan O, Huang YJ, et al. Developmental relationships of four exhausted CD8(+) T cell subsets reveals underlying transcriptional and epigenetic landscape control mechanisms. Immunity. 2020;52(5):825–841 e828. doi:10.1016/j.immuni.2020.04.014.
- Pauken KE, Sammons MA, Odorizzi PM, Manne S, Godec J, Khan O, Drake AM, Chen Z, Sen DR, Kurachi M, et al. Epigenetic stability of exhausted T cells limits durability of reinvigoration by PD-1 blockade. Sci. 2016;354(6316):1160–1165. doi:10.1126/science.aaf2807.
- Baitsch L, Baumgaertner P, Devevre E, Raghav SK, Legat A, Barba L, Wieckowski S, Bouzourene H, Deplancke B, Romero P, et al. Exhaustion of tumor-specific CD8(+) T cells in metastases from melanoma patients. J Clin Invest. 2011;121(6):2350–2360. doi:10.1172/JCI46102.
- Zehn D, Thimme R, Lugli E, de Almeida GP, Oxenius A. ‘Stem-like’ precursors are the fount to sustain persistent CD8+ T cell responses. Nat Immunol. 2022;23(6):836–847. doi:10.1038/s41590-022-01219-w.
- Yang M, Lu J, Zhang G, Wang Y, He M, Xu Q, Xu C, Liu H. CXCL13 shapes immunoactive tumor microenvironment and enhances the efficacy of PD-1 checkpoint blockade in high-grade serous ovarian cancer. J Immunother Cancer. 2021;9(1):e001136. doi:10.1136/jitc-2020-001136.
- Smith KA. Interleukin-2: inception, impact, and implications. Sci. 1988;240(4856):1169–1176. doi:10.1126/science.3131876.
- Lutz V, Hellmund VM, Picard FSR, Raifer H, Ruckenbrod T, Klein M, Bopp T, Savai R, Duewell P, Keber CU, et al. IL18 receptor signaling regulates tumor-reactive CD8+ T-cell exhaustion via activation of the IL2/STAT5/mTOR Pathway in a pancreatic cancer model. Cancer Immunol Res. 2023;11(4):421–434. doi:10.1158/2326-6066.CIR-22-0398.
- Gaggero S, Martinez-Fabregas J, Cozzani A, Fyfe PK, Leprohon M, Yang J, Thomasen FE, Winkelmann H, Magnez R, Conti AG, et al. IL-2 is inactivated by the acidic pH environment of tumors enabling engineering of a pH-selective mutein. Sci Immunol. 2022;7(78):eade5686. doi:10.1126/sciimmunol.ade5686.
- Li P, Mitra S, Spolski R, Oh J, Liao W, Tang Z, Mo F, Li X, West EE, Gromer D, et al. STAT5-mediated chromatin interactions in superenhancers activate IL-2 highly inducible genes: functional dissection of the Il2ra gene locus. Proc Natl Acad Sci U S A. 2017;114(46):12111–12119. doi:10.1073/pnas.1714019114.
- Kradin RL, Kurnick JT, Lazarus DS, Preffer FI, Dubinett SM, Pinto CE, Gifford J, Davidson E, Grove B, Callahan RJ, et al. Tumour-infiltrating lymphocytes and interleukin-2 in treatment of advanced cancer. Lancet. 1989;1(8638):577–580. doi:10.1016/S0140-6736(89)91609-7.
- Rosenberg SA. IL-2: the first effective immunotherapy for human cancer. J Immunol. 2014;192(12):5451–5458. doi:10.4049/jimmunol.1490019.
- Hons M, Kopf A, Hauschild R, Leithner A, Gaertner F, Abe J, Renkawitz J, Stein JV, Sixt M. Chemokines and integrins independently tune actin flow and substrate friction during intranodal migration of T cells. Nat Immunol. 2018;19(6):606–616. doi:10.1038/s41590-018-0109-z.
- Stinchcombe JC, Asano Y, Kaufman CJG, Bohlig K, Peddie CJ, Collinson LM, Nadler A, Griffiths GM. Ectocytosis renders T cell receptor signaling self-limiting at the immune synapse. Sci. 2023;380(6647):818–823. doi:10.1126/science.abp8933.
- Samstag Y, Eibert SM, Klemke M, Wabnitz GH. Actin cytoskeletal dynamics in T lymphocyte activation and migration. J Leukoc Biol. 2003;73(1):30–48. doi:10.1189/jlb.0602272.
- Kinashi T. Intracellular signalling controlling integrin activation in lymphocytes. Nat Rev Immunol. 2005;5(7):546–559. doi:10.1038/nri1646.
- Yuan Y, Adam A, Zhao C, Chen H. Recent advancements in the mechanisms underlying resistance to PD-1/PD-L1 blockade immunotherapy. Cancers Basel. 2021;13(4):663. doi:10.3390/cancers13040663.
- Wang S, Hao J, Wang H, Fang Y, Tan L. Efficacy and safety of immune checkpoint inhibitors in non-small cell lung cancer. Oncoimmunology. 2018;7(8):e1457600. doi:10.1080/2162402X.2018.1457600.
- De Biasi S, Gibellini L, Lo Tartaro D, Puccio S, Rabacchi C, Mazza EMC, Brummelman J, Williams B, Kaihara K, Forcato M, et al. Circulating mucosal-associated invariant T cells identify patients responding to anti-PD-1 therapy. Nat Commun. 2021;12(1):1669. doi:10.1038/s41467-021-21928-4.
- Thommen DS, Koelzer VH, Herzig P, Roller A, Trefny M, Dimeloe S, Kiialainen A, Hanhart J, Schill C, Hess C, et al. A transcriptionally and functionally distinct PD-1(+) CD8(+) T cell pool with predictive potential in non-small-cell lung cancer treated with PD-1 blockade. Nat Med. 2018;24(7):994–1004. doi:10.1038/s41591-018-0057-z.
- Gerard A, Cope AP, Kemper C, Alon R, Kochl R. LFA-1 in T cell priming, differentiation, and effector functions. Trends Immunol. 2021;42(8):706–722. doi:10.1016/j.it.2021.06.004.
- Lotscher J, Marti ILAA, Kirchhammer N, Cribioli E, Giordano Attianese GMP, Trefny MP, Lenz M, Rothschild SI, Strati P, Kunzli M, et al. Magnesium sensing via LFA-1 regulates CD8+ T cell effector function. Cell. 2022;185(4):585–602 e529. doi:10.1016/j.cell.2021.12.039.
- Hickman A, Koetsier J, Kurtanich T, Nielsen MC, Winn G, Wang Y, Bentebibel SE, Shi L, Punt S, Williams L, et al. LFA-1 activation enriches tumor-specific T cells in a cold tumor model and synergizes with CTLA-4 blockade. J Clin Invest. 2022;132(13). doi:10.1172/JCI154152.
- Perro M, Iannacone M, von Andrian UH, Peixoto A. Role of LFA-1 integrin in the control of a lymphocytic choriomeningitis virus (LCMV) infection. Virulence. 2020;11(1):1640–1655. doi:10.1080/21505594.2020.1845506.
- Hosseini BH, Louban I, Djandji D, Wabnitz GH, Deeg J, Bulbuc N, Samstag Y, Gunzer M, Spatz JP, Hammerling GJ. Immune synapse formation determines interaction forces between T cells and antigen-presenting cells measured by atomic force microscopy. Proc Natl Acad Sci U S A. 2009;106(42):17852–17857. doi:10.1073/pnas.0905384106.
- Oh SC, Kim SE, Jang IH, Kim SM, Lee SY, Lee S, Chu IS, Yoon SR, Jung H, Choi I, et al. NgR1 is an NK cell inhibitory receptor that destabilizes the immunological synapse. Nat Immunol. 2023;24(3):463–473. doi:10.1038/s41590-022-01394-w.
- Rosenthal LA, Winestock KD, Finbloom DS. IL-2 and IL-7 induce heterodimerization of STAT5 isoforms in human peripheral blood T lymphoblasts. Cell Immunol. 1997;181(2):172–181. doi:10.1006/cimm.1997.1208.
- Liu Y, Yang T, Li H, Li MH, Liu J, Wang YT, Yang SX, Zheng J, Luo XY, Lai Y, et al. BD750, a benzothiazole derivative, inhibits T cell proliferation by affecting the JAK3/STAT5 signalling pathway. Br J Pharmacol. 2013;168(3):632–643. doi:10.1111/j.1476-5381.2012.02172.x.
- Smith A, Stanley P, Jones K, Svensson L, McDowall A, Hogg N. The role of the integrin LFA-1 in T-lymphocyte migration. Immunol Rev. 2007;218(1):135–146. doi:10.1111/j.1600-065X.2007.00537.x.
- Wang MS, Hu Y, Sanchez EE, Xie X, Roy NH, de Jesus M, Winer BY, Zale EA, Jin W, Sachar C, et al. Mechanically active integrins target lytic secretion at the immune synapse to facilitate cellular cytotoxicity. Nat Commun. 2022;13(1):3222. doi:10.1038/s41467-022-30809-3.
- Xiong X, Chen S, Shen J, You H, Yang H, Yan C, Fang Z, Zhang J, Cai X, Dong X, et al. Cannabis suppresses antitumor immunity by inhibiting JAK/STAT signaling in T cells through CNR2. Sig Transduct Target Ther. 2022;7(1):99. doi:10.1038/s41392-022-00918-y.
- Dai Z, Sezin T, Chang Y, Lee EY, Wang EHC, Christiano AM. Induction of T cell exhaustion by JAK1/3 inhibition in the treatment of alopecia areata. Front Immunol. 2022;13:955038. doi:10.3389/fimmu.2022.955038.
- Hu X, Li J, Fu M, Zhao X, Wang W. The JAK/STAT signaling pathway: from bench to clinic. Sig Transduct Target Ther. 2021;6(1):402. doi:10.1038/s41392-021-00791-1.
- Ross SH, Cantrell DA. Signaling and function of interleukin-2 in T lymphocytes. Annu Rev Immunol. 2018;36(1):411–433. doi:10.1146/annurev-immunol-042617-053352.
- Bae J, Liu L, Moore C, Hsu E, Zhang A, Ren Z, Sun Z, Wang X, Zhu J, Shen J, et al. IL-2 delivery by engineered mesenchymal stem cells re-invigorates CD8(+) T cells to overcome immunotherapy resistance in cancer. Nat Cell Biol. 2022;24(12):1754–1765. doi:10.1038/s41556-022-01024-5.
- Tichet M, Wullschleger S, Chryplewicz A, Fournier N, Marcone R, Kauzlaric A, Homicsko K, Deak LC, Umana P, Klein C, et al. Bispecific PD1-IL2v and anti-PD-L1 break tumor immunity resistance by enhancing stem-like tumor-reactive CD8(+) T cells and reprogramming macrophages. Immunity. 2023;56(1):162–179 e166. doi:10.1016/j.immuni.2022.12.006.
- Liu Y, Zhou N, Zhou L, Wang J, Zhou Y, Zhang T, Fang Y, Deng J, Gao Y, Liang X, et al. IL-2 regulates tumor-reactive CD8(+) T cell exhaustion by activating the aryl hydrocarbon receptor. Nat Immunol. 2021;22(3):358–369. doi:10.1038/s41590-020-00850-9.