
ABSTRACT
Attenuated measles virus (MV) exerts its oncolytic activity in malignant pleural mesothelioma (MPM) cells that lack type-I interferon (IFN-I) production or responsiveness. However, other cells in the tumor microenvironment (TME), such as myeloid cells, possess functional antiviral pathways. In this study, we aimed to characterize the interplay between MV and the myeloid cells in human MPM. We cocultured MPM cell lines with monocytes or macrophages and infected them with MV. We analyzed the transcriptome of each cell type and studied their secretion and phenotypes by high-dimensional flow cytometry. We also measured transgene expression using an MV encoding GFP (MV-GFP). We show that MPM cells drive the differentiation of monocytes into M2-like macrophages. These macrophages inhibit GFP expression in tumor cells harboring a defect in IFN-I production and a functional signaling downstream of the IFN-I receptor, while having minimal effects on GFP expression in tumor cells with defect of responsiveness to IFN-I. Interestingly, inhibition of the IFN-I signaling by ruxolitinib restores GFP expression in tumor cells. Upon MV infection, cocultured macrophages express antiviral pro-inflammatory genes and induce the expression of IFN-stimulated genes in tumor cells. MV also increases the expression of HLA and costimulatory molecules on macrophages and their phagocytic activity. Finally, MV induces the secretion of inflammatory cytokines, especially IFN-I, and PD-L1 expression in tumor cells and macrophages. These results show that macrophages reduce viral proteins expression in some MPM cell lines through their IFN-I production and generate a pro-inflammatory interplay that may stimulate the patient’s anti-tumor immune response.
Introduction
Malignant pleural mesothelioma (MPM) is an aggressive cancer mostly due to asbestos exposure.Citation1 Treatments are mainly based on surgery, or pemetrexed and cisplatin combination chemotherapy with or without bevacizumab. Unfortunately, the five-year survival remains below 10%.Citation2 In October 2020, an immunotherapy based on a combination of ipilimumab and nivolumab has been approved and led to new immunotherapeutic guidelines for MPM.Citation3 Benefits of this combination were observed mainly in non-epithelioid mesothelioma patients regardless of PD-L1 expression.Citation4 However, there are still a large number of patients that do not respond to immunotherapy. In other cancers, poor response to immunotherapy has been linked to a lack of tumor mutational burden and T cell-inflamed gene expression profile in the tumor.Citation5 In MPM patients, PD-L1 expression is highly variable from one study to another and ranges from 16% to 65% of the patients.Citation6 Furthermore, its expression is more frequent in non-epithelioid mesothelioma and has been associated with a lower overall survival.
The immune infiltrate is highly variable from one MPM patient to another and comprised macrophages, regulatory CD4+ T lymphocytes, CD8+ T lymphocytes and NK cells.Citation6–9 Myeloid cells such as tumor-associated macrophages represent 30% to 40% of the immune infiltrate in almost all tumors. Macrophages are involved very early on in MPM pathogenesis due to dysfunctional phagocytosis of asbestos fibers,Citation10 leading to their activation and to the production of reactive oxygen species that promote both an inflammatory environment and genetic instability.Citation11 Later in the disease, they commonly acquire an M2-like phenotype mainly characterized by the expression of CD163 and CD206.Citation6 Our team previously showed that monocytes cocultured with MPM cell lines differentiate mainly into CD163+ M2-like immunosuppressive macrophages with a central role of M-CSF produced by tumor cells that binds to the CSF1R receptor.Citation12,Citation13 Functionally, these M2-like macrophages are able to block the cytotoxicity of tumor antigen-specific CD8+ T cells against MPM cells.Citation13 The first spatial transcriptomics report in MPM shows that M2-like macrophages reside inside the tumor, whereas CD8+ T cells tend to be excluded and accumulate in the adjacent tissue.Citation14 Various strategies aim to attract these cells inside the tumor.Citation15 Other strategies are also being developed to block the immunosuppressive function of M2-like macrophages or to redirect their differentiation toward a more inflammatory, M1-like phenotype.Citation16 Interestingly, in a mesothelioma mouse model, monocyte-derived macrophages accumulate in the tumor with an M2-like phenotype and their depletion leads to tumor rejection, in contrast to resident macrophages that support antitumor immune response.Citation17
Oncolytic immunotherapy is a therapeutic approach based on oncolytic viruses (OVs).Citation18 OVs are nonpathogenic replication-competent viruses that infect and kill exclusively or preferentially tumor cells without harming healthy cells. Infection of tumor cells by OVs results in an immunogenic death that can activate antiviral inflammation in ‘cold’ tumors attract new immune cells and reinforce the antitumor immune response.Citation19 Furthermore, by inserting transgenes into their genome, they can be used as expression vectors to produce therapeutic proteins in the tumor microenvironment (TME). Thus, OVs may be good candidates to attract immune cells in tumors, reorient immunosuppressive myeloid cells, activate the antitumor immune response and enhance immunotherapy by immune checkpoint inhibitors (ICI).
The attenuated vaccine strains of measles virus (MV) are spontaneously oncolytic against numerous types of cancers and have been evaluated in clinical trials.Citation20 We and others have shown that MV induces immunogenic death in tumor cells that leads to the maturation of dendritic cells (DC) and promotes tumor antigen cross-presentation.Citation21–24 By studying MV oncolytic activity in a bio-collection of 22 human MPM cell lines, we confirmed that MV oncotropism requires CD46 expression on tumor cells Citation25 and that the most permissive tumor cell lines to MV replication present a defective IFN-I response compared to MV-resistant cells.Citation25,Citation26 More recently, we showed that the most frequent defect in the IFN-I response found in about 20% of MPM patient is the homozygous deletion (HD) of all IFN-I encoding genes that co-occurs with the HD of CDKN2A gene located nearby on the human chromosome 9.Citation26
Interactions between MV and nonmalignant cells from the human TME, especially myeloid cells are not well defined but hold a great potential for therapeutic development. In this study, we aimed at characterizing these interactions in the context of MPM, with a focus on the myeloid compartment. We cocultured different types of myeloid cells (monocytes, M1- or M2-like macrophages and DC) with two patient-derived MPM cell lines that expressed GFP after exposure to MV-GFP. First, we confirmed that monocytes differentiate mainly into M2-like macrophages after coculture with MPM cells. Then, we showed that myeloid cells, via their production of IFN-I, can decrease GFP expression of MV-GFP in one of the MPM cell lines. Finally, we showed that MV induces an antiviral proinflammatory response in tumor and myeloid cells that is characterized by the production of numerous chemokines and cytokines, as well as PD-L1 expression in both cell types. These results suggest that MV may be a good candidate to modify the MPM TME and thus make it more favorable to the efficacy of both the anti-tumor immune response and ICI immunotherapy.
Methods
Cell lines
Human MPM cell lines were established and genetically characterized in the laboratory from pleural effusions (Biocollection DC-2011–1399, CHU Nantes, France).Citation27 The cell lines were cultured at 37°C and 5% CO2 in Roswell Park Memorial Institute Medium (RPMI)-1640 (Eurobio) supplemented with 2 mM L-Glutamine, 100IU/mL Penicillin, 100 µg/mL Streptomycin (all from Gibco), and 10% heat-inactivated Fetal Calf Serum (FCS, Corning). They were regularly screened for Mycoplasma contamination (PlasmoTestTM, InvivoGen).
Monocyte purification and myeloid cell differentiation
Blood monocytes were isolated through negative magnetic sorting (EasySep Human Monocyte Enrichment Kit, StemCell) from peripheral blood mononuclear cells of healthy donors (Etablissement Français du Sang, ethics agreement CPDL-PLER-2022 09).
Macrophages were differentiated from monocytes over 4 days, seeded in a 12-well plate at 1.106 cells in 1 mL of RPMI supplemented as described. At the seeding day and the day after, 200 U/mL of GM-CSF (Miltenyi) was added to differentiate M1-like macrophages or 5000 U/mL of M-CSF (Miltenyi) for M2-like macrophages. After 4 days, macrophages were harvested for experiments. DCs were differentiated from monocytes over 5 days, seeded at 10.106 cells in a 6-well plate with 5 mL of RPMI supplemented with 100 U/mL Penicillin, 100 μg/mL Streptomycin, 2 mM L-Glutamine, 2% human albumin (VIALEBEX), 1000IU/mL of GM-CSF and 200IU/mL of Interleukin-4 (Miltenyi). After 5 days, DCs were harvested for experiments.
Oncolytic measles virus and infection of cocultures
The live-attenuated Schwarz strain of measles virus (MV) and MV expressing the enhanced green fluorescent protein (MV-GFP) were produced as previously described.Citation28
Myeloid cells were cocultured with MPM cells at a 1:2 myeloid:MPM cell ratio, in 50% supplemented RPMI and 50% conditioned medium from MPM cells. In parallel, each cell type was cultured alone following the same procedure. After 24 h, cells were infected with either MV or MV-GFP with a multiplicity of infection of 1 viral particle per MPM cell, whereas no virus was added in the non-infected (NI) condition. All the experiments were conducted 72 h after infection.
Immune profiling of samples by high-dimensional flow cytometry
Cells were infected with MV-GFP. A total of 300,000 cells per condition were harvested using tryPLE (GIBCO). After washing in Phosphate buffered saline (PBS), the cells were incubated 20 min with 1:500 Zombie UV™ Fixable Viability dye (Biolegend) in PBS. They were washed with PBS-0.1% Bovine Serum Albumine (BSA, Sigma-Aldrich) and fixed with PBS-4% paraformaldehyde (PFA, Electron Microscopy Sciences) for 10 min, washed and stored at 4°C.
Cells were incubated in 50 µL of Brilliant Stain Buffer (BD Biosciences) supplemented with 1.25 µg of human BD Fc Block (BD Biosciences) and 1.25 µg of True Stain monocytes blocker (Biolegend). After 10 min, appropriate concentrations of specific antibodies or isotype controls from the same manufacturer were added for 30 min at 4°C (available in supplemental Stable 1 (Table S1)).
After three washes in PBS-0.1%BSA, stained cells were acquired on a 5 laser, 32 detector BD FACSymphony™ A5 Cell Analyzer (BD Bioscience). The BD FACSDiva 8.0 software (BD Biosciences) was used for data acquisition. Weekly QC was performed using CS&T DiVa QC beads (BD Biosciences), and standardization of the flow cytometry data acquisition across the three independent experiments was done using Rainbow Calibration Particles (8 peaks) (BD Biosciences), to ensure that the instrument variability was inferior to 3% for each detector.
Flow cytometry supervised and unsupervised analysis
Flow cytometry data were cleaned using the FlowAI algorithm with default settings on the OMIQ platform (Dotmatics, https://www.omiq.ai/).Citation29 Cells were manually gated to remove aggregates, debris and doublets. Compensations were performed, checked and applied to samples using FlowJo software 10.8.1 (BD Biosciences). Arcsinh scaling was adjusted in OMIQ to ensure than 99% of the events were on scale, and the negative population was unimodal around 0 for each channel. The gating strategy for further analysis on live cells is shown in supplemental Figure 1 (Figure S1).
The FlowSOM algorithm was applied to 7,000 events for each sample (Euclidean distance to determine the nearest neighbor of a new point, 7 × 7 grid for the self-organizing map, 10 training iterations) to cluster the data.Citation30 Results were mapped on a UMAP dimensional reduction of all fluorescent features, excluding GFP and the viability dye.Citation31
Cells positive for HLA-DR and CD45 were gated and downsampled to 1,200 events. The FlowSOM algorithm was applied to uninfected samples with the same settings as before. Twelve homogeneous metaclusters were identified and visualized on an Opt-SNE dimensional reduction of all features excluding GFP and the viability dye.Citation32 Metaclusters were annotated to display the different conditions of cultures. The MFI values of markers were displayed on a clustered heatmap, normalized by column. A principal component analysis was performed on all features except for GFP and viability dye to show the variations between the different culture conditions.Citation33 The FlowSOM algorithm, with the same settings, was also applied on all samples. Twenty metaclusters were created and annotated to display the different culture conditions and visualized on an Opt-SNE dimensional reduction of all fluorescent parameters except for the viability dye. Cocultured samples were then grouped into 4 culture conditions and the MFI values of markers were compared. The MPM cells (HLA-DR or CD45 negative cells) were analyzed for the MFI of GFP and PD-L1.
GFP expression kinetic assay
10,000 MPM cells were seeded in 96-well plates in 180 µL of their culture medium, alone or with 5,000 monocytes, M1-like or M2-like macrophages. After 24 h, they were infected or not with MV-GFP. GFP fluorescence was measured daily for 10 days using a FLUOstar Omega reader (BMG Labtech). Data were normalized to the uninfected conditions and compared between cocultured cells and MPM cells alone.
Confocal microscopy
Cocultures were seeded in µ-Slide 8-well plates (IBIDI) with 30,000 MPM cells/well. Treatment with 2 µM Ruxolitinib (Invivogen) or 1,000IU/mL of IFN-α2a/-β1 (Immunotools) was administered or not 8 h prior to MV-GFP infection. Cells were fixed in PBS-4% PFA at room temperature for 10 min. Myeloid cells were stained overnight with an anti-CD45-APC antibody (Biolegend, RRID:AB_304037) diluted to 1:50 in PBS-2% BSA. Nuclei were labeled with 5 µg/ml of Hoechst33342 (Sigma) in PBS-2% BSA for 1 h.
Pictures were taken with a Nikon A1rHD LFOV confocal microscope, with a 60× oil immersion objective (Nikon Instruments). The images were processed and analyzed using the ImageJ software.Citation34
mRNA extraction for 3’RNAseq digital gene expression and RT-PCR
Cells in cocultures with monocytes or M2-like macrophages, infected with MV or not, were harvested using TryPLE. CD45+ and CD45- cells were sorted using human CD45 (TIL) MicroBeads (Miltenyi). An additional 4 mL wash step was added to the manufacturer’s protocol. RNAs were extracted immediately from positive and negative cells using Nucleospin® RNA plus kit (Macherey-Nagel).
3’RNAseq digital gene expression
mRNA were analyzed by 3’seq-RNA Profiling (GenoBird, IRS-UN, Nantes, France) using a NovaSeq 6000 (Illumina) as described previously.Citation35 The quality of raw sequence reads was assessed by FastQC. Adapter sequences were trimmed off the raw sequence reads using Cutadapt. Reads were aligned to the human (hg38) genome using BWA. All obtained data have been uploaded on GEO Omnibus site (GSE247526). Differential expressions were detected using the BIOMEX software.Citation36
We identified the KEGG (Kyoto Encyclopedia of Genes and Genomes) pathways involving the differentially expressed RNA using PathfindRCitation37 and conducted further analysis with R 2023.03.0.
Reverse-transcriptase quantitative polymerase chain reaction (RT-qPCR)
One microgram of RNA was reversed-transcribed (Invitrogen). Quantitative PCR was performed on a QuantStudio3 system (Applied) using Maxima SYBR Green/ROX qPCR Master mix (Thermo Scientific). Each reaction was done in duplicate. Melting curve analysis was performed to ensure the specificity of the amplification. Gene expression was normalized based on the expression of the housekeeping gene encoding the Ribosomal Protein Lateral Stalk Subunit P0 (RPLP0). Primers used are available in table S2.
Chemokine detection by multiplex assay
The supernatants of cocultures were collected after 72 h of infection with MV for IL-1β, IL-6, CXCL8, IFN-α2, IFN-β, IFN-λ1, IFN-λ2/3, IFN-γ, TNF-α, CXCL10, GM-CSF quantification using the LEGENDplex™ Human Anti-Virus Response Panel (BioLegend) according to the manufacturer’s recommendations.
Statistical analysis
Data are presented as the mean ± SEM between biological replicates. Statistical details and the number of biological replicates (n) are displayed in the figure legends. Means of the two groups were compared using the non-parametric Mann-Whitney test. Means of more than two groups were compared with Kruskal-Wallis test. Statistical analysis was performed using GraphPad Prism.
Results
Monocytes cocultured with MPM cell lines differentiate into CD1c-CD206+CD163+ M2-like macrophages.
In a first experiment, we sought to characterize the effect of MPM tumor cells on the phenotype of different subsets of myeloid cells. As myeloid cells, we used monocytes either undifferentiated or differentiated with GM-CSF/IL-4 to obtain dendritic cells (DC), or with GM-CSF or M-CSF to obtain M1-like or M2-like macrophages respectively (hereafter coined as M1 or M2 macrophages). These myeloid cells were cultured alone as control, or cocultured with Meso13 or Meso34 MPM cell lines at a 1:2 (myeloid:MPM) cell ratio (). We then analyzed their phenotypes with high-dimensional flow cytometry using 13 discriminating markers. Our gating strategies and analysis pipeline are shown in Figure S1. After 4 days with MPM cells, we found that the average frequency of CD45+HLA-DR+ cells accounted for 6% to 12% of the total viable cells and displayed phenotypes distinct from MPM cells (). CD45+HLA-DR+ myeloid cells of all donors were grouped into 12 different metaclusters based on their expression of cell markers (). To assess the impact of MPM on the myeloid compartment, both control myeloid cells and myeloid + MPM cocultures were visualized on the same high-dimensional representation (). A small cluster of 172 cells (MC3) was found only in cocultures with Meso13 cells and expressed a low level of CD45 suggesting it was tumor cells. We removed it from subsequent analysis.
Figure 1. MPM cells orient myeloid cells toward an immunosuppressive phenotype. Myeloid cells were cultured alone or with MPM cells for 96 h. They were then analyzed by flow cytometry for the expression of 13 markers. (a) Experimental design. (b) Proportion of myeloid cells (HLADR+CD45+) in cocultures with MPM cells (n = 5 donors for monocytes and DC, n = 6 donors for M1 and M2, 2 MPM cell lines). (c) FlowSOM clustering was performed on live cells (n = 5 donors for monocytes and DC, n = 6 donors for M1 and M2, 2 MPM cell lines). Metaclusters are shown on a UMAP dimensional reduction. (d) FlowSOM clustering was performed on HLA-DR+CD45+cells. Metaclusters are shown on the Opt-SNE dimensional reduction. The number of cells for each metacluster is shown in brackets. (e) The abundance of each culture type in metaclusters was assessed. Groups of metaclusters were annotated with wide shapes. (f) The median of fluorescence intensity (MFI) of each marker on the different metaclusters is normalized by column. (g) Principal component analysis was performed on the previously annotated metaclusters. DC, dendritic cell; GM-CSF, Granulocyte-Macrophage Colony Stimulating Factor; IL4, interleukin 4; M1, M1-like macrophage; M2, M2-like macrophage; MC, metacluster; M-CSF, Macrophage Colony-Stimulating Factor; MPM, Malignant Pleural Mesothelioma.
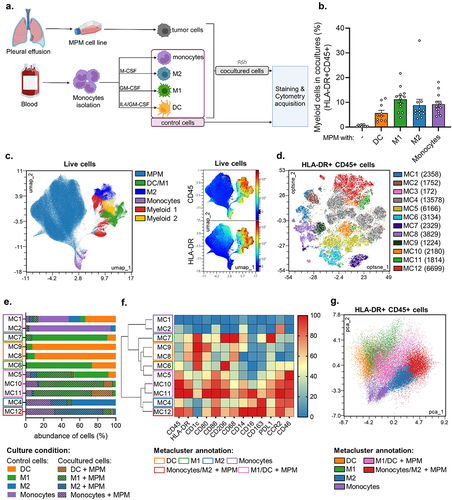
We further annotated the 11 meta-clusters (MC) based on their relative cell abundance of each culture condition, with monocultures hereafter coined as control (). Control monocytes were found in MC1 and MC2 and were CD14lowCD1c-CD206-CD163-. Control DC were found in MC8 and MC9 and were CD1chigh CD206lowCD163–. Control M1 were in MC6 and MC7 and were CD1chighCD206high CD163low. Control M2 were mostly found in MC4 and were CD1c- CD206intCD163high. Upon coculture with MPM, 95.6% of the myeloid cells were present in 5 main meta-clusters (namely MC4, MC5, MC10, MC11, and MC12). Most cocultured monocytes (86,7%) were found into MC4 and MC12 clusters and displayed an M2-like phenotype (CD1c- CD206intCD163high). Cocultured DCs or M1 were enriched in 3 clusters (MC5, MC10 and MC11) and were annotated as one group since they expressed similar markers. They tend to lose CD1c expression and gain CD163 expression suggesting a phenotypic conversion toward the M2-like phenotype (). Interestingly enough, cocultured M2 were in the same cluster (MC4) as the M2 control monoculture, but also appeared in a new cluster (MC12) characterized by the overexpression of many markers (CD45, HLA-DR, CD86, CD206, CD68, CD14 and CD16) (). Finally, a principal component analysis highlights that regardless of their initial phenotype, myeloid cells cultured with MPM tend to differentiate toward an M2-like state (), confirming our previous observations.Citation13 Subsequent analyses from our study thus focus on monocytes and M2 cocultured with MPM cells.
Myeloid cells reduce MV-GFP expression in MPM tumor cells exhibiting an IFN-I production defect and a functional IFNAR signaling pathway
We previously showed in vitro that the spontaneous oncolytic activity of the Schwarz attenuated strain of MV is directed against human MPM cell lines with defects of the antiviral IFN-I response.Citation25 In this study, we found two types of defects that lead to GFP expression by MPM cells after exposure to MV-GFP. On the one hand, some MPM cell lines such as Meso34 are able to produce IFN-I (IFN-α and -β) in response to MV while being weakly permissive to MV replication. On the other hand, some MPM cell lines, like Meso13, are unable to produce IFN-I in response to MV, since their genes that code IFN-I are deleted, and therefore are unable to inhibit GFP expression.Citation26
In the first set of experiments, we determined whether monocytes, M1, M2 or DC cocultured with Meso13 or Meso34 could affect MV-GFP expression in tumor cells. To this end, cocultures were exposed to MV-GFP and three days later we measured GFP expression by flow cytometry to estimate viral genes expression in MPM cells (). After 72 h of MV infection, we found that coculture with CD45+ myeloid cells reduced GFP expression in Meso13, especially with M2 macrophages that inhibit 90,3% of GFP fluorescence in tumor cells. On the other hand, coculture with CD45+ myeloid cells did not affect GFP expression in Meso34.
Figure 2. Myeloid cells reduce GFP expression from MV-GFP in MPM cells without IFN-I genes. Two MPM cell lines, Meso13 or Meso34, were cultured either alone or with myeloid cells. IFN-I genes are deleted in Meso13. Meso34 has probably a defect in ISG production. Cells were infected with MV-GFP at MOI = 1. (a, b) After 72 h, cells were stained as in Figure 1. (b) MV-GFP relative MFI (RMFI) corresponds to the MFI ratio of MV-GFP infected over uninfected MPM cells (HLA-DR or CD45 negative cells). Data are presented as percentage of the RMFI of MPM cells in monocultures (n = 6 donors, Kruskal-Wallis test). (c-d) Cocultures were treated or not with ruxolitinib, an inhibitor of IFNAR signaling, and MV-GFP fluorescence was measured for 10 days (n = 4 donors, Kruskal-Wallis test). (e) Cultures were treated with ruxolitinib or IFN-I. Nuclei were labeled with Hoechst (blue), myeloid cells were stained with anti-CD45 antibody (red) and GFP from MV-GFP replication appears in green. Fluorescence was observed by confocal microscopy (representative images of 6 donors, scale bar = 200 µm). DC, dendritic cell; IFN, Interferon; ISG, Interferon stimulated genes; M1, M1-like macrophage; M2, M2-like macrophage; MOI, multiplicity of infection; Monos, Monocytes; MPM, Malignant Pleural Mesothelioma; MV, Infected with MV; NI, Uninfected. ns, non-significant, * p < 0.05, ** p < 0.001, *** p < 0.001.
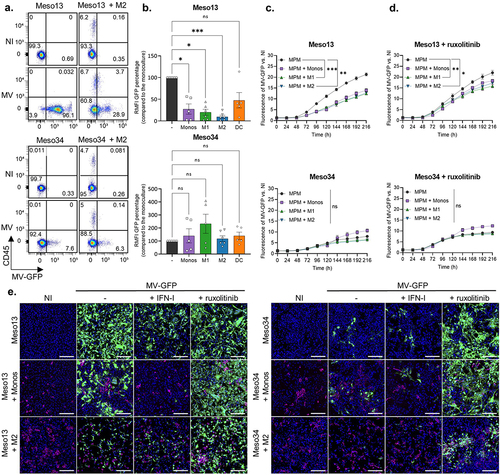
We then measured the kinetics of GFP expression over 10 days after infection in the absence or in the presence of ruxolitinib, a JAK1/2 inhibitor that blocks IFNAR signaling (). We observed that myeloid cells decrease significantly GFP expression in Meso13 and that addition of ruxolitinib restores it. In Meso34, GFP expression is not significantly affected and the addition of ruxolitinib tends to increase it. These results suggest that myeloid cells inhibit viral protein expression in Meso13 through IFN-I production. Indeed, IFN I are able to inhibit GFP expression in Meso 13 whereas, IFN-III have no effect (Figure S2).
We then followed GFP expression in MPM tumor cells cocultured or not with myeloid cells by confocal microscopy. After 72 h of MV infection, we observed that myeloid cells or IFN-I stimulation reduces GFP fluorescence in Meso13 but that the fluorescence can be restored by ruxolitinib (). In Meso34, addition of myeloid cells or IFN-I did not affect GFP fluorescence, while ruxolitinib increased it. Altogether these results show that myeloid cells tend to inhibit viral protein expression in Meso13, whereas they have a smaller effect in Meso34.
When we measured GFP fluorescence in Meso13 cocultured with M2 cells exposed to MV-GFP, we observed a small increase of GFP expression in all the CD45+ cells (). This GFP fluorescence in macrophages is either due to residual GFP expression or to acquisition by phagocytosis of GFP produced by MV-GFP-infected Meso13 tumor cells. Thus, we performed experiments to clarify the source of this GFP (Figure S3). We cultured M2 macrophages alone and infected them with MV-GFP. After 3 days, we observed no fluorescence in these cells. We also cocultured M2 macrophages with Meso13 expressing constitutively the GFP. Three days after MV-GFP infection, we observed that M2 macrophages were GFP positive similarly to what we observed in . These results suggest then that M2 macrophages do not express GFP from MV and that upon MV-GFP infection of Meso13, macrophages may phagocytize GFP-containing cell debris.
MV induces antiviral inflammatory response in myeloid cells cocultured with MPM tumor cells.
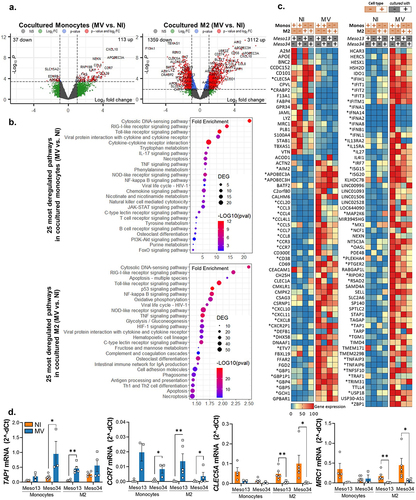
To understand how cocultures with infected MPM cells impact monocytes and M2 function, we analyzed their transcriptomic program by 3’RNA sequencing after magnetic sorting of the cells based on their CD45 expression. We first observed that MV has a more profound transcriptomic impact in M2 than in monocytes cocultured with MPM cell lines (4472 versus 150 significantly deregulated genes, respectively) (). Analysis of the 25 most deregulated pathways by MV in cocultured monocytes or M2 showed that MV activates mainly pro-inflammatory anti-viral pathways such as IFN-I, TNF, IL-17 and necroptosis pathways (, Table S3-S4). In M2 macrophages from MPM cocultures, we also found an activation of pathways associated with antigen presentation such as “cell adhesion”, “phagosome” and “antigen processing and presentation” and a decrease of several metabolic pathways (Table S4). As expected, among the 100 most deregulated genes, we found that MV induces expression of the IFNB1 gene (coding for IFN-β) in monocytes or M2 cocultured with MPM, and several genes encoding IFN-α in monocytes cocultured with Meso13 (). MV infection also activates IFNL1 expression that encodes IL-29 also called IFN-γ1, a type III interferon. As a consequence, MV activates the expression of several interferon stimulated genes (ISG) in myeloid cells such as APOBEC3A, APOBEC3H, IFIH1/T1/T2/T3/TM1, ISG15, ISG20 and MX1. Furthermore, infection induces the expression of numerous chemokine genes such as CCL3, -4, -4L1, -5, -7, -8, and CXCL-8, -10, -11, and some chemokine receptors such as CCR3 and CCR7. We also observed that the expression of some genes is repressed by the virus, such as MRC1 that encodes CD206. Finally, we confirmed and validated by RT-qPCR the expression of four genes of interest CLEC5A, MRC1, CCR7 and TAP1 (). Thus, MV induces an antiviral pro-inflammatory response in M2-like macrophages that were cocultured with MPM cells.
Figure 3. MV induces the expression of antiviral pro-inflammatory pathways in myeloid cells. Meso13 and Meso34 were cultured with monocytes or M2. After 24 h, MPM cells were infected or not with MV at MOI = 1. After 72 h of infection, cells in cocultures were sorted according to CD45 expression. (a-c) a 3’RNA sequencing was performed on each cell type (n = 3 to 7 samples per condition). Gene expression volcano plot (a) the 25 most deregulated pathways (b) or the 100 most deregulated genes in M2 and the 100 most deregulated genes in monocytes (c) upon infection in myeloid (CD45+) cells cocultured with MPM cells are shown. The heatmap is normalized by line. (d) Expression of key markers in myeloid cells was assessed by qPCR (n = 4 to 6 donors, Mann-Whitney test, *p < 0.05, **p < 0.001). M2, M2-like macrophage; MOI, multiplicity of infection; Monos, Monocytes; MPM, Malignant Pleural Mesothelioma; MV, Infected with MV; NI, Uninfected.
MV induces antiviral inflammatory response in MPM cells cocultured with myeloid cells.
In the same transcriptomic experiment, we also analyzed the transcriptomic program of CD45- MPM cells cocultured with monocytes or M2 exposed or not to MV. Infection by MV modulates the expression of thousands of genes in Meso13 and Meso34 cocultured with monocytes or M2 (). MV activates pro-inflammatory anti-viral pathways in cocultured tumor cells such as the IFN-I, the TNF and IL-17 pathways (, Table S5-S6). It also activates pathways implicated in autophagy or cell death such as pyroptosis, apoptosis and inhibits several metabolic pathways. As expected, we found that MV induces the expression of the IFNB1 gene only in Meso34 cocultured with monocytes or M2 as expected, since Meso13 has lost both copies of this gene (). MV activates lots of ISGs in cocultured Meso13 and Meso34 such as RSAD2, MX1/2, OASs and IFITs genes. When we compared ISGs induced in mesothelioma and in myeloid cells, we observed that each cell type has its own ISG profile (Figure S4). Furthermore, MV induced the expression of numerous cytokines such as IL-1A, IL-1B and IL-6 and chemokine genes such as CCL3, -4, -4L1, -4L2, -5, -20 and CCXCL-2, -3, -5, -8, -10 and -11. We also found that the expression of some genes is repressed by the virus, with a stronger decrease in Meso13. These genes belong mainly to the metabolism of steroid hormones and the extracellular matrix proteoglycan pathways.
Figure 4. Upon infection, myeloid cells induce the expression of ISG in MPM cells. Meso13 and Meso34 were cultured with monocytes or M2. After 24 h, MPM cells were infected or not with MV at MOI = 1. After 72 h of infection, tumor cells in cocultures were negatively sorted according to CD45 expression. (a-c) a 3’RNA sequencing was performed on each cell type (n = 6 to 8 samples per condition). Gene expression volcano plot (a), the 25 most deregulated pathways (b), or the 100 most deregulated genes (c) upon infection in MPM cells cocultured with myeloid (CD45+) cells are shown. The heatmap is normalized by line. (d) Expression of three ISG, strictly dependent of IFN-I, were assessed in tumor cells cultured alone or with myeloid cells by qPCR (n = 4 to 6 donors, Kruskal-Wallis test, *p < 0.05, ***p < 0.001). IFN, interferon; ISG, Interferon stimulated genes; M2-like macrophage; MOI, multiplicity of infection; Monos, Monocytes; MPM, Malignant Pleural Mesothelioma; MV, Infected with MV; NI, Uninfected.
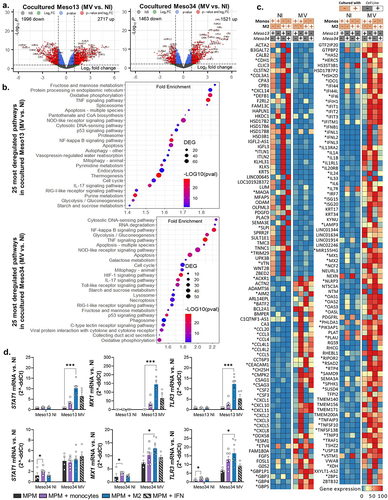
In this transcriptomic analysis, we observed in cocultured Meso13 the expression of some ISGs such as STAT1, MX1 and TLR3 whose expression requires IFN-I. However, Meso13 does not express IFN-I genes (). Thus, the expression of STAT1, MX1 and TLR3 was probably induced by IFN-I secreted from myeloid cells. We confirmed this hypothesis by comparing the expression of these ISG in MPM cells cultured alone versus MPM cells cultured with myeloid cells (). We observed an increased expression of STAT1, MX1 and TLR3 expressions in response to MV, only when Meso13 was cocultured with myeloid cells or exposed to IFN-I.
MV promotes a pro-inflammatory secretome and modulates surface markers expression in myeloid cells cocultured with MPM tumor cells
We found that MV activates the expression of genes encoding cytokines and chemokines in cocultured myeloid cells and MPM cell lines. We next measured secretion of some of these cytokines and chemokines in the supernatants of tumor cells cultured alone or cocultured with monocytes or M2 and infected with MV (). As expected, and observed in the transcriptomic analysis, Meso13 cells was unable to produce IFN-β or IFN-α2 in response to MV, but these two cytokines were produced in the supernatants when myeloid cells were present in the coculture. On the other hand, Meso34 cells was able to produce IFN-I in response to MV and more IFN-α2 was measured in the supernatants when myeloid cells were present. We also observed an increase of IFN-III (IFN-λ1 and -λ2/3) production in response to MV when myeloid cells were present. Il-6 and IL-1-βsecretions were also induced by MV in tumor cells and in myeloid cells. Other cytokines like TNF-α or CXCL10 were found in higher amounts in the supernatants of cocultured myeloid and MPM cells than in those of MPM cells cultured alone. We also observed that in response to MV, Meso13 and Meso34 produced GM-CSF that is probably consumed by myeloid cells, since this cytokine was not found in the supernatants when myeloid cells were present. These results confirm that myeloid cells cocultured with MPM cells are activated by MV and produce numerous cytokines and chemokines, in particular IFN-I.
Figure 5. MV oncolytic action induces pro-inflammatory proteins expression in myeloid cells. (a) MPM cells were cultured alone or with myeloid cells for 96 h. Some of the cocultures were infected with MV at MOI = 1. After 72 h, cytokines secretion was measured in culture supernatants by Biolegend “human anti-virus response” cytokine array (n = 4 donors, Kruskal-Wallis test). Dotted line represents the upper detection limit. (b-e) Myeloid cells were cultured alone or with MPM cells. Some of the cocultures were infected at 24 h with MV-GFP. They were analyzed at 96 h by flow cytometry for the expression of 13 markers. After gating of HLA-DR+CD45+ cells, FlowSOM clustering was performed on cells control and cells cocultured with infected or uninfected MPM cells (n = 5 donors for monocytes and DC, n = 6 donors for M1 and M2, 2 MPM cell lines). (b) Annotations of metaclusters are shown on an Opt-SNE dimensional reduction. (c) Culture conditions (HLA-DR+CD45+ cells: control, cultured with non-infected MPM cells, cultured with MV MPM cells) are shown on an Opt-SNE dimensional reduction. (d) Expression of immune-related molecules on HLA-DR+CD45+cells, annotated in B, cocultured with infected (blue) or uninfected (orange) MPM cells (Mann-Whitney test). (e) Expression of PDL1 on Meso34 infected or not, cocultured with myeloid cells (Mann-Whitney test). DC, dendritic cell; M1, M1-like macrophage; M2, M2-like macrophage; MFI, median of fluorescence; MOI, multiplicity of infection; MPM, Malignant Pleural Mesothelioma; MV, Infected with MV; NI, Uninfected. ns, non-significant, *p < 0.05, **p < 0.001, ***p < 0.001.
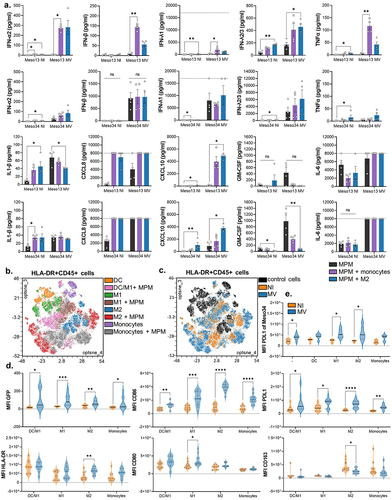
To investigate the phenotypic changes induced by MV on myeloid and tumor cells of the coculture, we used the 13 fluorescence-conjugated antibody panel against different markers. After metaclustering of control cells and cocultured cells, we annotated the metaclusters with the different condition of cultures, following a similar strategy as in (, Figure S1E, Figure S5). We observed a phenotypic shift induced by MV-GFP for all types of myeloid cells cocultured with MPM cells (). This phenotypic shift was characterized by an increase of CD86 and PD-L1 expression in all types of myeloid cells (). The myeloid cells also acquire a slight GFP fluorescence that is probably due to phagocytosis as demonstrated earlier. We also observed an increase of HLA-DR and CD80 expression induced by MV that is significant only for M2 and M1, respectively. CD163 expression is decreased by MV on M2 that had been cocultured with MPM cells. The other markers (CD206, CD14 …) did not significantly move on myeloid cells (Figure S6). Finally, MV also induced the expression of PD-L1 on Meso34 MPM cells (), whereas it did not modify the already high expression of PD-L1 on Meso13 (Figure S7).
Altogether, these results confirm at the protein level the activation of an antiviral inflammatory response in myeloid cells cocultured with MPM cells, leading to the expression of the immunosuppressive protein PD-L1 on tumor and myeloid cells.
Discussion
In this study, we confirmed that MPM cells drive monocytes toward an M2-like phenotype. We then showed that MV is able to activate an inflammatory response in cocultured myeloid and tumor cells characterized by the expression of a large panel of ISGs and the secretion of numerous cytokines and chemokines. Interestingly, different ISG are expressed by MPM cells and myeloid cells, since the ISG profiles are cell type and tissue specific.Citation38 Importantly, MV and MV-GFP induces PD-L1 expression not only in tumor cells, but also in myeloid cells. In return, the inflammatory response of myeloid cells decreases GFP expression in tumor cells, especially in those that are unable to produce IFN-I in response to the virus and that have a functional IFNAR signaling pathway. Despite the impairment of viral protein expression, our results suggest that oncolytic MV may be able to attenuate the TME immunosuppressive properties by shifting tumor-associated myeloid cells toward a more favorable phenotype.
We showed that, when in contact with MPM cells, monocytes differentiate toward an M2-like phenotype with the expression of CD163 and CD206. Furthermore, M1-like macrophages and DCs tend to lose the expression of CD1c in cocultures to express low levels of CD163. These results confirm and extend our previous studies where we showed that MPM cells or pleural effusions promote via M-CSF the differentiation of monocytes into M2-like immunosuppressive macrophages, which block the cytotoxicity of tumor antigen specific CD8+ T cells.Citation13,Citation39 Our results are also in line with histological or flow cytometry studies that demonstrate the presence of CD163+ CD206+ macrophages in MPM tumors.Citation6–8 Thus, we used this coculture model to determine whether M2-like macrophages affect MV oncolytic activity against MPM cells and reciprocally how MV modulates macrophage and tumor cell transcriptome and phenotypes.
In Meso34, GFP expression after infection by MV-GFP was not altered by the presence of macrophages. Indeed, Meso34 produces its own IFN-I and is still able to express viral proteins, but less than Meso13. Defects in IFNAR signaling transduction leading to vesicular stomatitis virus permissiveness are already described.Citation40 However, we showed that exposure to MV induces ISG expression in Meso34 suggesting that IFNAR signaling is at least partly functional, but that only a part of the ISGs necessary to fully block expression of MV genes are induced. After ruxolitinib treatment, the expression of these ISGs is blocked in Meso34 and we observed an increased GFP expression.
We also showed that macrophages, through their IFN-I production, are able to reduce GFP expression in Meso13 MPM cell line, which is unable to produce IFN-I due to the loss of both copies of the genes encoding for IFN-β, IFN-ε, IFN-ω and for the 13 IFN-α.Citation26,Citation41 Meso13 alone in response to MV fails to express several ISGs that we previously described as dependent on IFN-I such as STAT1, MX1 and TLR3.Citation26 Here we show that, in the presence of myeloid cells, Meso13 is able to express these genes, thus reducing GFP expression. We previously estimated that, like Meso13, around 20% of the patients with MPM have tumor cells presenting homologous deletion of the IFN-I locus.Citation26,Citation41 MV genes expression in these cell lines may be impaired, but the induction of an antiviral proinflammatory microenvironment by MV may still have favorable effects. Indeed, it was recently shown in a murine model that similar homologous deletion of CDKN2A/IFN-I genes in pancreatic tumors were more infiltrated by macrophages and less by activated CD8+ T cells compared to CDKN2A HD tumors.Citation42 In humans, deletions of CDKN2A/B and IFN-I genes were recently associated with poor prognosis as it suppresses the immune response in lung adenocarcinoma compared to CDKN2A deletions alone.Citation43 Thus, the TME of MPM tumor with IFN-I HD is thought to be particularly cold and oncolytic immunotherapy appears as a good candidate to make it more favorable to the antitumor immune response by inducing an antiviral proinflammatory microenvironment. It may be tempting to use inhibitors of the IFN-I response such as ruxolitinib to increase viral replication, but they may also disrupt the positive effects of IFN-I on the TME.
In our study, we show that MV induces an antiviral pro-inflammatory response in myeloid cells as well as in tumor cells. MV-GFP decreases the expression of the M2 specific marker CD163 on cocultured monocytes and M2 macrophages, thus suggesting a conversion toward the M1 phenotype. Our results confirm a similar study using a human breast cancer line, where Tan et al. showed that MV induces the modulation of monocyte-derived myeloid cells toward an anti-tumor phenotype.Citation44 It also increases the expression of both co-stimulatory molecules and HLA-DR on all types of co-cultured myeloid cells. Furthermore, MV induces the production of cytokines and chemokines that is more diversified and massive when myeloid cells are present. Some of the chemokines such as CXCL10 and CXCL11 are known to attract effector T cells.Citation45 This chemoattracting effect of MV on T cells and NK has been observed in colorectal and pancreatic cancer mouse model.Citation46–48 In these studies, the authors also showed a synergy of MV virotherapy with anti-PD1 treatment in mice. In humans, the only FDA and EMA approved OV, the T-vec (ImlygicR, Amgen), has been shown to attract immune cells in melanoma tumors notably T cells.Citation49 Our study suggests that MV should be of particular interest to induce T cell infiltration in MPM tumors. However, in these animals and human studies, OVs have been shown to induce PD-L1 expression in tumors that is known to shut down T cell cytotoxicity. In consequence, OVs have been evaluated in combination with anti-PD1 and increase its efficacy.Citation46–49 This increase in PD-L1 expression on tumor and myeloid cells was also observed in our study during MV-GFP infection suggesting that a combination of MV with checkpoint inhibitor immunotherapy may be envisaged to treat mesothelioma with a likely better efficacy than MV alone.
In conclusion, our study characterizes the interplay of MV with human MPM cells and M2-like macrophages. MV can have negative effects on myeloid cells, by decreasing viral genes expression and inducing PD-L1 expression, but also positive effects by developing an antiviral pro-inflammatory response that can remodel the MCT and promote the antitumor immune response. Thus, oncolytic MV may be an interesting candidate for MPM treatment, especially in the context of immunotherapy.
Authors’ contributions
Conceptualization: CCh, MG, JFF; Performed experiments: CCh, LB, MG, JF, JN; Data analysis: CCh, LB, JF, NJ; Writing-original draft: CCh, JFF; Writing-review&editing: CCh, JFF, LT, DF, CB, NB, NJ, UH, TP; Funding acquisition: EPT, LT, DF, CB, NB, JFF, FT.
TableS4.xlsx
Download MS Excel (25.4 KB)TableS2.xlsx
Download MS Excel (11.1 KB)TableS3.xlsx
Download MS Excel (12.7 KB)TableS5.xlsx
Download MS Excel (25.2 KB)TableS6.xlsx
Download MS Excel (23.5 KB)FiguresSup.pdf
Download PDF (4.3 MB)TableS1.xlsx
Download MS Excel (10.1 KB)Acknowledgments
The authors acknowledge the Cytocell-Flow Cytometry and FACS core facility (SFR Bonamy, BioCore, Inserm UMS 016, CNRS UAR 3556, Nantes, France) for its technical expertise and help, member of the Scientific Interest Group (GIS) Biogenouest and the Labex IGO program supported by the French National Research Agency (n°ANR-11-LABX-0016-01). We thank IBISA MicroPICell facility (Biogenouest), member of the national infrastructure France-Bioimaging supported by the French national research agency (ANR-10-INBS-04) and the Genomics Core Facility GenoA, member of the Biogeneouest and Institut Français de Bioinformatique (IFB)(ANR-11-INBS-0013). We thank Sophie Deshayes for the establishment of the malignant pleural mesothelioma cell lines and Maureen Labbé for her help with bioinformatics analysis. Schematics were created with Biorender.com.
Disclosure statement
FT and JFF are authors of patents on MV. FT owns equity in Oncovita, an oncolytic virotherapy company.
Data availability statement
The transcriptomic data that support the findings of this study are available online on the GEO Omnibus site (GSE247526). Other raw data and materials can be made available upon reasonable request to the corresponding author.
Supplementary material
Supplemental data for this article can be accessed online at https://doi.org/10.1080/2162402X.2024.2377830
Additional information
Funding
References
- Yap TA, Aerts JG, Popat S, Fennell DA. Novel insights into mesothelioma biology and implications for therapy. Nat Rev Cancer. 2017;17(8):475–14. doi:10.1038/nrc.2017.42.
- Popat S, Baas P, Faivre-Finn C, Girard N, Nicholson AG, Nowak AK, Opitz I, Scherpereel A, Reck M. Malignant pleural mesothelioma: ESMO clinical practice guidelines for diagnosis, treatment and follow-up☆. Ann Of Oncol. 2022;33(2):129–142. doi:10.1016/j.annonc.2021.11.005.
- Govindan R, Aggarwal C, Antonia SJ, Davies M, Dubinett SM, Ferris A, Forde PM, Garon EB, Goldberg SB, Hassan R. et al. Society for Immunotherapy of cancer (SITC) clinical practice guideline on immunotherapy for the treatment of lung cancer and mesothelioma. J Immunother Cancer. 2022;10(5):e003956. doi:10.1136/jitc-2021-003956.
- Baas P, Scherpereel A, Nowak AK, Fujimoto N, Peters S, Tsao AS, Mansfield AS, Popat S, Jahan T, Antonia S. et al. First-line nivolumab plus ipilimumab in unresectable malignant pleural mesothelioma (CheckMate 743): a multicentre, randomised, open-label, phase 3 trial. The Lancet. 2021;397(10272):375–386. doi:10.1016/S0140-6736(20)32714-8.
- Cristescu R, Mogg R, Ayers M, Albright A, Murphy E, Yearley J, Sher X, Liu XQ, Lu H, Nebozhyn M. et al. Pan-tumor genomic biomarkers for PD-1 checkpoint blockade–based immunotherapy. Science. 2018;362(6411):eaar3593. doi:10.1126/science.aar3593.
- Minnema-Luiting J, Vroman H, Aerts J, Cornelissen R. Heterogeneity in Immune Cell Content in Malignant Pleural Mesothelioma. Int J Mol Sci. 2018;19(4):1041. doi:10.3390/ijms19041041.
- Marcq E, Siozopoulou V, De Waele J, van Audenaerde J, Zwaenepoel K, Santermans E, Hens N, Pauwels P, van Meerbeeck JP, Smits ELJ. Prognostic and predictive aspects of the tumor immune microenvironment and immune checkpoints in malignant pleural mesothelioma. OncoImmunology. 2017;6(1):e1261241. doi:10.1080/2162402X.2016.1261241.
- Klampatsa A, O’Brien SM, Thompson JC, Rao AS, Stadanlick JE, Martinez MC, Liousia M, Cantu E, Cengel K, Moon EK. et al. Phenotypic and functional analysis of malignant mesothelioma tumor-infiltrating lymphocytes. OncoImmunology. 2019;8(9):e1638211. doi:10.1080/2162402X.2019.1638211.
- Circulating and tumor‐infiltrating myeloid cells predict survival in human pleural mesothelioma - Burt - 2011 - Cancer - Wiley Online Library; accessed 2023 Oct 11]. https://acsjournals-onlinelibrary-wiley-com.proxy.insermbiblio.inist.fr/doi/10.1002/cncr.26143.
- Schinwald A, Donaldson K. Use of back-scatter electron signals to visualise cell/nanowires interactions in vitro and in vivo; frustrated phagocytosis of long fibres in macrophages and compartmentalisation in mesothelial cells in vivo. Part Fibre Toxicol. 2012;9(1):1–14. doi:10.1186/1743-8977-9-34.
- Dostert C, Pétrilli V, Van Bruggen R, Steele C, Mossman BT, Tschopp J. Innate immune activation through nalp3 inflammasome sensing of asbestos and silica. Science. 2008;320(5876):674–677. doi:10.1126/science.1156995.
- Chéné A-L, d’Almeida S, Blondy T, Tabiasco J, Deshayes S, Fonteneau J-F, Cellerin L, Delneste Y, Grégoire M, Blanquart C. Pleural effusions from patients with mesothelioma induce recruitment of monocytes and their differentiation into M2 macrophages. J Thorac Oncol: Off Publ Of The Int Assoc For The Study Of Lung Cancer. 2016;11(10):1765–1773. doi:10.1016/j.jtho.2016.06.022.
- Blondy T, d’Almeida SM, Briolay T, Tabiasco J, Meiller C, Chéné A-L, Cellerin L, Deshayes S, Delneste Y, Fonteneau J-F. et al. Involvement of the M-CSF/IL-34/CSF-1R pathway in malignant pleural mesothelioma. J Immunother Cancer. 2020;8(1):e000182. doi:10.1136/jitc-2019-000182.
- Shek D, Gloss B, Lai J, Ma L, Zhang HE, Carlino MS, Mahajan H, Nagrial A, Gao B, Read SA. et al. Identification and characterisation of infiltrating immune cells in malignant pleural mesothelioma using spatial transcriptomics. Methods And Protocol. 2023;6(2):35. doi:10.3390/mps6020035.
- Bejarano L, Mjc J, Joyce JA. Therapeutic targeting of the tumor microenvironment. Cancer Discov. 2021;11(4):933–959. doi:10.1158/2159-8290.CD-20-1808.
- Wang N, Liang H, Zen K. Molecular Mechanisms That Influence the Macrophage M1–M2 Polarization Balance. Front Immunol. 2014;5. doi:10.3389/fimmu.2014.00614.
- Wu L, Kohno M, Murakami J, Zia A, Allen J, Yun H, Chan M, Baciu C, Liu M, Serre-Beinier V. et al. Defining and targeting tumor-associated macrophages in malignant mesothelioma. Proc Natl Acad Sci U S A. 2023;120(9):e2210836120. doi:10.1073/pnas.2210836120.
- Shalhout SZ, Miller DM, Emerick KS, Kaufman HL. Therapy with oncolytic viruses: progress and challenges. Nat Rev Clin Oncol. 2023;20(3):160–177. doi:10.1038/s41571-022-00719-w.
- Achard C, Surendran A, Wedge ME, Ungerechts G, Bell J, Ilkow CS. Lighting a fire in the tumor microenvironment using oncolytic immunotherapy. EBioMedicine. 2018;31:17–24. doi:10.1016/j.ebiom.2018.04.020.
- Msaouel P, Opyrchal M, Dispenzieri A, Peng KW, Federspiel MJ, Russell SJ, Galanis E. Clinical trials with oncolytic measles virus: Current status and future prospects. Curr Cancer Drug Targets. 2018;18(2):177–187. doi:10.2174/1568009617666170222125035.
- Gauvrit A, Brandler S, Sapede-Peroz C, Boisgerault N, Tangy F, Gregoire M. Measles virus induces oncolysis of mesothelioma cells and allows dendritic cells to cross-prime tumor-specific CD8 response. Cancer Res. 2008;68(12):4882–4892. doi:10.1158/0008-5472.CAN-07-6265.
- Donnelly OG, Errington-Mais F, Steele L, Hadac E, Jennings V, Scott K, Peach H, Phillips RM, Bond J, Pandha H. et al. Measles virus causes immunogenic cell death in human melanoma. Gene Ther. 2011;20(1):7–15. doi:10.1038/gt.2011.205.
- Guillerme JB, Boisgerault N, Roulois D, Menager J, Combredet C, Tangy F, Fonteneau JF, Gregoire M. Measles virus vaccine-infected tumor cells induce tumor antigen cross-presentation by human plasmacytoid dendritic cells. Clin Cancer Res. 2013;19(5):1147–1158. doi:10.1158/1078-0432.CCR-12-2733.
- Achard C, Guillerme J-B, Bruni D, Boisgerault N, Combredet C, Tangy F, Jouvenet N, Grégoire M, Fonteneau J-F. Oncolytic measles virus induces tumor necrosis factor-related apoptosis-inducing ligand (TRAIL)-mediated cytotoxicity by human myeloid and plasmacytoid dendritic cells. Oncoimmunology. 2017;6(1):e1261240. doi:10.1080/2162402x.2016.1261240.
- Achard C, Boisgerault N, Delaunay T, Roulois D, Nedellec S, Royer P-J, Pain M, Combredet C, Mesel-Lemoine M, Cellerin L. et al. Sensitivity of human pleural mesothelioma to oncolytic measles virus depends on defects of the type I interferon response. Oncotarget. 2015;6(42):44892–44904. doi:10.18632/oncotarget.6285.
- Delaunay T, Achard C, Boisgerault N, Grard M, Petithomme T, Chatelain C, Dutoit S, Blanquart C, Royer P-J, Minvielle S. et al. Frequent homozygous deletions of type I Interferon genes in pleural mesothelioma confer sensitivity to oncolytic measles virus. J Thorac Oncol: Off Publ Of The Int Assoc For The Study Of Lung Cancer. 2020;15(5):827–842. doi:10.1016/j.jtho.2019.12.128.
- Gueugnon F, Leclercq S, Blanquart C, Sagan C, Cellerin L, Padieu M, Perigaud C, Scherpereel A, Gregoire M. Identification of novel markers for the diagnosis of malignant pleural mesothelioma. The Am J Pathol. 2011;178(3):1033–1042. doi:10.1016/j.ajpath.2010.12.014.
- Combredet C, Labrousse V, Mollet L, Lorin C, Delebecque F, Hurtrel B, McClure H, Feinberg MB, Brahic M, Tangy F. A molecularly cloned schwarz strain of measles virus vaccine induces strong immune responses in macaques and transgenic mice. J Virol. 2003;77(21):11546–11554. doi:10.1128/JVI.77.21.11546-11554.2003.
- Monaco G, Chen H, Poidinger M, Chen J, de Magalhães Jp, Larbi A, de Magalhães JP. flowAI: automatic and interactive anomaly discerning tools for flow cytometry data. Bioinformatics. 2016;32(16):2473–2480. doi:10.1093/bioinformatics/btw191.
- Van Gassen S, Callebaut B, Van Helden MJ, Lambrecht BN, Demeester P, Dhaene T, Saeys Y. FlowSOM: Using self-organizing maps for visualization and interpretation of cytometry data. Cytometry A. 2015;87(7):636–645. doi:10.1002/cyto.a.22625.
- McInnes L, Healy J, Saul N, Großberger L. UMAP: Uniform Manifold Approximation and Projection. J Open Source Softw. 2018;3(29):861. doi:10.21105/joss.00861.
- Belkina AC, Ciccolella CO, Anno R, Halpert R, Spidlen J, Snyder-Cappione JE. Automated optimized parameters for T-distributed stochastic neighbor embedding improve visualization and analysis of large datasets. Nat Commun. 2019;10(1):5415. doi:10.1038/s41467-019-13055-y.
- Pearson KL. LIII. on lines and planes of closest fit to systems of points in space. The Lond, Edinburgh, And Dublin Phil Mag And J Sci. 1901;2(11):559–572. doi:10.1080/14786440109462720.
- Schindelin J, Arganda-Carreras I, Frise E, Kaynig V, Longair M, Pietzsch T, Preibisch S, Rueden C, Saalfeld S, Schmid B. et al. Fiji: an open-source platform for biological-image analysis. Nat Methods. 2012;9(7):676–682. doi:10.1038/nmeth.2019.
- Charpentier E, Cornec M, Dumont S, Meistermann D, Bordron P, David L, Redon R, Bonnaud S, Bihouée A. 3’ RNA sequencing for robust and low-cost gene expression profiling. [2021 Jan 28]. doi:10.21203/rs.3.pex-1336/v1.
- Taverna F, Goveia J, Karakach TK, Khan S, Rohlenova K, Treps L, Subramanian A, Schoonjans L, Dewerchin M, Eelen G. et al. BIOMEX: an interactive workflow for (single cell) omics data interpretation and visualization. Nucleic Acids Res. 2020;48(W1):W385–W394. doi:10.1093/nar/gkaa332.
- Ulgen E, Ozisik O, Ou S. pathfindR: An R Package for Comprehensive Identification of Enriched Pathways in Omics Data Through Active Subnetworks. Front Genet. 2019;10:10. doi:10.3389/fgene.2019.00858.
- Schneider WM, Chevillotte MD, Rice CM. Interferon-stimulated genes: a complex web of host defenses. Annu Rev Immunol. 2014;32(1):513–545. doi:10.1146/annurev-immunol-032713-120231.
- Lievense LA, Cornelissen R, Bezemer K, Kaijen-Lambers MEH, Jpjj H, Jgjv A. Pleural effusion of patients with malignant mesothelioma induces macrophage-mediated T cell suppression. J Thorac Oncol. 2016;11(10):1755–1764. doi:10.1016/j.jtho.2016.06.021.
- Stojdl DF, Lichty B, Knowles S, Marius R, Atkins H, Sonenberg N, Bell JC. Exploiting tumor-specific defects in the interferon pathway with a previously unknown oncolytic virus. Nat Med. 2000;6(7):821–825. doi:10.1038/77558.
- Grard M, Chatelain C, Delaunay T, Pons-Tostivint E, Bennouna J, Fonteneau JF. Homozygous Co-Deletion of Type I Interferons and CDKN2A genes in thoracic cancers: Potential consequences for therapy. Front Oncol. 2021;11:695770. doi:10.3389/fonc.2021.695770.
- Barriga FM, Tsanov KM, Ho Y-J, Sohail N, Zhang A, Baslan T, Wuest AN, Del Priore I, Meškauskaitė B, Livshits G. et al. MACHETE identifies interferon-encompassing chromosome 9p21.3 deletions as mediators of immune evasion and metastasis. Nat Cancer. 2022;3(11):1367–1385. doi:10.1038/s43018-022-00443-5.
- Peng Y, Chen Y, Song M, Zhang X, Li P, Yu X, Huang Y, Zhang N, Ji L, Xia L. et al. Co-occurrence of CDKN2A/B and IFN-I homozygous deletions correlates with an immunosuppressive phenotype and poor prognosis in lung adenocarcinoma. Mol Oncol. 2022;16(8):1746–1760. doi:10.1002/1878-0261.13206.
- Tan DQ, Zhang L, Ohba K, Ye M, Ichiyama K, Yamamoto N. Macrophage response to oncolytic paramyxoviruses potentiates virus-mediated tumor cell killing. Eur J Immunol. 2016;46(4):919–928. doi:10.1002/eji.201545915.
- Karin N. CXCR3 Ligands in Cancer and Autoimmunity, Chemoattraction of Effector T Cells, and Beyond. Front Immunol. 2020;11:11. doi:10.3389/fimmu.2020.00976.
- Veinalde R, Pidelaserra-Martí G, Moulin C, Tan CL, Schäfer TE, Kang N, Ball CR, Leichsenring J, Stenzinger A, Kaderali L. et al. Virotherapy combined with anti-PD-1 transiently reshapes the tumor immune environment and induces anti-tumor immunity in a preclinical PDAC model. Front Immunol. 2023;13. doi:10.3389/fimmu.2022.1096162.
- Backhaus PS, Veinalde R, Hartmann L, Dunder JE, Jeworowski LM, Albert J, Hoyler B, Poth T, Jager D, Ungerechts G. et al. Immunological effects and viral gene expression determine the efficacy of oncolytic measles vaccines encoding IL-12 or IL-15 Agonists. Viruses. 2019;11(10):914. doi:10.3390/v11100914.
- Busch E, Kubon KD, Mayer JKM, Pidelaserra-Martí G, Albert J, Hoyler B, Heidbuechel JPW, Stephenson KB, Lichty BD, Osen W. et al. Measles Vaccines Designed for enhanced CD8+ T Cell Activation. Viruses. 2020;12(2):242. doi:10.3390/v12020242.
- Ribas A, Dummer R, Puzanov I, VanderWalde A, Andtbacka RHI, Michielin O, Olszanski AJ, Malvehy J, Cebon J, Fernandez E. et al. Oncolytic virotherapy promotes intratumoral T cell infiltration and improves Anti-PD-1 Immunotherapy. Cell. 2018;174(4):1031–1032. doi:10.1016/j.cell.2018.07.035.