
 ?Mathematical formulae have been encoded as MathML and are displayed in this HTML version using MathJax in order to improve their display. Uncheck the box to turn MathJax off. This feature requires Javascript. Click on a formula to zoom.
Abstract
This study aims to investigate the chloride diffusion behavior of alkali activated slag and fly ash blends with different contents of waste glass powder (GP) addition. The reaction heat flow of alkali activated slag/fly ash/waste glass is characterized. The reaction products are determined by X-ray diffraction and thermogravimetric analysis (TGA). N2 adsorption analysis (BET) is used to evaluate the microstructure of samples. The accelerated chloride penetration test (ACPT) is applied to study the chloride resistance of the AAMs. Subsequently, the leaching test of chloride penetrated samples are conducted and ion chromatography is utilized to measure the chloride content in the samples. According to the BET results, the total volume of mesopores decreases with increasing GP content. The results of ACPT show that the increasing GP in AAMs shows an enhancement of chloride resistance.
1. Introduction
Alkali activated materials (AAMs) are regarded as potential alternatives to substitute ordinary Portland cement (OPC) due to their sustainability and high resistance to chemical attacks [Citation1]. In the past decades, the utilization of ground granulated blast-furnace slag (GGBS) and fly ash (FA) showed tangible value towards environmental concerns as the replacement of cement [Citation2]. Meanwhile, waste glass powder (GP) was largely generated worldwide annually [Citation3]. However, the low recycling rate of GP led to the large amount of GP disposed into landfills [Citation4]. The alkali activation of GP showed a promising opportunity in previous studies [Citation4,Citation5]. Moreover, alkali activated GGBS, FA, and GP have been intensively investigated [Citation6,Citation7]. The reaction process, mechanical properties, and shrinkage of alkali activated GGBS/FA/GP have been determined [Citation8–10]. While long-term durability is important to evaluate the performance of building materials, especially the resistance to chloride penetration [Citation11]. The mechanism of alkali activated slag/fly ash with the blending of additional GP is still insufficient in terms of chloride transport, it limits the application of waste glass in AAMs.
Chloride resistance is one of the critical properties for cementitious and alkali activated materials, since chloride penetration may result in the corrosion of steel bar [Citation12–14]. The microstructure influences the chloride ion diffusion process in the matrix, for example, the chloride transport route and chloride absorption of micropores in the materials [Citation15]. Liu et al. [Citation7] investigated the chloride binding capacity of high volume waste glass in cement-based blends. The chloride migration coefficient decreases with higher waste glass content, resulting in enhanced chloride resistance. Puertas and Torres-Carrasco [Citation16] used waste glass as an activator to prepare alkali activated slag, the results showed that the strength and microstructure were comparable to NaOH/Na2CO3 activated slag. A small amount of waste glass particles incorporation yielded the dense microstructure of concrete by the gel formation of waste glass activation [Citation17]. The participation of waste GP refines the microstructure, subsequently, enhances the mechanical performance and durability of cementitious materials. However, limited investigations in the mechanism of long-term durability in terms of the GP addition, especially the chloride transport mechanism of GP blended AAM binders is still not clear.
The wide range in the pore size distribution of AAMs is an important feature to evaluate the porosity and tortuosity [Citation18,Citation19]. Furthermore, the pore structure strongly influences chloride transport in the matrix. Previous studies have summarized how the waste glass influences the reaction process and, subsequently, the microstructure. The Krstulovic–Dabic model was used to describe the influence of waste GP on hydration kinetics including the nucleation and crystal growth (NG), interactions at phase boundary (I), and diffusion (D) [Citation20]. The NG process guarantees the early development of microstructure while the I and D process supplies the subsequent microstructure evolution [Citation21]. Briefly, hydration behavior is the key factor of microstructural development.
The majority compositions of waste glass are Na2O, CaO, and reactive SiO2 [6,Citation16]. The additional reactive SiO2 resources in the waste glass has the potential to promote the gel formation and improve the microstructure. Consequently, the mechanical properties and chloride resistance can be improved [Citation22]. Torres-Carrasco and Puertas [Citation23] reported that the majority reaction products of activated waste glass are Si-high, Al- and Ca low gels. The calcium aluminosilicate hydrates (C-A-S-H), and sodium aluminosilicate hydrates (N-A-S-H) predominated the gel formation in the alkali activated waste glass matrix. The calcium silicate hydrates (C-S-H) and calcium aluminosilicate hydrates (C-A-S-H) grew on the surface of some crystals showing the homogenous status [Citation24]. Meanwhile, the fan-like texture of the gel was about 3 nm or lower in their dimension. The evolution of microstructure was influenced by the formation of reaction products, especially on the mesopores (2–50 nm) scale [Citation24]. Overall, hydration products, reaction processes, and microstructure should be profoundly investigated to discuss the mechanism of chloride transport in alkali activated slag/fly ash incorporating GP. Since these important parameters influence the chloride transport lacking in-depth investigation.
This study aims to investigate the chloride transport mechanism of alkali activated slag/fly ash/waste glass blends. The reaction heat flow is determined to study the reaction kinetics, meanwhile, the reaction products are characterized. The microstructure, mechanical performance (in the Supporting Information), and chloride diffusion are investigated. Furthermore, the chloride transport in the pore structure is discussed based on the experimental results. The addition of waste glass is proved to enhance the chloride resistance of AAMs.
2. Materials and methods
2.1. Starting materials
Ground granulated blast-furnace slag (GGBS), Class F fly ash (FA), and waste GP were utilized in this study. The mixed color glass fractions were collected by a glass recycling plant and grounded into GP by ball milling. The chemical compositions were determined by X-ray fluorescence (XRF), as shown in . The X-ray diffraction (XRD) graphs of GGBS, FA, and GP utilized in this study are shown in .
Figure 1. X-ray diffractogram of (a) GGBS; (b) FA; (c) GP.
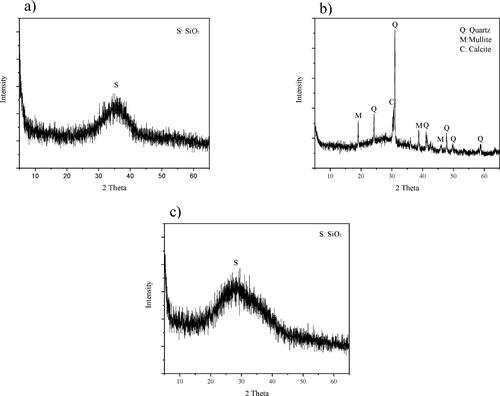
Table 1. Chemical composition and physical properties of waste glass, GGBS, and Fly ash.
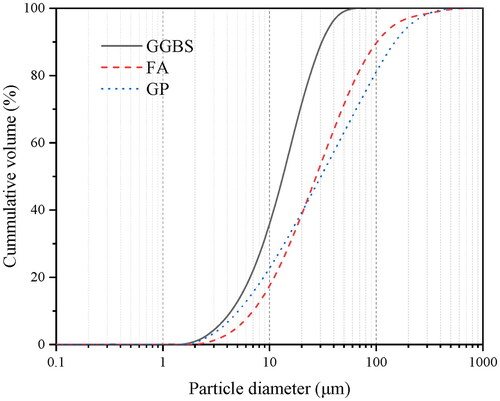
The particle size distribution (PSD) of the powder feedstocks were determined by laser granulometry, using a Master Sizer laser granulometry with an open measuring cell. The preparation of the powders was done by wet dispersion in deionized water. The particle size distribution of GGBS, FA, and GP are shown in . The D50 particle sizes of GGBS, FA, and GP are 16 μm, 27 μm, and 28 μm, respectively.
Figure 2. The particle size distribution of GGBS, FA, and GP.
The activator used in this study was the 4 mol/L sodium hydroxide solution. The analytical grade sodium hydroxide pellets (99% purity) were dissolved in deionized water. And the activator was prepared 24 h before it was used to cast pastes and mortars.
2.2. Sample preparations
The GGBS/FA weight ratio of AAM is 7:3, while the waste GP replaces the fly ash in AAMs from 10 wt. % to 30 wt. % (see the sample IDs in ), so the GGBS/(FA + GP) weight ratio is constantly 7:3. The starting raw materials were mixed with the designed proportion in the concrete mixer following the preparation procedure suggested by EN 196-1 [Citation25]. The mortars were produced by adding sand, and (GGBS + FA + GP)/Sand = 1/3. Mortar samples for mechanical testing were cast in the 40 mm × 40 mm × 160 mm prism mold followed by the vibration. While the mortar samples for chloride diffusion were cast in Ø 100 mm × 200 mm cylinder mold followed by the vibration. After 24 h, the pastes and mortars were unmolded and were sealed by plastic cover. Then, samples were cured on the sample shelf in the ambient temperature (20 °C) until the age of 28 days.
Table 2. Formulations of the mortar samples.
The chemical composition of different sample binders can be calculated, and the Al/Si, Na/Si, and Na/Al molar ratios of Ref, GP10, GP20, and GP30 are presented in .
Table 3. The elemental molar ratio of samples (without activator).
2.3. Testing methods
2.3.1. Isothermal calorimetry
The heat flow of the samples by different precursors was measured by isothermal calorimetry set at 20 °C (TAM AIR Calorimetry). It was noteworthy that the initial 45 min after mixing could not be measured due to the sample preparation procedure and deviation. The results were normalized by the mass of the solids.
2.3.2. X-ray diffractometry
X-ray diffractometry (XRD) was performed by using the Bruker D4 Phaser instrument with Co-Kα radiation (40 kV, 30 mA). The pressed powdered specimens were measured with a step size of 0.05° and a counting time of 1 s/step, from 10° to 90° 2θ.
2.3.3. Thermogravimetry
The Thermogravimetric (TG) test was conducted by using the STA 449 F1 instrument, at a heating rate of 10 °C/min, to samples of ≈ 100 mg. Experiments were carried out from 40 °C to 1000 °C, during the test process, the gas N2 was used as the carrier gas.
2.3.4. Nitrogen adsorption test
The nitrogen sorption tests were conducted by TriStar II 3020, Micromeritics. The pore size distribution was carried out by the Barett, Jonyer, and Halenda (BJH) method [Citation26] from the desorption branch. Before the test, 28-day paste samples were ground to powder and the samples were immersed in the 2-propanol for 24 h to stop the hydration process, then dried to constant mass at 60 °C for 3 days in the drying oven.
2.3.5. Mercury intrusion porosimetry
The samples for the mercury intrusion porosity (MIP) analysis were selected from mortars, with dimensions ranging from 3 to 5 mm. The selected samples were immersed in the 2-propanol for 24 h to cease the hydration process and then put in the vacuum drying oven at 60 °C for 3 days to remove all the pore water. The MIP tests were conducted by using a Micromeritics Autopore 9600 Mercury Porosimeter. (The results of MIP are presented in Supporting Information)
2.3.6. Scanning electron microscopy
The microstructure of the samples was characterized by a scanning electron microscopy (SEM) instrument. The paste particles around 1–2 cm dimensions are selected at the specific curing days. Then the samples were ground with consecutively fine abrasive papers from 200 to 4000 grit, which was followed by gold coating 30 s at the currency of 30 mA. The testing samples were put in Backscattered Electrons (BSE) mode at the voltage of 15 kV. The mortar samples were selected from prepared samples dried in the drying oven at 60 °C for 24 h. (The results of SEM are presented in Supporting Information.)
2.3.7. Compressive strength and flexural strength
After 28 days of curing, the compressive strength of the samples was determined according to EN 196-1 [Citation27]. The samples were centered on the testing area of the machine. Subsequently, the load was increased smoothly at the rate of 2400 N/s over the entire load application until the fracture.
The flexural strength was also determined according to EN 196-1 [Citation27]. Place the specimen with one of its faces (which had been cast against the steel of the mold) on the supporting rollers. The load was applied without shock at a uniform rate of 50 N/s and the failure occurred within a period of 30 s to 90 s.
(The results of mechanical property are presented in Supporting Information.)
2.3.8. Accelerated chloride penetration test
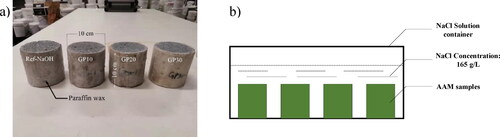
The Ø 100 mm × 200 mm cylinder mortars were cast and cut into 100 ± 2 mm thick slices. The accelerated chloride penetration test (ACPT) procedure was followed by NT Build 443 [Citation28]. The cylinder mortars were sealed by the paraffin wax on the side and bottom surfaces, and the top surface was not sealed for exposure to the NaCl solution. An aqueous NaCl solution was prepared with a concentration of 165 g ± 1 g NaCl per dm3 solution. The temperature of the water bath was 21–25 °C with a target average temperature of 23 °C. The container was completely filled with the exposed liquid and closed tightly. The exposure lasted for 5 weeks, and the container was shaken once a week. The cylinder mortars and NaCl solution containers are shown in .
Figure 3. Accelerated chloride penetration test: (a) AAM samples; (b) Immersed setup.
The apparent chloride diffusion was obtained by fitting EquationEq. (1)(1)
(1)
(1)
(1)
where
is the chloride concentration, measured at the depth
at the exposure time
in mass %.
is the boundary condition at the exposed surface in mass %.
is the initial chloride concentration measured on the concrete slice at time t = 0 in mass %.
is the depth below the exposed surface in m.
is the effective chloride transport coefficient in m2/s. t is the exposure time in second. Erf is the error function defined in EquationEq. (2)
(2)
(2) .
(2)
(2)
2.3.9. Leaching - ion chromatography
The chloride content of samples after ACPT was determined by combining leaching and ion chromatography (IC) tests. The powder samples were drilled after ACPT by depth from 1 to 5 cm, and the thickness of every layer was 1 cm. The leaching tests were performed with demineralized water on materials with a particle size <4 mm and at a liquid to solid ratio of 2/l. The process of one batch leaching test was followed by EN 12457 part 1 [Citation29]. In the leaching step, the contact time was 24 h. After the leaching test, the leachate of the solution was filtrated through a 0.45 μm filter.
The concentration of chloride in powder samples was analyzed by IC (Dionex 1100) equipped with an ion-exchange column AS9-HS (2 × 250 mm). The leachate of the solution was used to determine the chloride ion concentration. The accuracy of chloride determination by the leaching-IC method had been proved by a previous study [Citation30].
3. Results and discussion
3.1. Reaction kinetics
The typical reactions stages of AAMs are (a) destruction-coagulation, (b) coagulation-condensation, and (c) condensation-crystallization [Citation31]. The first reaction heat peak corresponds to (a) destruction-coagulation, while the second peak corresponds to (b) coagulation-condensation. The time to reach the reaction peak (TRRP) is defined as the time to reach the second heat peak, and it is the gelation process in AAM systems. The normalized reaction heat flow, normalized peak intensity, and TRRP of AAMs are shown in . With a higher content of waste GP replacement, the reaction heat peak height is slightly increasing, while the TRRP decreases.
Figure 4. (a) Normalized heat evolutions of paste mixtures; (b) Normalized peak height and time to reach the reaction peak.
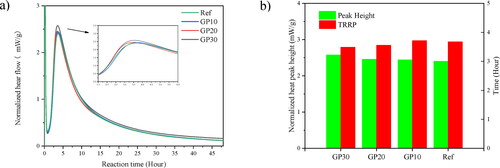
,b show that the normalized reaction heat heights of the AAM pastes are close to each other. The slight differences can be seen from . The waste glass-based binder (GP30) takes a shorter TRRP by 0.2 h than the reference paste. The high amount of fly ash can reduce the Ca2+ ions in the pore structure of the system, thereby prolonging the induction period [Citation6,Citation32]. Oppositely, the reactive SiO2 in waste GP increases the total content of SiO2 in the matrix, thus the dissolution process of Si-O and Al-O tetrahedrons in waste glass-based blends could be faster than the fly ash-based blends [Citation33]. Furthermore, the normalized peak height is also increased by the increasing content of waste GP replacement. The decreasing reactive Na/Si molar ratio and increasing Na/Al molar ratio both influence the total peak height positively. While, the slight differences are due to the physical effect of GP particle size, which influences the dissolution of reactive SiO2 in waste GP [Citation34,Citation35].
3.2. Reaction products
3.2.1. X-ray diffractograms
The XRD pattern is presented to investigate the effect of GP additions in GGBS/FA based matrices. The reaction products of specimens after 28 curing days are presented in the XRD graph ().
Figure 5. XRD pattern of GGBS/FA paste mixtures with different GP replacement at 28 days.
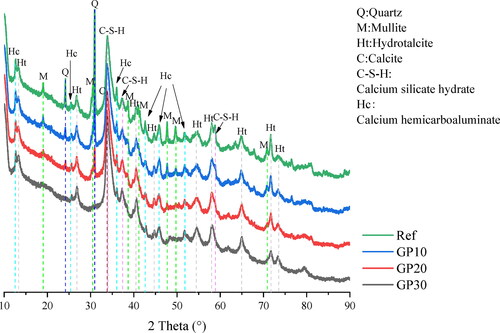
In all AAM samples, the Calcium silicate hydrates (C-S-H) is predominantly amorphous gel. The intensity of C-S-H is similar among the AAM samples, which can be explained by the fact that the large proportions of GGBS predominate the alkali activation process. The characteristic peak of C-S-H is found at 33.880°, corresponding to (PDF# 00-006-0010). The C-S-H is the reaction product of alkali activated GGBS dominated matrices, which is in agreement with previous studies [Citation6,Citation36]. The lack of Al resource from the precursors drives the reaction products a silicon-high gel [Citation23].
For the secondary reaction product of alkali activated GGBS, the characteristic peak of hydrotalcite (Mg-Al layered double hydroxides) is observed at 13.360° [Citation36], which is consistent with (PDF# 00-014-0191). Hydrotalcite is found in all AAM samples, and the intensity of hydrotalcite shows constant with diverse GP content in pastes. The dilutions of FA and GP shows similar, thus the additional Si-O tetrahedral from GP has little impact on the 28-day paste samples in terms of hydrotalcite formation. The reaction process is predominated by GGBS, and the hydrotalcite is provided by the alkali activation of GGBS. Thereby, the hydrotalcite content is similar among the samples, weakening the effect of additional reactive Si from GP.
The Calcium Aluminum Oxide Carbonate Hydroxide Hydrate (PDF# 00-041-0221) is denoted as Calcium hemicarboaluminate (Hc) [Citation37]. The Calcium hemicarboaluminate is observed within all pastes. The hydroxides-activated slag favors forming the crystalline phase calcium hemicarboaluminate and hydrotalcite together [Citation37]. Because the Al-rich slag provides a suitable environment for calcium hemicarboaluminate formation [Citation38].
Calcite (PDF# 01-086-2343) is assigned to the carbonation of pastes. The calcite formation is not influenced by the GP content in the matrix. Meanwhile, the quartz and mullite gradually disappear with the higher replacement of GP in the matrix, since the quartz and mullite are mainly provided by the FA.
3.2.2. Thermogravimetric analysis
The thermogravimetric (TG) and differential thermogravimetric (DTG) curves of the paste samples at 28 days are presented in . The samples show significant mass loss () from 40 °C to 1000 °C. The mass loss is attributed to the decomposition of C-S-H gels, hydrotalcite, and calcite (from carbonation). With higher GP content, the total mass loss reaches a higher value attributed to more hydrate formation. As shown in Section 3.2.1, the low-reactivity crystalline content (quartz and mullite) decreases with higher incorporation of GP, thus, the reaction mass loss shows the highest in GP30 and the lowest in Ref.
Figure 6. (a) Thermogravimetry (TG) curves of paste mixtures at 28 days; (b) Differential thermogravimetry (DTG) curves of paste mixtures at 28 days.
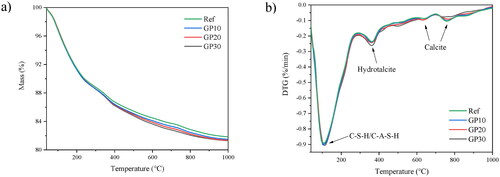
shows the differential thermogravimetric (DTG) curves of 28-day paste mixtures. The majority of mass loss of the samples is around 100 °C to 300 °C. It is due to the mass loss of free water and the decomposition of C-S-H gel ranging from 100 °C to 300 °C [Citation39]. Hydrotalcite is also found among all samples around 380 °C [Citation40]. On contrary, previous studies show that with a higher content of GP in the AAMs, the hydrotalcite phase disappears gradually. However, the fineness of GP in the AAM samples performs a significant role in this study. Normally, the granulation of GP material reaches below 5 μm, and the raw material shows a distinct diverse property [Citation41,Citation42]. The extra Si-O tetrahedral may dissolve in pore solution at a very early reaction period. The extra Si-O tetrahedral consume a large quantity of Al in pore solution, then the small amount of Al interacts with Mg2+ forming hydrotalcite (low content) [Citation43]. However, the median particle size of GP in this study is 28 μm. The large amounts of coarse GP particles are difficult to dissolve in the pore solution at early reaction time, the insufficient Si-O tetrahedral reacts with Al, thus, the hydrotalcite still survives in the matrix. Besides, the predominant GGBS content controls the hydrotalcite formation. Thereby, the hydrotalcite content shows similar content among the samples. The calcite phase is observed at around 650 °C and 750 °C [Citation39], the AAM pastes are easy to face the carbonation issue because of high pH pore solution [Citation44].
3.3. Microstructure
The pore size distribution of AAM samples is presented in , and the cumulative pore volume is presented in , by using N2 adsorption testing. The pore structure is divided by the pore size: micropores (<2 nm), mesopores (2–50 nm), macropores (50–7500 nm), and megapores (>7500 nm) [Citation45]. In , all the paste samples show similar trends, i.e. with a higher dosage of GP, the entire matrix tends to form a denser and more homogeneous system.
Figure 7. (a) The pore size distribution of AAM pastes; (b) Cumulative pore volume of AAM pastes.
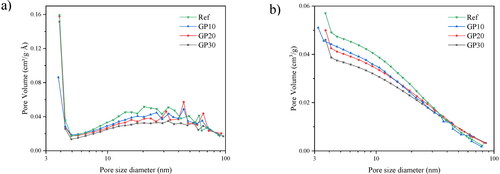
As seen in , the paste samples obtain the most mesopores, concentrating on 4 nm. The higher content of GP addition significantly helps to decrease the pore volume. This is consistent with XRD and TG results because the outer-product pores of C-S-H normally concentrate on 3–5 nm [Citation24,Citation46], the more gelation in the matrices, the more pores appear at this range. The gelation of C-S-H fills the large mesopores of the matrix, while the dissolution of hollow FA makes more pores from precursor exposure [Citation47]. The fewer FA contents, the denser microstructure with higher GP contents. Thus, the porosity of AAM samples decreases with the GP addition.
Among the samples, the second peak concentrates around 40–50 nm, at the border of the mesopores. Previous studies [Citation48,Citation49] demonstrate that the mesopores are important parameters influencing the water penetration and ion transport in the matrix. From , the second pore-concentration peak also decreases with the content of GP additions. Likewise, the total mesopores decrease. Therefore, it can be concluded that the microstructure is refined with a higher content of GP samples.
The difference in the cumulative pore volume of AAM samples is illustrated in . The refinement of mesopore is shown distinctly with the GP addition. The higher GP content decreases the cumulative pore volume. First of all, the reactive GP promotes the gelation in the matrix, the pore is filled with gel products and the pore structure is refined. Simultaneously, the unreacted GP participates in the late reaction process, which means more gels will form in the later age of samples [Citation39]. Thereby, the volume of pores will be gradually filled by the late formation of gels, and the matrix tends to become denser and has a higher capacity to prevent water penetration and ion transport.
3.4. Chloride diffusion
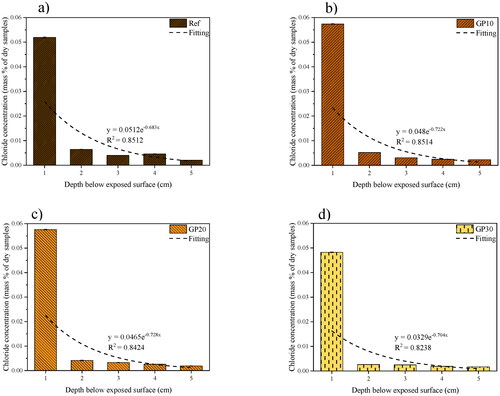
shows the results of chloride ions immobilized in the AAM mortars after an ACPT (5 weeks immersion of sodium chloride solution). The results show that chloride content decreases dramatically with the depth of samples. Simultaneously, the chloride ion content decreases with the GP incorporation.
Table 4. Chloride leaching results of AAM mortars in different depths to exposure surface (unit: mg/mL).
As seen in , the chloride concentration in the different drilled depth is presented. The nonlinear regression curves are presented as well. Among all mortar samples, the GP30 shows the highest chloride resistance. With the higher replacement of FA by GP, the mortar samples show lower chloride mass concentration in the samples. Meanwhile, along with the depth of mortar samples, the chloride concentration shows lower with higher GP content in AAMs. The GP30 shows the lowest chloride concentration at 0.0482%, 0.0026%, 0.0025%, 0.0019%, and 0.0017% mass per dry samples in 1 to 5 cm, respectively. While the Ref has 0.0520%, 0.0064%, 0.0040%, 0.0046%, and 0.0020% mass per dry samples in 1 to 5 cm, respectively. Comparing the GP30 and Ref samples, the chloride concentration decrease by 7.3%, 59.4%, 37.5%, 58.7%, and 15% from 1 to 5 cm depths, respectively. Simultaneously, the GP10 and GP20 show the approximately linear interpolation between GP30 and Ref samples (a few points present discrete features). The chloride resistance shows higher with the increasing GP replacement in AAM mortars. Like previous studies, the chloride binding capacity is attributed to the binding of gels and hydrotalcite in this investigation [Citation50].
Figure 8. Chloride penetration of AAMs mortars (a) Ref; (b) GP10; (c) GP20; (d) GP30.
summarizes the parameters for calculating the apparent chloride diffusion De coefficient according to NT Build 443 [Citation28]. The results show that as the GP content increased, the chloride diffusion coefficient decreased. Compared GP30 with the Ref sample, the higher GP contents contribute to the hydration of AAMs, therefore, more gels formation leads to a denser pore structure. At the same time, fly ash based geopolymers had been proved low chloride binding capacity [Citation51]. Thus, more FA content results in a higher chloride diffusion coefficient of the Ref sample.
Table 5. Apparent chloride diffusion coefficients of AAMs mortars.
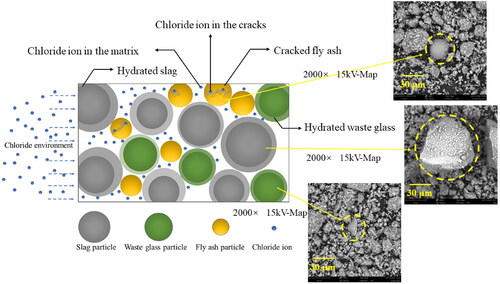
Furthermore, the physical chloride absorption is mainly attributed to C-S-H gels in the matrix. First of all, with more gelation, the matrix becomes denser. In the Supporting Information Section SP1.1, the micropores locate at 3–5 nm which is influenced by the gel formation [Citation24,Citation46]. Concurrently, the results of BET show that, with higher GP content, the matrix favors to form more gels and becomes much denser. The denser matrix may be due to more gelation and the use of GP with smaller particles (verification is supported by ). From Supporting Information Figure SP2(b), the majority of pores in the matrix are mesopores, and mesopores govern the chloride transport in the matrix [Citation36,Citation52]. Thus, the chloride concentration shows lower in high GP replacement mortars, because of the lower content of mesopores. Moreover, the tortuosity becomes more complicated with higher substitution of GP. As shown in , chloride transport is influenced by the hydration of GP. When the chloride ion contacts the GP hydrates surface, the transport route is affected by the gels, and chloride transport along with the surface of hydrated GP, and it takes a longer time to penetrate the matrix. While the hydrated FA exposes the hollow structure and cracking leading to an easier chloride transport state [Citation53,Citation54]. The high mesopores and high level of pore network interconnectivity (because of FA cracking) also lead to a very low chloride binding capacity of the FA-based matrix [Citation7,Citation51]. Relatively, the chloride resistance of higher GP samples is more effective than the FA-based ones. Thereby, the chloride resistance increases with higher GP content.
Figure 9. Chloride transport in AAM mortars.
The chemical absorption in the alkali activated system is normally attributed to the hydrotalcite [Citation55,Citation56] and ettringite [Citation57] phases, in other words, layer double hydroxides phases, which can chemically absorb the chloride ion in the interlayer space. Among the AAM mortars, the hydrotalcite phase is distinct to figure out that partly contributes to chloride ion immobilization. The hydrotalcite content shows similar among different mortars, but GP30 exhibits the highest chloride resistance. Because the hydrotalcite just contributes partly to the chloride binding capacity of the matrix. Thus, the physical chloride absorption predominates the chloride resistance in AAM mortars.
4. Conclusions
In this study, the influences of GP addition on the chloride diffusion behavior of alkali activated GGBS/FA are discussed. With higher GP substitutions in alkali activated GGBS/FA, the reaction kinetics and reaction products are determined. Furthermore, the microstructure and chloride resistance are investigated. Based on the experimental results, the following conclusions can be drawn:
With a higher content of waste GP in alkali activated GGBS/FA, the intensity of the reaction heat peak is increasing, however, the time to reach the reaction peak (TRRP) decreases. The GP addition accelerates the early reaction process of alkali activated GGBS/FA.
The C-S-H gels and hydrotalcite are observed among all the AAM samples. The hydrotalcite is still produced in the environment of extra reactive SiO2 provided by GP, although the available Al content will be interreacted more with the extra Si-O tetrahedrons and less with Mg2+. The crystalline carbonated phases reduce with higher GP content.
Combining the GP in GGBS and FA matrix, a higher volume of micropores is obtained in paste samples, which is attributed to the promotion of C-S-H formation.
The incorporation of waste GP in alkali activated GGBS/FA promotes the chloride resistance of the matrix. Waste GP containing the AAM matrix shows both physical and chemical absorption of chloride ions, attributed to mesopores improvement and hydrotalcite phase.
Supplemental Material
Download MS Word (897.7 KB)Disclosure statement
No potential conflict of interest was reported by the authors.
Additional information
Funding
References
- Baščarevć Z. The resistance of alkali-activated cement-based binders to chemical attack. Handb Alkali-Activated Cem Mortars Concr. 2015;373–396.
- Giergiczny Z. Fly ash and slag. Cem Concr Res. 2019;124:105826.
- Topçu IB, Canbaz M. Properties of concrete containing waste glass. Cem Concr Res. 2004;34(2):267–274.
- Du H, Tan KH. Properties of high volume glass powder concrete. Cem Concr Compos. 2017;75:22–29.
- Du H, Tan KH. Waste glass powder as cement replacement in concrete. ACT. 2014;12(11):468–477.
- Zhang S, Keulen A, Arbi K, et al. Cement and concrete research waste glass as partial mineral precursor in alkali-activated slag/fly ash system. Cem Concr Res. 2017;102:29–40.
- Liu G, Florea MVA, Brouwers HJH. Characterization and performance of high volume recycled waste glass and ground granulated blast furnace slag or fly ash blended mortars. J Clean Prod. 2019;235:461–472.
- Tashima MM, Soriano L, Borrachero M V., et al. Alkali activation of vitreous calcium aluminosilicate derived from glass fiber waste. J Sustain Cem Mater. 2012;1:83–93.
- Si R, Dai Q, Guo S, et al. Mechanical property, nanopore structure and drying shrinkage of metakaolin-based geopolymer with waste glass powder. J Clean Prod. 2020;242:118502.
- Torres-Carrasco M, Tognonvi MT, Tagnit-Hamou A, et al. Durability of alkali-activated slag concretes prepared using waste glass as alternative activator. ACI Mater J. 2015;112:791–800.
- Osborne GJ. Durability of Portland blast-furnace slag cement concrete. Cem Concr Compos. 1999;21(1):11–21.
- Khan HA, Khan MSH, Castel A, et al. Deterioration of alkali-activated mortars exposed to natural aggressive sewer environment. Constr Build Mater. 2018;186:577–597.
- Yuan Y, Ji Y. Modeling corroded section configuration of steel bar in concrete structure. Constr Build Mater. 2009;23(6):2461–2466.
- Monticelli C, Natali ME, Balbo A, et al. Corrosion behavior of steel in alkali-activated fly ash mortars in the light of their microstructural, mechanical and chemical characterization. Cem Concr Res. 2016;80:60–68.
- Law DW, Adam AA, Molyneaux TK, et al. Durability assessment of alkali activated slag (AAS) concrete. Mater Struct. 2012;45(9):1425–1437.
- Puertas F, Torres-Carrasco M. Cement and concrete research use of glass waste as an activator in the preparation of alkali-activated slag. Mechanical strength and paste characterisation. Cem Concr Res. 2014;57:95–104.
- Yazici H. The effect of curing conditions on compressive strength of ultra high strength concrete with high volume mineral admixtures. Build Environ. 2007;42:2083–2089.
- Kärger J, Valiullin R. Diffusion in porous media. Encycl Magn Reson. 2011.
- Yi S-Y, Fan L-W, Fu J-H, et al. Experimental determination of the water vapor diffusion coefficient of autoclaved aerated concrete (AAC) via a transient method: effects of the porosity and temperature. Int J Heat Mass Transf. 2016;103:607–610.
- Chang X, Yang X, Zhou W, et al. Influence of glass powder on hydration kinetics of composite cementitious materials. Adv Mater Sci Eng. 2015;2015:1–7.
- Yin B, Kang T, Kang J, et al. Investigation of the hydration kinetics and microstructure formation mechanism of fresh fly ash cemented filling materials based on hydration heat and volume resistivity characteristics. Appl Clay Sci. 2018;166:146–158.
- Bumanis G, Vitola L, Bajare D, et al. Impact of reactive SiO2/Al2O3 ratio in precursor on durability of porous alkali activated materials. Ceram Int. 2017;43(7):5471–5477.
- Torres-Carrasco M, Puertas F. Waste glass as a precursor in alkaline activation: chemical process and hydration products. Constr Build Mater. 2017;139:342–354.
- Richardson IG. Tobermorite/jennite- and tobermorite/calcium hydroxide-based models for the structure of C-S-H: applicability to hardened pastes of tricalcium silicate, β-dicalcium silicate, Portland cement, and blends of Portland cement with blast-furnace slag, metakaol. Cem Concr Res. 2004;34(9):1733–1777.
- EN 196-3. En 196-1. 2005:1–33.
- Influence of pozzolans and slag on the microstructure of partially carbonated cement paste by means of water vapour and nitrogen sorption experiments and BET calculations. Cem Concr Res. 2010;40:1723–1733.
- Standard E. En 196-1. 2005:1–33.
- NORDTEST NT build 443. Nordtest. 1995:1–5.
- CEN. Characterisation of waste - Leaching - Compliance test for leaching of granular waste materials and sludges - Part 1. CEN. 2002.
- Yang Z, Jiang J, Jiang X, et al. The influence of sodium sulfate and magnesium sulfate on the stability of bound chlorides in cement paste. Constr Build Mater. 2019;228; 116775.
- Davidovits J, Quentin S. Geopolymers inorganic polymerie new materials. J Therm Anal. 1991;37(8):1633–1656.
- Oelkers EH, Gislason SR. The mechanism, rates and consequences of basaltic glass dissolution: I. An experimental study of the dissolution rates of basaltic glass as a function of aqueous Al, Si and oxalic acid concentration at 25 °C and pH _ 3 and 11. Geochim Cosmochim Acta. 2001;65(21):3671–3681.
- Provis JL, Bernal SA. Geopolymers and related alkali-activated materials. Annu Rev Mater Res. 2014;44(1):299–329.
- Lu J, Lu Z, Peng C, et al. Influence of particle size on sinterability, crystallisation kinetics and flexural strength of wollastonite glass-ceramics from waste glass and fly ash. Mater Chem Phys. 2014;148(1–2):449–456.
- Garboczi EJ, Riding KA, Mirzahosseini M. Particle shape effects on particle size measurement for crushed waste glass. Adv Powder Technol. 2017;28(2):648–657.
- Liu T, Chen Y, Yu Q, et al. Effect of MgO, Mg-Al-NO3 LDH and calcined LDH-CO3 on chloride resistance of alkali activated fly ash and slag blends. Constr Build Mater. 2020;250:118865.
- McCaslin ER, White CE. A parametric study of accelerated carbonation in alkali-activated slag. Cem Concr Res. 2021;145; 106454.
- Whittaker M, Zajac M, Ben Haha M, et al. The role of the alumina content of slag, plus the presence of additional sulfate on the hydration and microstructure of Portland cement-slag blends. Cem Concr Res. 2014;66:91–101.
- Liu G, Florea MVA, Brouwers HJH. Performance evaluation of sustainable high strength mortars incorporating high volume waste glass as binder. Constr Build Mater. 2019;202:574–588.
- Hwang C-L, Vo D-H, Tran V-A, et al. Effect of high MgO content on the performance of alkali-activated fine slag under water and air curing conditions. Constr Build Mater. 2018;186:503–513.
- Zhang Y, Xiao R, Jiang X, et al. Effect of particle size and curing temperature on mechanical and microstructural properties of waste glass-slag-based and waste glass-fly ash-based geopolymers. J Clean Prod. 2020;273; 122970.
- Wang PZ, Trettin R, Rudert V. Effect of fineness and particle size distribution of granulated blast-furnace slag on the hydraulic reactivity in cement systems. Adv Cem Res. 2005;17(4):161–166.
- Liu T, Yu Q, Brouwers HJH. In-situ formation of layered double hydroxides (LDHs) in sodium aluminate activated slag: The role of Al-O tetrahedra. Cem Concr Res. 2022;153; 106697
- Liu S, Hao Y, Ma G. Approaches to enhance the carbonation resistance of fly ash and slag based alkali-activated mortar- experimental evaluations. J Clean Prod. 2021;280; 124321.
- McGlashan ML. Manual of symbols and terminology for physicochemical quantities and units. Pure Appl Chem. 1970;21(1):1–44.
- Skinner LB, Chae SR, Benmore CJ, et al. Nanostructure of calcium silicate hydrates in cements. Phys Rev Lett. 2010;104, 195502.
- Fang G, Zhang M. Multiscale micromechanical analysis of alkali-activated fly ash-slag paste. Cem Concr Res. 2020;135; 106141.
- Hu X, Shi C, Shi Z, et al. Compressive strength, pore structure and chloride transport properties of alkali-activated slag/fly ash mortars. Cem Concr Compos. 2019;104;103392
- Babaee M, Castel A. Water vapor sorption isotherms, pore structure, and moisture transport characteristics of alkali-activated and Portland cement-based binders. Cem Concr Res. 2018;113:99–120.
- Shi C. Effect of mixing proportions of concrete on its electrical conductivity and the rapid chloride permeability test (ASTM C1202 or ASSHTO T277) results. Cem Concr Res. 2004;34(3):537–545.
- Noushini A, Castel A, Aldred J, et al. Chloride diffusion resistance and chloride binding capacity of fly ash based geopolymer concrete. Cem Concr Compos. 2020;105; 103290
- Hu X, Shi C, Shi Z, et al. Compressive strength, pore structure and chloride transport properties of alkali-activated slag/fly ash mortars. Cem Concr Compos. 2019; 104; 103392.
- Hasholt MT, Christensen KU, Pade C. Frost resistance of concrete with high contents of fly ash - A study on how hollow fly ash particles distort the air void analysis. Cem Concr Res. 2019;119:102–112.
- Zhou Q, Lu C, Wang W, et al. Effect of fly ash and sustained uniaxial compressive loading on chloride diffusion in concrete. J Build Eng. 2020;31; 101394.
- Qu ZY, Yu QL, Brouwers HJH. Relationship between the particle size and dosage of LDHs and concrete resistance against chloride ingress. Cem Concr Res. 2018;105:81–90.
- Shanmuganathan K, Ellison CJ. Layered double hydroxides. Polym Green Flame Retard. 2014:675–707.
- Hou D, Li T, Han Q, et al. Insight on the sodium and chloride ions adsorption mechanism on the ettringite crystal: structure, dynamics and interfacial interaction. Comput Mater Sci. 2018;153:479–492.