
ABSTRACT
Conventional agriculture in the Midwest US lacks diversity, relies heavily on external inputs to maintain crop yields, and contributes to soil and water quality degradation. Using diverse crop rotations and incorporating livestock are promising solutions to these and other problems linked to current cropping systems dominated by maize (Zea mays L.) and soybean (Glycine max (L.) Merr.). To better understand how agricultural diversification comprehensively affects soil health and function, we compared 20 soil health parameters linked to critical soil ecosystem services in 1) a conventional 2-year maize-soybean rotation, and 2) a diverse 4-year maize-soybean-oat (Avena sativa L.)+alfalfa (Medicago sativa L.)-alfalfa rotation that periodically received cattle manure. The strongest and most salient improvements in soil health from the diversified, 4-year cropping system included: 8% reduction in soil resistance to root growth (p = .006), 16% increase in cation exchange capacity (p = .001), 157% increase in salt-extractable soil carbon (p = .024), and 62% increase in soil microbial biomass (p = .017). These comprehensive improvements in general soil functioning coincided with enhanced crop yields, reduced requirement for agricultural inputs, and decreased environmental impacts – all while maintaining profitability. Despite declines in cropping system diversity globally, but especially in the Midwest US, these results provide strong evidence for the benefits of diversification.
Introduction
As agriculture has modernized and industrialized, it has also become more simplified and less diverse. Prior to the 1950s, Midwest US farms were smaller, regularly included small grains and perennial forages for livestock production, and were less specialized in cash grain production (Hatfield, McMullen, and Jones Citation2009; MacDonald and McBride Citation2009). Today, this region specializes almost exclusively in maize (Zea mays L.) and soybean (Glycine max (L.) Merr.), and contributes to over one-third of global maize and soybean production (FAO Citation2015; Ort and Long Citation2014). Maize and soybean are intensively grown on 80 million ha (10% of the contiguous US; Green et al. Citation2018; NASS Citation2016). This region accounts for 41% of annual US agricultural receipts (USDA ERS (United States Department of Agriculture, E.R.S Citation2018), and contributes to 8% of US agriculture’s global warming potential (Hockstad and Hanel Citation2018). Negative environmental impacts associated with intensive maize-soybean production include: soil erosion rates that have far outpaced soil generation (Montgomery Citation2007), 18–60% declines in soil organic matter (De et al. Citation2020; Guo and Gifford Citation2002), and impaired water quality at both local and continental scales (Rabalais, Turner, and Wiseman Citation2001; Sharpley Citation1999). Thus, understanding the impact of this cropping system on soil and ecosystem services is of national and global importance (Liu et al. Citation2012).
Thousands of years prior to agricultural intensification, diverse crop rotations and livestock integration were commonplace practices used to maintain crop productivity and enhance soil health (Karlen et al. Citation1994; Smith and Nesbitt Citation1995). Currently referred to as regenerative farming (Pearson Citation2007; Sherwood and Uphoff Citation2000), these practices are now marginally used in agriculture, and have been replaced with synthetic fertilizers and pesticides that focus on ‘plant nutrition’ and ‘crop protection,’ rather than soil ecosystem services (i.e. soil health). Modern conventional agriculture has created a path dependency for farmers (Roesch-mcnally, Arbuckle, and Tyndall Citation2018) and is perpetuated by the notion that simplified, conventional systems are the most productive and profitable (Lin Citation2011). However, crop yields from diversified rotations are typically higher than those in mono- or bi-cultural rotations, a phenomenon called ‘the rotation effect’ (Bowles et al. Citation2020; Stanger and Lauer Citation2008). Additionally, economic analyses show diversified rotations can be as profitable as conventional systems due in part to the ‘rotation effect,’ but also from reductions in input cost (Davis et al. Citation2012; Hunt, Hill, and Liebman Citation2017; Poffenbarger et al. Citation2017).
The ‘rotation effect’ is not well understood but may be linked to improved soil health resulting from cropping system diversification (Karlen et al. Citation2006). Soil health is defined here as “the capacity of soil to function as a vital living system, within ecosystem and land-use boundaries, to sustain plant and animal productivity, maintain or enhance water and air quality, and promote plant and animal health” (Doran Citation1996). If enhanced soil health is responsible for enhanced provision of food, fiber, and fuel, then it may also confer additional soil ecosystem services (SES) including enhanced carbon (C) sequestration, water purification, nutrient cycling, habitat, and resource provision, and flood regulation (FAO Citation2015) . Using practices that enhance these SESs is critical to the future of farming, environmental quality, and human well-being.
To understand the effects of simple and more diverse cropping systems on soil health and functioning, we leveraged new and preexisting data from a 15-year agroecosystem experiment in Iowa, US. This experiment compares a conventional 2-year to a diversified 4-year cropping system. Our primary objective was to evaluate the comprehensive impact of cropping system diversification on soil health. Secondarily, we contextualize our results by summarizing and synthesizing prior findings from this long-term experiment to identify broad-scale implications of diversified agroecosystems on agronomic and environmental performance (or sustainability).
Materials & methods
Experimental site and management
The Marsden Farm Experiment (MFE) is located near Boone, IA, USA (42.013628 ºN, −93.784149 ºW). Established in 2002, the MFE is a randomized complete block design of three cropping system treatments. Here, we compare two of the treatments: 1) maize-soybean rotation with synthetic N fertilizer only (2-year cropping system or 2YCS) and 2) maize-soybean-oat (Avena sativa L.) + alfalfa (Medicago sativa L.)-alfalfa rotation primarily receiving composted cattle manure with reduced rates of synthetic N (4-year cropping system or 4YCS). The MFE is a randomized complete block design experiment in which each rotation has all crop phases represented each year in four replicated blocks and each plot is 18 × 84 m. Fifty-year mean (± standard deviation) annual temperature and precipitation is 8.7 ± 0.9°C and 956 ± 211 mm, respectively. Soils at the site are classified under the USDA system as an order of Mollisols and range from 0% to 5% slopes. Further soil and climate information are provided in Table S1, and detailed management descriptions beyond those given below can be found in Liebman et al. (Citation2008), Davis et al. (Citation2012), and Hunt, Hill, and Liebman (Citation2017).
The N fertilizer rates for all treatments were guided by local late spring soil nitrate or pre-sidedress nitrate tests (Blackmer et al. Citation1989). From 2003 to 2017, the 2YCS received total annual rates of 169 ± 36 kg N ha−1 as broadcast urea ammonium nitrate (UAN) in the maize year only. This UAN rate was split applied with 3/4 applied in early-to-mid May and remaining UAN was side-dressed in June when maize was V5/V6. The 4YCS received most of its nutrients from composted cattle manure (83 ± 19% of N) that was applied once during the 4YCS in the November preceding maize (Davis et al. Citation2012). The remainder of the N for the 4YCS was applied in June when maize was at V5/V6. Other essential plant nutrients were added according to local soil fertility test recommendations. For instance, on 11 April 2017 – the year of this study, all crops (except alfalfa) received 37 kg P, 83 kg K, and 28 kg S ha−1. Alfalfa received 54 kg P, 222 kg K, and 28 kg S ha−1.
Tillage differed between the two cropping systems (Liebman et al. Citation2008). The 2YCS was spring cultivated before both maize and soybean and chisel plowed in fall after maize (33 cm deep). The 4YCS was fall chisel plowed and spring cultivated between maize harvest and soybean planting, was no-till or spring disked between soybean and oats, moldboard plowed (23 cm deep) to terminate alfalfa and incorporate manure in the fall before maize, and was sometimes spring disked before the oat+alfalfa planting.
Soil sampling, lysimeter sampling, and analyses
All soils were collected from the maize phase of both rotations from the MFE in 2017 between Apr. and Nov. Soils were stored in coolers with icepacks, transported to a lab, and refrigerated until processing. Analyses were performed either eight times (monthly over the growing season), once during the growing season as part of a long-term monitoring effort, or three times (seasonally) as part of a sampling campaign targeted at crop diversity effects on rhizosphere soil nutrient dynamics. See for abbreviations, sample numbers and methodological details for each soil health indicator. We selected these indicators because of either their direct or indirect links to SESs (, FAO Citation2015).
Table 1. Abbreviation, description and method, sample size (n), and method reference(s) for soil health indicators
Table 2. Selected soil ecosystem services directly applicable to agriculture according to the food and agriculture organization of the United Nations (FAO Citation2015), and associated soil health indicators
Monthly soil collections occurred on 27 Apr., 12 May, 6 Jun., 7 Jul., 8 Aug., 20 Sep., 8 Oct., and 5 Nov. These samples consisted of five randomly located soil cores in each of four experimental replicates, at 0–15 and 15–30 cm depths, with replicate subsamples at each depth within plots homogenized. GWC, SEOC and SEON, NO3−, MBC, MBN were all determined monthly. Seasonal soil samples were collected at three proximities from the maize root due to impact of growing crop and rhizodeposits on soil microbial activity at the rhizosphere, in the row, and in the interrow on 20 Jun., 14 Jul., and 20 Sept. for biological activity (BGase, and PMC).
PAW, WSA, pH, STK, STP, CEC, TN, and SOC were each determined once during the season using soils from various monthly sampling dates collected at 0–15 and 15–30 cm depths. Soil collected 7 Jul. and 8 Aug. was used for PAW analysis using 2 mm sieved and dried soil. Soil collected on 12 May and 8 Oct. was 8 mm sieved, dried, and composited for WSA analysis. Soil collected on 20 Sept. was used to measure pH. Soil collected on 5 Nov. was used for STK, STP, CEC, TN, and SOC analyses.
BD, mesofauna, hardness, and earthworms were all measured once during the season. BD was measured on 7 Jun. at three depths (0–5, 15–20, and 25–30 cm) using a 4 cm diameter by 5 cm deep stainless steel, beveled metal cylinder. Mesofauna samples were taken on 7 Jul. using a modified Berlese funnel approach (Hessel Citation2014). Briefly, seven intact cylindrical cores were taken from each experimental replicate and inserted into a Berlese funnel apparatus consisting of a single greenhouse light creating a temperature and moisture gradient to drive the mobile mesofauna out through the bottom of the soil core into ethanol for preservation. Samples were stored in ethanol and later identified to order level; Acari were classified into morphogroups, with total abundance of mesofauna reported here.
Soil hardness was measured in-field on 13 Nov. using a digital cone penetrometer (FieldScout SC900; ). Measurements were taken in each experimental replicate from eight non-trafficked interrow locations and two wheel-trafficked interrow locations to provide weighted sampling by the proportion of plot area affected by machinery traffic. In this analysis, hardness values within 0–30 cm depths were combined to give an average value for each plot from those depths. Earthworm abundances were measured on 8 Oct. using the pit excavation method following rains that activated estivating earthworms (Čoja et al. Citation2008).
Soil water was collected biweekly in 2017 from suction cup lysimeters installed 1.2 m below the surface of three of four treatment replicates. Adequate sub-soil moisture allowed for only seven lysimeter water samples on 27 Apr., 11 May, 22 May, 6 June, 20 June, 10 Oct., and 5 Nov. Soil lysimeter water NO3− was analyzed colorimetrically using the same method as soil-extractable NO3− ().
Data synthesis from previously published studies
Previously published data on productivity, economic, and environmental impact for 2YCS and 4YCS were synthesized to provide greater context to changes in soil health. These data include: herbicide rates, fossil fuel energy consumption, crop yield, net profitability, synthetic N-fertilizer inputs, and soil erosion in these systems reported between 2008 and 2016. (Hunt, Hill, and Liebman Citation2017, Citation2019; Hunt et al. Citation2020). We used farm records for costs of synthetic N-fertilizer and herbicide applications. Fossil fuel energy consumption model estimates included both upstream and on-site fossil fuel consumption for: production of N fertilizer, herbicide, diesel, seed, grain drying, and all field operations including manure composting and application. Not included in the analyses were farm machinery and grain drying equipment, and the manufacturing and use of P and K fertilizers. Net profitability was calculated using field operation logs for labor, input costs, and crop yields. Agricultural economics databases used year- and product-specific information, and Iowa-based estimates were used for machinery operations, seeds, labor, and crop insurance. Manure was assumed to have been acquired as a waste product without cost on-farm or on a neighboring farm and included only labor and machinery costs for application (Hunt, Hill, and Liebman Citation2017). Erosion model estimates were generated using ArcSWAT calibration to a Hamilton County watershed, followed by a parameterization of the model using site-specific values (Hunt, Hill, and Liebman Citation2019). We also gathered prior water quality data, as NO3–-N, collected from the same buried soil lysimeters, but from a previously published seven-year study (2004 to 2011) across all phases of the rotation (Tomer and Liebman Citation2014).
Data analyses
All new data were checked for normality and heterogeneity of variances. Transformations were applied when raw data did not satisfy tests for normality or homogeneity – some data required log or exponential transformations. For ANOVA, we used linear mixed-models. For singular sampling events, block, treatment, soil depth, and treatment × depth interaction were fixed effects, and the block × treatment interaction was used as a random effect. For response variables tested at multiple dates or discrete soil depths or root proximities, the same linear mixed-model as shown above was applied, except with date and depth included as interacting and main fixed effects. The model for response variables tested at multiple dates and distances from the rhizosphere was the same as that for discrete depths, except that root proximity replaced depth in all factors including depth. The R package lme4 (Bates et al. Citation2014) was used to fit each model, and lmerTest (Kuznetsova, Brockhoff, and Christensen Citation2017) was used to generate an ANOVA using Satterthwaite’s degrees of freedom and Type III sums of squares. The R package emmeans (Lenth Citation2019) was used for pairwise comparisons and p-value corrections. Although some measurements were performed at multiple soil depths or time points, the p-values represent the main treatment effect unless there were significant interactions, and the percent differences were calculated using the overall treatment means. For temporal dynamics, we conducted comparisons for each date when there was a significant interaction with date. Significance was set at α = 0.05, and marginal significance at α = 0.1.
We normalized data to visualize and quantitatively compare soil health indicators on a spider (or radar) plot. The normalization calculation divided each respective experimental unit by the maximum value assuming greater-is-better or minimum, where less-is-better (e.g. BD, hardness and NO3−). Measurements at more than one date or depth were first divided by that date or depth maximum/minimum to incorporate into the overall calculation. Then, all normalized values were averaged, and a standard deviation created across depth and/or dates. A value closer to 1 indicates better soil health.
Results and discussion
Diversified cropping effects on physical soil health
Bulk Density (BD) and Hardness. Soil BD and hardness were significantly lower in the 4YCS compared to the 2YCS by 26% and 8%, respectively (; ). Compacted soils can decrease maize root growth, but this depends on the level of compaction and soil type (Panayiotopoulos, Papadopoulou, and Hatjiioannidou Citation1994). Our results point to superior conditions for root growth in the 4YCS compared with the 2YCS, which is consistent with a previous study that found a 17% increase in maize root length per unit soil volume (Lazicki, Liebman, and Wander Citation2016). Differences in inputs (like manure and alfalfa root residue) and diverse root architectures (and depth) from extended rotations with alfalfa may contribute to reduced BD, soil hardness (Bowen Citation1981; Elkins, Haaland, and Hoveland Citation1977), and improved aggregation throughout the soil profile (Degens Citation1997; Lafond, Angers, and Laverdière Citation1993). While we cannot distinguish whether crop diversity or manure enhanced the ease of soil penetration – e.g., moldboard plowing in prior autumn may have also decreased soil strength and BD – a diversified system effect (rotation + manure) was clear here and confirmed by other crop rotation and manure addition studies (Celik et al. Citation2010; Munkholm, Heck, and Deen Citation2013; Ozlu, Kumar, and Arriaga Citation2019). A further consideration is that these strong positive effects on BD and hardness coincide with other physical parameters despite one intensive tillage event in the 4YCS (moldboard plow after alfalfa); it should also be noted that there are fewer tillage passes over the length of the rotation in the 4YCS compared to the 2YCS.
Table 3. Soil health indicators, respective soil ecosystem services, and effect of diversifying cropping systems (companion table to )†
Figure 1. Normalized value (central radar plot) and raw data (periphery box plots) for conventional (2‐year) and diversified (4‐year) cropping systems. Solid lines in the radar chart indicate the mean normalized value, while shaded areas indicate the associated standard error. The middle bars in the box and whisker plots represent the median of the raw data for each treatment. For definition of soil health indicator abbreviations see . Significance at ∙ p < .1, ∙ ∙ p < .05, ∙ ∙ ∙ p < .01. *Parameters where smaller raw values indicate greater soil health (e.g. bulk density and hardness), and normalized values reflect this ‘less is better.’
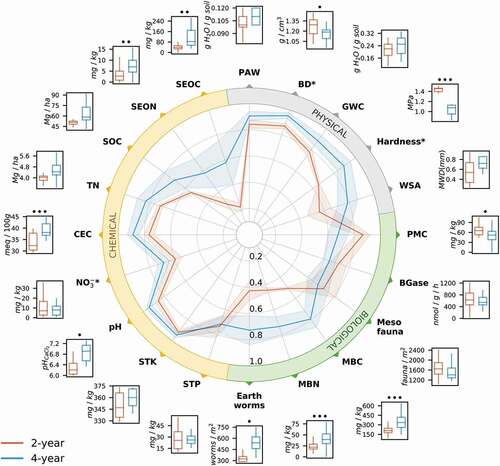
Gravimetric Water Content (GWC), Plant Available Water (PAW), and Water Stable Aggregates (WSA). GWC, PAW, and WSA all pointed the same direction – i.e., 4YCS greater compared to 2YCS – but non-significantly so (, ). GWC was 14% greater under the 4YCS compared to the 2YCS (, ), a consistent trend found throughout the growing season (Figure S2). Studies on similar cropping system level diversification and soil water availability are scarce, however, one study from Midwest US showed 71 years of cattle manure increased water retention at −0.033 and −1.5 MPa respectively by 18% and 21% (Blanco-Canqui, Hergert, and Nielsen Citation2015). Using the monthly-measured GWC and BD values in each rotation, we calculated the difference in water storage in the top 30 cm of soil. On average, the 4YCS consistently stored 8 ± 2 mm more rain over the entire growing season (Figure S2), during what was the 7th driest growing season in 50 years (IA Mesonet Citation2020). More specifically, June and July 50-year average rainfall is 127 and 110 mm, but in 2017 these months were 44 and 25 mm respectively. This translated to 11 and 32% more water in the 4YCS in the months of June and July in 2017.
Diversified cropping effects on chemical soil health
Cation Exchange Capacity (CEC) and pH. Diversification increased the CEC by 16% and pH by 10% in the 4YCS compared to 2YCS (), indicating a greater storage capacity for essential cationic plant nutrients in the diversified rotation. CEC increases with clay content, organic matter and pH (Helling, Chesters, and Corey Citation1964), but management on the decadal scale generally only influences the latter two (Thomas, Dalal, and Standley Citation2007). Increased CEC does align with average soil organic carbon (SOC) increases discussed later (), as soil organic matter can be an important source of CEC (Thompson et al. Citation1989). Furthermore, CEC increases are also related to soil pH increases. CEC buffers soil against acidification, and near-neutral pH enhances effective CEC, because fewer acid-forming cations are present on exchange sites. The increased pH and CEC in the 4YCS likely resulted from lower synthetic N fertilizer rates, and proportionally greater manure application. Synthetic ammonium-based fertilizer induces nitrification, an acidifying soil process (Aula et al. Citation2016; Edwards et al. Citation1992). The 4YCS received N primarily from manure (81% of total N inputs), and unlike the 2YCS, received low synthetic N fertilizer (8 vs. 89 kg N ha−1 y−1; Hunt, Hill, and Liebman Citation2019). Additionally, composted cattle manure applied in the 4YCS may buffer soil pH through organic acids and/or bicarbonates in the manure, even when mineral N-fertilization is moderate (Whalen et al. Citation2000).
Salt-extractable Organic C (SEOC) and N (SEON). The SEOC and SEON indicate the presence of low-molecular weight, dissolved and exchangeable organic matter in soil, and are proxies for microbial-labile sources of C and N (Haynes Citation2005; Sun et al. Citation2015). The 4YCS strongly increased SEOC (+157%) and SEON (+101%) compared to the 2YCS (). Manure application is likely the most parsimonious explanation for these increases (Haynes Citation2005; Jensen et al. Citation1997); however, crop rotations absent of manure have increased these salt-extractable pools (McDaniel and Grandy Citation2016). Consistent with our findings, other studies have found manure generally increases SEOC and SEON compared to synthetic N-fertilizer alone (Long, Jiang, and Sun Citation2015; McDowell et al. Citation1998), although exceptions for SEOC exist (Sun et al. Citation2015). Additionally, the effect whereby 4YCS increased SEOC may also be due in part to change in pH, which increases dissolution of low-molecular weight forms of organic matter (i.e., DOC; You, Yin, and Allen Citation1999). Combined manure and synthetic N-fertilizer has increased SEON by 143%, compared to systems fertilized with mineral N alone, and related to microbial biomass and crop yield increases among treatments (Sun et al. Citation2015).
Soil Organic Carbon (SOC). The 4YCS increased SOC by 29%, but not significantly (, ). In general, greater C inputs to soil should lead to greater increases in SOC with all other factors regulating SOC loss kept the same (Kong et al. Citation2005; Larson et al. Citation1972; Liu et al. Citation2014). We have two major sources of C in these agroecosystems: those from plant inputs of both cropping systems and manure inputs only in the 4YCS. Past C input calculations for this long-term experiment accounted for aboveground biomass, root biomass, manure inputs (Poffenbarger et al. Citation2020), and estimates of root exudates (Lazicki, Liebman, and Wander Citation2016), and estimated that the 4YCS received 8–26% less C than did the 2YCS (mostly due to lower aboveground inputs after hay harvest during alfalfa years). Greater diversity of plant inputs from crop rotation, legumes, and animal manure application have also been shown to increase SOC (Kallenbach and Grandy Citation2011; McDaniel, Tiemann, and Grandy Citation2014b), and may explain the slow trend toward greater SOC, but this is much more difficult to quantify. However, it is more likely that SOC changes slowly, and even moderate changes can be difficult to detect with statistical certainty in Iowa soils (De et al. Citation2020; Lazicki, Liebman, and Wander Citation2016; Poffenbarger et al. Citation2020).
Even though SOM is the cornerstone of soil health and influences almost all other soil health indicators, quantifying changes in SOC after management intervention is difficult. Emergence of private (or voluntary) C markets has rapidly expanded and intensified interest in quantifying changes in SOC after a switch in soil management (Vermeulen et al. Citation2019). However, detecting SOC changes in Midwest US, and regions around the world dominated by Mollisols, is especially difficult due to large preexisting SOC concentrations (> 2%; Franzmeier, Lemme, and Miles Citation1985). Tracking a relatively small ‘signal’ within large ‘noise’ can be challenging due to slow rates of SOC change and high spatial variability (De et al. Citation2020; Goidts, Van Wesemael, and Crucifix Citation2009; Poffenbarger et al. Citation2020), or even impossible due to potential C saturation (Stewart et al. Citation2007). For instance, deep soil cores (0–90 cm) taken from this same MFE but in 2014 were analyzed for SOC stocks and found no difference between 4YCS and 2YCS, 146 ± 11 vs. 156 ± 16 Mg C ha−1 (Poffenbarger et al. Citation2020). These results stress that with soil health evaluations, we should not solely focus on changes in SOC. While SOC is central to healthy soil function and SESs, changes are slow and difficult to measure with current methods. Our data illustrate the importance of using more sensitive indicators that are more directly linked to other critical SESs of interest for more rapid indication of progress in soil health and SES provisioning.
Nitrogen Dynamics. N is arguably among the most important macronutrients for crop growth (Schlegel, Dhuyvetter, and Havlin Citation1996; Smil Citation2004), and is a key limiting nutrient in most agricultural soils. Total N (TN) was on average 17% greater, but like SOC, the difference was not significant (). TN is partially composed of what is thought to be bioavailable, or total extractable N forms, which consist of organic extractable N (i.e., SEON) and inorganic N (mostly NH4+ and NO3−). Combined, both organic and inorganic extractable N forms only amount to less than 5% of total N in these soils. Inorganic N was comprised of >90% NO3− in both cropping systems. Seasonal soil NO3− was more stable and 35% lower in the 4YCS, but not significantly different (, S3, ). Moreover, SEON accounted for 48% of total extractable N forms in the 4YCS versus 23% in the 2YCS. Alfalfa roots and composted cattle manure were likely contributors to SEON and TN increases in the 4YCS. Kelner, Vessey, and Entz (Citation1997) found that the abilities of alfalfa to both fix atmospheric N2 and reach deep soil NO3− reserves allowed for 2nd year alfalfa stands to add greater amounts of N than soybeans. Although N2 fixation is variable for both legumes, on average, alfalfa is estimated to fix 150 kg N ha−1 y−1, compared to 84 kg N ha−1 y−1 by soybeans, with fixation for both generally diminishing with increased inorganic N (Kelner, Vessey, and Entz Citation1997; Russelle and Birr Citation2004). Additionally, the use of animal manure combined with synthetic fertilizer N was found to be more effective at increasing TN than using synthetic N fertilizer alone (McGill et al. Citation1986; Sun et al. Citation2015).
Plant Available P and K (STP and STK). Essential plant macronutrients, STP and STK, measured with Mehlich III extractions were not significantly different between treatments. This was an expected result, since recommended rates of these nutrients are applied based on annual soil fertility tests. This result demonstrates that when planning manure application rates, soil and manure testing in combination with small supplemental synthetic N applications were effective strategies for avoiding excess STP and STK (Sadeghpour et al. Citation2016), a common issue associated with manure application (Hooda et al. Citation2001). Phosphorus inputs were comparable between both systems. Composted cattle manure is high in P, and the 4YCS received 11 kg P ha−1 y−1 (supplemented with 9 kg P ha−1 y−1 from synthetic fertilizer), compared to 15 kg P ha−1 y−1 synthetic P in the 2YCS (Hunt, Hill, and Liebman Citation2019).
Diversified cropping effects on biological soil health
Earthworms. While most earthworms in the Midwest US are non-native, they are still considered an important soil ecological engineer, nutrient cycler, and indicator of general soil health in agroecosystems (de Bruyn Citation1997; Hendrix Citation2006). In our study, diversification increased earthworm abundance in the 4YCS by 71% compared to the 2YCS (, ). Most likely, the alfalfa residues and composted cattle manure increased earthworm abundance and activity as shown in other studies (Dick Citation1992; Sauvadet et al. Citation2016; Shipitalo, Protz, and Tomlin Citation1988). Compared to maize residues, alfalfa residues can increase earthworm biomass and casting by 5% and 43%, respectively (Shipitalo, Protz, and Tomlin Citation1988). Reduced herbicide use in the 4YCS also may have played a role in increasing earthworm abundance (Gaupp-Berghausen et al. Citation2015; Zaller et al. Citation2014), but others have demonstrated that crop rotations have a far greater influence on earthworms than herbicide use (Tomlin, Tu, and Miller Citation1995).
Mesofauna. Soil mesofauna comprise key predators in soil food webs and are critical for recycling nutrients. They are generally thought to be more sensitive to agroecosystem management practices than soil microorganisms (Behan-Pelletier Citation1999; Wardle et al. Citation1995). In our study, however, soil mesofauna abundances (mites and collembola) and community composition were rather insensitive to cropping system diversification and there was no significant difference between the 2YCS and 4YCS (, ). Combined abundances of mites and collembola were 1–2 orders of magnitude lower than those obtained in other agricultural systems in the region (50,000–100,000 individuals m−2; Crossley, Mueller, and Perdue Citation1992; Culik, de Souza, and Ventura Citation2002; Edwards and Lofty Citation1969; Reddy Citation1984). This discrepancy could be attributed to 2017 being one of the driest growing seasons on record (IA Mesonet Citation2020). Mesofaunal communities in both systems were predominantly comprised of mites and collembola, which comprised about 61% and 20% of the total community, respectively. The 4YCS did have greater mite species richness, containing 11 Acari morphogroups, while the 2YCS only had 8 present, which is consistent with studies comparing similar cropping practices (Kruczynska and Seniczak Citation2011; Osler et al. Citation2008).
Soil Microbial Biomass (MB). Microbial biomass is a relatively small but critical pool of total soil organic matter (1–5%). Average soil microbial biomass carbon and nitrogen (MBC and MBN) were both significantly greater in the 4YCS versus 2YCS, by 62% and 80%, respectively (, ). These increases in MBC and MBN persisted across eight sampling dates during 2017 (data not shown); and were consistent with other studies showing responses to manure amendments (Kallenbach and Grandy Citation2011), diversified crop rotations (McDaniel et al., Citation2014a; McDaniel and Grandy Citation2016), and a previous report from this experiment (King and Hofmockel Citation2017). Since C is thought to be limiting for soil microorganisms (Ekblad and Nordgren Citation2002; Soong et al. Citation2020), quality of C additions through manure and plant inputs with narrow C-to-N ratio likely increased microbial biomass (Campbell et al. Citation1991; Lynch Citation1984; McDaniel and Grandy Citation2016). Other mechanisms explaining the large increase in MB under diversified cropping systems include greater soil water content (Skopp, Jawson, and Doran Citation1990), circumneutral pH (Aciego Pietri and Brookes Citation2009; Geisseler and Scow Citation2014), and increases in SEOC (Sun et al. Citation2015). Improvements in the soil environment and in available resources should not only increase microbial abundance but also alter microbial community composition (Drenovsky et al. Citation2004; Kravchenko et al. Citation2019; Zhalnina et al. Citation2015) and enhance microbial metabolism (Lupwayi, Rice, and Clayton Citation1999; McGill et al. Citation1986; Zhalnina et al. Citation2015).
Microbial Activity: Beta-glucosidase (BGase) and potentially mineralizable C (PMC). The extracellular hydrolytic enzyme BGase and PMC measured via incubation are both indicators of soil microbial activity. BGase activity approximates both activity and microbial C demand, while soil respiration reflects microbial C consumption under optimal conditions. Both C demand (BGase) and consumption (PMC) commonly increase with increases in MB (Franzluebbers et al. Citation1996; Turner et al. Citation2002); and more specifically, when MB increases with organic inputs from diverse rotations and manure (McDaniel and Grandy Citation2016; Rochette and Gregorich Citation1998). Thus, it was unexpected that BGase and PMC did not coincide with increases in MBC and were lower on average in the 4YCS than the 2YCS, albeit statistically insignificant (). A similar finding of greater MBC, but lower BGase activity, was previously reported from this experiment at 0–10 cm depth (King and Hofmockel Citation2017). At this depth, the authors reported an 18% increase in MBC but a 46% decrease in BGase in the 4YCS compared to 2YCS. However, at 10–20 cm depth the 4YCS increased both MBC and BGase by 97% and 124%, respectively. The reason for these differences with depth is unknown, but may be due to changes in labile C supply with depth – C becomes more limiting with depth and requires greater BGase production in 4YCS compared to the 2YCS. One possible explanation for these divergent findings is that the 4YCS soil microbial community was more efficient at processing C inputs (Anderson and Domsch Citation1990; Kallenbach et al. Citation2019; Wardle and Ghani Citation1995). Soils from the 4YCS respired 20% less in response to having 8–26% less estimated C inputs than the 2YCS (Poffenbarger et al. Citation2020) but resulted in 62% more microbial biomass. Greater MB with less C inputs from plants combined with more efficient C use could help maintain, or even slightly increase, SOC compared to the 2YCS (Manzoni et al. Citation2012; Sinsabaugh et al. Citation2013). Furthermore, increased availability of soil N to MB, here provided through organic forms of N (manure and alfalfa), has been shown to enhance microbial C use efficiency (Li et al., Citation2018a; Wild et al. Citation2019). This also supports the notion that SOC may be slowly increasing in the 4YCS compared to the 2YCS, despite the lack of statistical significance observed here and in other studies (Lazicki, Liebman, and Wander Citation2016; Poffenbarger et al. Citation2020).
Potentially mineralizable C is one of the most commonly used biological soil health tests (Bünemann et al. Citation2018), and correlates with labile resources available to microorganisms, the size and activity of the MB, and even crop yield and N requirements (Allen, Singh, and Dalal Citation2011; Franzluebbers Citation2018). However, our finding of the 4YCS decreasing PMC (and BGase) compared to the 2YCS was incongruent with the plethora of published studies reporting positive soil health changes resulting from agroecosystem diversification. We conclude that short-term PMC measurements and enzyme activities should not be evaluated alone, but interpreted with additional biological soil health indicators like MB, and potentially other physical and chemical parameters.
Consequences of increased soil health for soil ecosystem services
SESs are interdependent and can be associated with multiple different soil health indicators (). Here, we assess and highlight the impact of the most salient soil health responses to cropping system diversity on six related SESs.
Flood Regulation. The near unanimous improvements in physical soil health indicators () point to more rapid water infiltration (Angers and Caron Citation1998; Ehlers Citation1975), and reduced runoff and erosion (Zhang et al. Citation2007), thereby enhancing flood regulation. The Midwest US is increasingly susceptible to flooding due in part to both increased total precipitation and event intensity (Schoof, Pryor, and Surprenant Citation2010; Villarini et al. Citation2011). The 4YCS decreased soil hardness and reduced BD by an average of 0.1 g cm−3 compared to the 2YCS (). Reducing BD by 0.2 g cm−3 can double soil hydraulic conductivity in a coarse-textured soil (Patel and Singh Citation1981). At a regional scale, these physical improvements to soil could help retain water from intense precipitation events and mitigate flood damage, such as those in the Midwest US in 2008 that cost $15B (Budikova et al. Citation2010). $10B was from Iowa alone, including $4B in crop damage (U.S. Department of Commerce Citation2009).
In Midwest US agroecosystems, producers struggle with both extremes of too much and too little soil water – even within the same location but at different times of the year (Hatfield, Wright-Morton, and Hall Citation2018). The structural soil properties that increase the capacity to reduce flood damage also improves the capacity of the soil to store water in times of scarcity. As the Midwest US springs become wetter and summers drier (Kunkel et al. Citation2013; Pryor, Barthelmie, and Schoof Citation2013), managing soil to promote soil structure that supports infiltration and water storage will be even more integral to enhancing agricultural system resilience (). Between 1989 and 2009, drought accounted for 30% of insured crop losses in the Midwest US (Hayes Citation2013). In rainfed systems, crops like maize are increasingly susceptible to heat stress due to rising temperatures and vapor pressure deficits associated with climate change (Lobell et al. Citation2014; Ort and Long Citation2014). Crop stress and climate models suggest that maize yield losses from heat stress could approach 40% by 2060 (Ort and Long Citation2014). Increased crop diversity can reduce yield variability that results from climate extremes (Bowles et al. Citation2020; Gaudin et al. Citation2015).
Water Purification. Conventional agriculture affects water quality via what are probably the most pressing environmental issues for the Midwest US: erosion and nutrient leaching. In conventional systems, erosion can occur when fields are fallowed seven months of the year. Both erosion and timing of nutrient applications before crops can take them up contribute to the release of both N and P from farm fields that affects local and regional water quality (Matson, Naylor, and Ortiz-Monasterio Citation1998; Rabalais, Turner, and Wiseman Citation2002). Models have shown the 4YCS reduces erosion by over 60% (). Differences in erosion may be attributable to increased duration of crop cover in the 4YCS alfalfa years. Additionally, during 2017, the 4YCS reduced soil lysimeter water NO3− concentrations in early spring by 57% and generally decreased soil NO3− in the top 0–15 cm compared to the conventional, 2YCS (, S3). This window between April and June is when most nutrient losses occur in the Midwest US. For example, during this period 71% of annual tile drainage and 75% of annual NO3− losses occurred (Randall and Vetsch Citation2005). A longer study of NO3− in groundwater showed this 4YCS reduced concentrations by 22% throughout the entire rotation, compared to a 2YCS (Tomer and Liebman Citation2014; ).
Figure 2. Nitrate concentration in soil water at 120 cm depth under the maize year of both crop rotations in 2017. Means shown with standard error in shaded area. Significance at * p < .1, ** p < .05, *** p < .01.
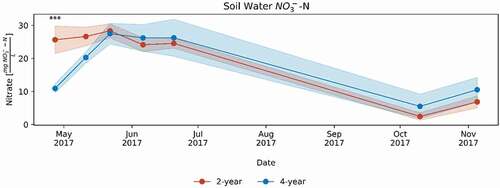
Table 4. Productivity, external inputs, and environmental impacts for 2-year and 4-year cropping systems (2YCS and 4YCS, data span 2003–2016)†
Improved physical soil properties help regulate water purification by reducing erosion and slowing and storing water and increasing the availability of NO3–-N to crops during the growing season (Basche and DeLonge Citation2017; Hatfield, Sauer, and Prueger Citation2001). Chemical and biological aspects of soil health also play a role in reducing N leaching (; Tomer and Liebman Citation2014). The greater than two-fold proportion of extractable N in organic N compounds, rather than NO3–-N, reflects greater labile N storage in forms less likely to leach and impair water quality (Christou et al. Citation2005). Additionally, microbial N immobilization may play a major role in water purification by reducing the average seasonal NO3− pool, thereby reducing leaching susceptibility (Evans et al. Citation2006; Partey, Preziosi, and Robson Citation2014), as also seen in other diversified agroecosystems (Figures 2, S3; Huhta, Setälä, and Haimi Citation1988; Partey, Preziosi, and Robson Citation2014; Setälä et al. Citation1990).
Provisioning of food/fiber/fuel & nutrient cycling
The 15-year record of maize and soybean production shows that the 4YCS increased maize and soybean yields by 5% and 21%, respectively, compared to the 2YCS (). This was likely a combined effect of multiple soil health improvements in the diversified system, relative to the conventional system (, ). The same physical aspects of soil health that regulate soil water movement, storage, and purification are also important to improving soil as a medium for plant growth. A less compact soil with greater pore space and connectivity allows greater root growth, access to more water (Angers and Caron Citation1998; Basche and DeLonge Citation2017; Hatfield, Sauer, and Prueger Citation2001), and more nutrients (Rosolem, Foloni, and Tiritan Citation2002), ultimately improving yields (Ball et al. Citation2005; Calonego and Rosolem Citation2010).
We show corroborating evidence with changes in chemical aspects of soil health. More specifically, SEON showed one of the greatest positive differences between the 4YCS and 2YCS, illustrating the importance of N being in a less mobile, yet labile form. Also, CEC, a measure of ability of soil to store essential cationic plant nutrients, was greater in the 4YCS compared to 2YCS. Soil organic matter can be a catalyst for crop capture of soil resources (King et al. Citation2020) but may not necessarily change the quantity of resources present. Furthermore, the 4YCS presumably increased chemical availability of nutrients at a near-neutral pH (e.g., N, S, K, and Mo) compared to the 2YCS. Collectively, the 4YCS had greater nutrient storage capacity, availability and abundance of soil C and plant-available nutrients - most likely due to the addition of composted cattle manure. Finally, there is supporting evidence in the literature for both macro and microbiota contributing to enhanced nutrient cycling. For example, one meta-analysis attributed a 25% increase in crop yield due to the presence of earthworms (Van Groenigen et al. Citation2014) and another meta-analysis showed net N mineralization was regulated by microbial biomass stoichiometry (Li et al. Citation2020b). Observed pathogen and weed suppression at this site may also have contributed to enhanced yields (Westerman et al. Citation2005).
Habitat/Resources for Organisms & C Sequestration. Abundance and activity of soil biota are thought to be highly sensitive and respond more rapidly to management practices than other soil properties and also are critically linked to many SESs (; Doran and Zeiss Citation2000; Lehman et al. Citation2015). The soil health movement has responded with recent emphases on soil microbial biomass, activity, and community composition (Karlen et al. Citation2021). Diversifying cropping systems had some of the strongest effects on earthworm and microbial biomass abundances (, ), indicating improved soil habitat for these biota in the 4YCS compared to the 2YCS. Microbial biomass is very dynamic and linked to many SESs including nutrient supplying power (Li et al., Citation2018b) and formation of persistent soil organic matter (Grandy and Neff Citation2008; Liang et al. Citation2011; Liang, Schimel, and Jastrow Citation2017). There is likely a positive feedback between the physical soil properties (or the ‘habitat’) and biological activity. A recent study describes this process as increasing the ‘microbial spatial footprint’ (Kravchenko et al. Citation2019), which, through a positive feedback could increase SOC in the long term and further improve structure and pore space. Despite this connection, we did not observe any statistical difference in SOC between the 2YCS and 4YCS.
Economic feasibility of diversified cropping systems
Fifteen years of the diversified, 4YCS has enhanced SESs that will help society address water quality impairment (Boesch et al. Citation2009; Turner and Rabalais Citation2003), restore degraded soils (Liu et al. Citation2012; Montgomery Citation2007), and provide resilience to climate extremes – all of which will be vital in feeding 10 billion people by 2100 (Bengtsson, Shen, and Oki Citation2006). This diversified cropping system mitigates these most pressing environmental issues in the region, without increasing costs to producers ().
Additional economic benefits for producers extend beyond enhanced yields and include cost reductions from reduced need for external inputs. For example, diversification practices in the 4YCS reduced energy use by half and both herbicide and N-fertilizer use were reduced by nearly 90% (). These input cost reductions offset the additional labor requirements involved in the 4YCS, which made the 2YCS and 4YCS economically comparable (; Davis et al. Citation2012; Hunt, Hill, and Liebman Citation2017; Poffenbarger et al. Citation2017). Increased labor demands, however, could also improve job prospects in rural America, which suffers high poverty rates, and a shrinking job market (Thiede et al. Citation2017).
Conclusion
We showed that diversified agroecosystems can improve soil health, mitigate environmental impacts, and be an economically viable alternative to the business-as-usual maize-soybean cropping system. Our soil health results, combined with previous work at this long-term experiment, point to comprehensive positive environmental outcomes and climate resilience under the 4YCS compared to the conventional 2YCS. Despite the potential benefits of integrated, diversified systems, there are many barriers to adoption. These include: farmer ‘path dependency’ due to government policy, a lack of markets for diverse agricultural products, and sunken farmer investments in specialized equipment and infrastructure (Boody et al. Citation2005; Bowman and Zilberman Citation2013; Roesch-mcnally, Arbuckle, and Tyndall Citation2018; Weisberger et al. Citation2021). Policymakers, food corporations, landowners, and consumers are called to consider creative methods of encouraging the reintegration of forage perennials, diverse grains, and livestock into agroecosystems of the Midwest US as a means of regenerating soil health, harnessing greater production in healthy soils, and reducing agricultural environmental impact, all while maintaining farm profitability.
Author disclaimers
The views expressed are those of the authors and do not reflect institutions these authors belong to (Iowa State University and USDA-ARS). This research was supported in part by the US. Department of Agriculture, Agricultural Research Service, project #5030-21000-067. Mention of trade names or commercial products in this publication is solely for the purpose of providing specific information and does not imply recommendation or endorsement by the USDA. USDA is an equal opportunity provider and employer.
Author contributions
RB and MM wrote the paper and conceived of the study. RB, MD, and MDL collected and analyzed samples. RB conducted statistical analyses, RB and JM developed tools to analyze and visualize data. ML and NL provided access to long-term experiment, guidance on experimental protocol, and/or contributed data. All authors edited the manuscript.
Additional information
Supplementary Information accompanies this paper at the link.
Supplemental Material
Download PDF (639.4 KB)Acknowledgments
We express special thanks to Katherine Goode for her help with statistical modeling, Jeff Cook for his help with lysimeters, Bert Swalla and Martin Shipitalo graciously taught earthworm identification and sampling techniques, and Stephen Potter and Mitchell Roush provided valuable assistance in sample collection and processing. We appreciate and would like to thank two anonymous reviewers at ASFS, whose comments and suggestions on a previous draft were very helpful. We were saddened by the sudden death of our colleague Dr. Nick Lauter during the course of this project. We respectfully dedicate this manuscript to him. He had uncanny abilities to make collaboration adventuresome and provide excellent mentorship.
Disclosure statement
No potential conflict of interest was reported by the author(s).
Supplementary material
Supplemental data for this article can be accessed on the publisher’s website.
Correction Statement
This article has been republished with minor changes. These changes do not impact the academic content of the article.
References
- Aciego Pietri, J. C., and P. C. Brookes. 2009. Substrate inputs and pH as factors controlling microbial biomass, activity and community structure in an arable soil. Soil Biology and Biochemistry 41 (7):1396–405. doi:https://doi.org/10.1016/j.soilbio.2009.03.017.
- Allen, D. E., B. P. Singh, and R. C. Dalal. 2011. Soil health indicators under climate change: A review of current knowledge. In Soil health and climate change, 25–45. Berlin, Germany: Springer.
- Anderson, T.-H., and K. H. Domsch. 1990. Application of eco-physiological quotients (qCO2 and qD) on microbial biomasses from soils of different cropping histories. Soil Biology and Biochemistry 22 (2):251–55. doi:https://doi.org/10.1016/0038-0717(90)90094-G.
- Angers, D. A., and J. Caron. 1998. Plant-induced changes in soil structure: Processes and feedbacks. Biogeochemistry 42 (1/2):55–72. doi:https://doi.org/10.1023/A:1005944025343.
- Aula, L., N. Macnack, P. Omara, J. Mullock, and W. Raun. 2016. Effect of Fertilizer Nitrogen (N) on soil organic carbon, total N, and soil pH in long-term continuous winter wheat (Triticum aestivum L.). Communications in Soil Science and Plant Analysis 47 (7):863–74. doi:https://doi.org/10.1080/00103624.2016.1147047.
- Ball, B. C., I. Bingham, R. M. Rees, C. A. Watson, and A. Litterick. 2005. The role of crop rotations in determining soil structure and crop growth conditions. Canadian Journal of Soil Science 85 (5):557–77. doi:https://doi.org/10.4141/S04-078.
- Basche, A., and M. DeLonge. 2017. The impact of continuous living cover on soil hydrologic properties: A meta-analysis. Soil Science Society of America Journal 81 (5):1179–90. doi:https://doi.org/10.2136/sssaj2017.03.0077.
- Bates, D., M. Mächler, B. Bolker, and S. Walker. 2014. Fitting linear mixed-effects models using lme4. arXiv Prepr. arXiv1406.5823.
- Behan-Pelletier, V. M. 1999. Oribatid mite biodiversity in agroecosystems: Role for bioindication. Agriculture, Ecosystems & Environment 74 (1–3):411–23. doi:https://doi.org/10.1016/S0167-8809(99)00046-8.
- Bengtsson, M., Y. Shen, and T. Oki. 2006. A SRES-based gridded global population dataset for 1990–2100. Population and Environment 28 (2):113–31. doi:https://doi.org/10.1007/s11111-007-0035-8.
- Blackmer, A. M., D. Pottker, M. E. Cerrato, and J. Webb. 1989. Correlations between soil nitrate concentrations in late spring and corn yields in Iowa. Journal of Production Agriculture 2 (2):103–09. doi:https://doi.org/10.2134/jpa1989.0103.
- Blanco-Canqui, H., G. W. Hergert, and R. A. Nielsen. 2015. Cattle manure application reduces soil compactibility and increases water retention after 71 years. Soil Science Society of America Journal 79 (1):212–23. doi:https://doi.org/10.2136/sssaj2014.06.0252.
- Boesch, D. F., W. R. Boynton, L. B. Crowder, R. J. Diaz, R. W. Howarth, L. D. Mee, S. W. Nixon, N. N. Rabalais, R. Rosenberg, J. G. Sanders, et al. 2009. Nutrient enrichment drives Gulf Of Mexico Hypoxia. Eos, Transactions American Geophysical Union 90 (14):117–18. doi:https://doi.org/10.1029/2009EO140001.
- Boody, G., B. Vondracek, D. A. Andow, M. Krinke, J. Westra, J. Zimmerman, and P. Welle. 2005. Multifunctional agriculture in the United States. Bioscience 55 (1):27–38. doi:https://doi.org/10.1641/0006-3568(2005)055[0027:MAITUS]2.0.CO;2.
- Bowen, H. D. 1981. Alleviating mechanical impedance. In Transactions of American Society of Agricultural Engineers St, G. F. Arkin, and H. M. Taylor ed., 21–57. Modifying the root environment to reduce crop stress. Joseph, MI: American Society of Agricultural Engineers.
- Bowles, T. M., M. Mooshammer, Y. Socolar, F. Calderón, M. A. Cavigelli, S. W. Culman, W. Deen, C. F. Drury, A. G. Garcia, and A. C. M. Gaudin. 2020. Long-term evidence shows that crop-rotation diversification increases agricultural resilience to adverse growing conditions in North America. One Earth 2 (3):284–93. doi:https://doi.org/10.1016/j.oneear.2020.02.007.
- Bowman, M. S., and D. Zilberman. 2013. Economic factors affecting diversified farming systems. Ecology and Society 18 (1). doi:https://doi.org/10.5751/ES-05574-180133.
- Bremner, J. M. 1996. Nitrogen–Total. In Methods of soil analysis, Part 3: chemical methods, ed. J. M. Bigham and J. M. Bartels, 1085. Madison, WI: Soil Science Society of America.
- Brookes, P. C., A. Landman, G. Pruden, and D. S. Jenkinson. 1985. Chloroform fumigation and the release of soil nitrogen: A rapid direct extraction method to measure microbial biomass nitrogen in soil. Soil Biology & Biochemistry 17 (6):837–42. doi:https://doi.org/10.1016/0038-0717(85)90144-0.
- Budikova, D., J. S. M. Coleman, S. A. Strope, and A. Austin. 2010. Hydroclimatology of the 2008 Midwest floods. Water Resources Research 46 (12). doi:https://doi.org/10.1029/2010WR009206.
- Bünemann, E. K., G. Bongiorno, Z. Bai, R. E. Creamer, G. De Deyn, R. de Goede, L. Fleskens, V. Geissen, T. W. Kuyper, P. Mäder, et al. 2018. Soil quality – A critical review. Soil Biology & Biochemistry 120:105–25. doi:https://doi.org/10.1016/j.soilbio.2018.01.030.
- Calonego, J. C., and C. A. Rosolem. 2010. Soybean root growth and yield in rotation with cover crops under chiseling and no-till. European Journal of Agronomy 33 (3):242–49. doi:https://doi.org/10.1016/j.eja.2010.06.002.
- Campbell, C. A., V. O. Biederbeck, R. P. Zentner, and G. P. Lafond. 1991. Effect of crop rotations and cultural practices on soil organic matter, microbial biomass and respiration in a thin Black Chernozem. Canadian Journal of Soil Science 71 (3):363–76. doi:https://doi.org/10.4141/cjss91-035.
- Celik, I., H. Gunal, M. Budak, and C. Akpinar. 2010. Effects of long-term organic and mineral fertilizers on bulk density and penetration resistance in semi-arid Mediterranean soil conditions. Geoderma 160 (2):236–43. doi:https://doi.org/10.1016/j.geoderma.2010.09.028.
- Chan, K. Y., and D. P. Heenan. 1999. Microbial-induced soil aggregate stability under different crop rotations. Biology and Fertility of Soils 30 (1–2):29–32. doi:https://doi.org/10.1007/s003740050583.
- Christou, M., E. J. Avramides, J. P. Roberts, and D. L. Jones. 2005. Dissolved organic nitrogen in contrasting agricultural ecosystems. Soil Biology & Biochemistry 37 (8):1560–63. doi:https://doi.org/10.1016/j.soilbio.2005.01.025.
- Čoja, T., K. Zehetner, A. Bruckner, A. Watzinger, and E. Meyer. 2008. Efficacy and side effects of five sampling methods for soil earthworms (Annelida, Lumbricidae). Ecotoxicology and Environmental Safety 71 (2):552–65. doi:https://doi.org/10.1016/j.ecoenv.2007.08.002.
- Crossley, D. A., Jr, B. R. Mueller, and J. C. Perdue. 1992. Biodiversity of microarthropods in agricultural soils: Relations to processes. Agriculture, Ecosystems & Environment 40 (1–4):37–46. doi:https://doi.org/10.1016/0167-8809(92)90082-M.
- Culik, M. P., J. L. de Souza, and J. A. Ventura. 2002. Biodiversity of Collembola in tropical agricultural environments of Espırito Santo, Brazil. Applied Soil Ecology 21 (1):49–58. doi:https://doi.org/10.1016/S0929-1393(02)00048-3.
- Dane, J. H., and J. W. Hopmans. 2002. Pressure plate extractor. In Methods of soil analysis, Part 4: physical methods, ed. J. H. Dane and C. G. Topp, 684. Madison, WI: Soil Science Society of America.
- Davis, A. S., J. D. Hill, C. A. Chase, A. M. Johanns, M. Liebman, and J. P. Hart. 2012. Increasing cropping system diversity balances productivity, profitability and environmental health. PLoS One 7 (10):e47149. doi:https://doi.org/10.1371/journal.pone.0047149.
- de Bruyn, L. A. L. 1997. The status of soil macrofauna as indicators of soil health to monitor the sustainability of Australian agricultural soils. Ecological Economics 23 (2):167–78. doi:https://doi.org/10.1016/S0921-8009(97)00052-9.
- De, M., J. A. Riopel, L. J. Cihacek, M. Lawrinenko, R. Baldwin‐Kordick, S. J. Hall, and M. D. McDaniel. 2020. Soil health recovery after grassland reestablishment on cropland–the effects of time and topographic position. Soil Science Society of America Journal 84 (2):568–86. doi:https://doi.org/10.1002/saj2.20007.
- Degens, B. P. 1997. Macro-aggregation of soils by biological bonding and binding mechanisms and the factors affecting these: A review. Soil Research 35 (3):431–60. doi:https://doi.org/10.1071/S96016.
- Deng, S., H. Kang, and C. Freeman. 2011. Microplate fluorimetric assay of soil enzymes. Methods of Soil Enzymology 9:311–18.
- Dick, R. P. 1992. A review: Long-term effects of agricultural systems on soil biochemical and microbial parameters. Agriculture, Ecosystems & Environment 40 (1–4):25–36. doi:https://doi.org/10.1016/0167-8809(92)90081-L.
- Doane, T. A., and W. R. Horwáth. 2003. Spectrophotometric determination of nitrate with a single reagent. Analytical Letters 36 (12):2713–22. doi:https://doi.org/10.1081/AL-120024647.
- Doran, J. W. 1996. Soil health and global sustainability. In Soil quality is in the hands of the land manager, ed. R. J. MacEwan and M. R. Carter., Vol. 45, 46. Ballarat, Victoria, Australia: CRC.
- Doran, J., and M. Zeiss. 2000. Soil health and sustainability: Managing the biotic component of soil quality. Applied Soil Ecology 15 (1):3–11. doi:https://doi.org/10.1016/S0929-1393(00)00067-6.
- Drenovsky, R. E., D. Vo, K. J. Graham, and K. M. Scow. 2004. Soil water content and organic carbon availability are major determinants of soil microbial community composition. Microbial Ecology 48 (3):424–30. doi:https://doi.org/10.1007/s00248-003-1063-2.
- Edwards, C. A., and Lofty, J. R. 1969. The influence of agricultural practices on soil micro-arthropod populations. In The Soil Ecosystem, J. Sheals (Ed.), pp. 237–47.London: Systematics Association Publication.
- Edwards, J. H., C. W. Wood, D. L. Thurlow, and M. E. Ruf. 1992. Tillage and crop rotation effects on fertility status of a hapludult soil. Soil Science Society of America Journal 56 (5):1577–88. doi:https://doi.org/10.2136/sssaj1992.03615995005600050040x.
- Ehlers, W. 1975. Observations on earthworm channels and infiltration on tilled and untilled loess soil. Soil Science 119 (3):242–49. doi:https://doi.org/10.1097/00010694-197503000-00010.
- Ekblad, A., and A. Nordgren. 2002. Is growth of soil microorganisms in boreal forests limited by carbon or nitrogen availability? Plant and Soil 242 (1):115–22. doi:https://doi.org/10.1023/A:1019698108838.
- Elkins, C. B., R. L. Haaland, and C. S. Hoveland. 1977. Grass roots as a tool for penetrating soil hardpans and increasing crop yields [Paspalum notatum, Festuca arundinacea, cotton, tillage]. Proceedings Southern Pasture and Forage Crop Improvement Conference, April 12-14, 1977, Auburn University, Auburn, AL.
- Evans, C. D., B. Reynolds, A. Jenkins, R. C. Helliwell, C. J. Curtis, C. L. Goodale, R. C. Ferrier, B. A. Emmett, M. G. Pilkington, and S. J. M. Caporn. 2006. Evidence that soil carbon pool determines susceptibility of semi-natural ecosystems to elevated nitrogen leaching. Ecosystems 9 (3):453–62. doi:https://doi.org/10.1007/s10021-006-0051-z.
- FAO. 2015. Soil ecosystem services [WWW Document]. Food Agric. Organ. United Nations, http://www.fao.org/resources/infographics/infographics-details/en/c/284478
- Franzluebbers, A. J., M. R. Pershing, C. Crozier, D. Osmond, and M. Schroeder-Moreno. 2018. Soil-test biological activity with the flush of co2: i. c and n characteristics of soils in corn production. Soil Science Society of America Journal 82 (3):685–95. doi:https://doi.org/10.2136/sssaj2017.12.0433.
- Franzluebbers, A. J., R. L. Haney, F. M. Hons, and D. A. Zuberer. 1996. Determination of microbial biomass and nitrogen mineralization following rewetting of dried soil. Soil Science Society of America Journal 60 (4):1133–39. doi:https://doi.org/10.2136/sssaj1996.03615995006000040025x.
- Franzluebbers, A. J. 2018. Soil-test biological activity with the flush of CO2: III. Corn yield responses to applied nitrogen. Soil Science Society of America Journal 82 (3):708–21. doi:https://doi.org/10.2136/sssaj2018.01.0029.
- Franzmeier, D. P., G. D. Lemme, and R. J. Miles. 1985. Organic carbon in soils of north central United States. Soil Science Society of America Journal 49 (3):702–08. doi:https://doi.org/10.2136/sssaj1985.03615995004900030035x.
- Gaudin, A. C. M., T. N. Tolhurst, A. P. Ker, K. Janovicek, C. Tortora, R. C. Martin, W. Deen, and J. L. Gonzalez-Andujar. 2015. Increasing crop diversity mitigates weather variations and improves yield stability. PLoS One 10 (2):e0113261. doi:https://doi.org/10.1371/journal.pone.0113261.
- Gaupp-Berghausen, M., M. Hofer, B. Rewald, and J. G. Zaller. 2015. Glyphosate-based herbicides reduce the activity and reproduction of earthworms and lead to increased soil nutrient concentrations. Scientific Reports 5 (1):12886. doi:https://doi.org/10.1038/srep12886.
- Geisseler, D., and K. M. Scow. 2014. Long-term effects of mineral fertilizers on soil microorganisms – A review. Soil Biology & Biochemistry 75:54–63. doi:https://doi.org/10.1016/j.soilbio.2014.03.023.
- Goidts, E., B. Van Wesemael, and M. Crucifix. 2009. Magnitude and sources of uncertainties in soil organic carbon (SOC) stock assessments at various scales. European Journal of Soil Science 60 (5):723–39. doi:https://doi.org/10.1111/j.1365-2389.2009.01157.x.
- Grandy, A. S., and J. C. Neff. 2008. Molecular C dynamics downstream: The biochemical decomposition sequence and its impact on soil organic matter structure and function. Science of the Total Environment 404 (2–3):297–307. doi:https://doi.org/10.1016/j.scitotenv.2007.11.013.
- Green, T. R., H. Kipka, O. David, and G. S. McMaster. 2018. Where is the USA Corn Belt, and how is it changing? Science of the Total Environment 618:1613–18. doi:https://doi.org/10.1016/j.scitotenv.2017.09.325.
- Grossman, R. B., and T. G. Reinsch. 2002. Core method. In Methods of soil analysis, part 4: physical methods, ed. W. A. Dick, L. Al-Almoodi, J. H. Dane, and C. G. Topp, 207. Madison, WI: Soil Science Society of America.
- Guo, L. B., and R. M. Gifford. 2002. Soil carbon stocks and land use change: A meta analysis. Global Change Biology 8 (4):345–60. doi:https://doi.org/10.1046/j.1354-1013.2002.00486.x.
- Hatfield, J. L., L. D. McMullen, and C. S. Jones. 2009. Nitrate-nitrogen patterns in the Raccoon River Basin related to agricultural practices. Journal of Soil and Water Conservation 64 (3):190–99. doi:https://doi.org/10.2489/jswc.64.3.190.
- Hatfield, J. L., L. Wright-Morton, and B. Hall. 2018. Vulnerability of grain crops and croplands in the Midwest to climatic variability and adaptation strategies. Climatic Change 146 (1–2):263–75. doi:https://doi.org/10.1007/s10584-017-1997-x.
- Hatfield, J. L., T. J. Sauer, and J. H. Prueger. 2001. Managing soils to achieve greater water use efficiency. Agronomy Journal 93 (2):271–80. doi:https://doi.org/10.2134/agronj2001.932271x.
- Hayes, M. 2013. 13. The drought risk management paradigm in the context of climate change. In Climate Change on the Midwest impacts: Risks, vulneraility, and adaptation, ed. S. C. Pryor, 178. Bloomington, In Indiana University Press.
- Haynes, R. J. 2005. Labile organic matter fractions as central components of the quality of agricultural soils: An overview. Advances in Agronomy 85:221–68.
- Helling, C. S., G. Chesters, and R. B. Corey. 1964. Contribution of organic matter and clay to soil cation-exchange capacity as affected by the pH of the saturating solution 1. Soil Science Society of America Journal 28 (4):517–20. doi:https://doi.org/10.2136/sssaj1964.03615995002800040020x.
- Hendrix, P. F. 2006. Biological invasions belowground—earthworms as invasive species. In Biological invasions belowground: Earthworms as invasive species, 1–4. Dordrecht, The Netherlands: Springer.
- Hessel, D. A., 2014. Deciphering the genetic architecture of native resistance and tolerance to western corn rootworm larval feeding. Iowa State University Graduate Theses and Dissertations, 13874. https://lib.dr.iastate.edu/etd/13874
- Hockstad, L., and L. Hanel. 2018. Inventory of U.S. Greenhouse Gas Emissions and Sinks [WWW Document]. United States: N. p., 2018. Web. doi:https://doi.org/10.15485/1464240.
- Hooda, P. S., V. W. Truesdale, A. C. Edwards, P. J. A. Withers, M. N. Aitken, A. Miller, and A. R. Rendell. 2001. Manuring and fertilization effects on phosphorus accumulation in soils and potential environmental implications. Advances in Environmental Research 5 (1):13–21. doi:https://doi.org/10.1016/S1093-0191(00)00037-X.
- Horwath, W. R., and E. A. Paul. 1994. Microbial Biomass. In Methods of soil analysis, part 2: Microbiological and biochemical properties, ed. J. M. Bigham and S. H. Mickelson, 763. Madison, WI: Soil Science Society of America.
- Huhta, V., H. Setälä, and J. Haimi. 1988. Leaching of N and C from birch leaf litter and raw humus with special emphasis on the influence of soil fauna. Soil Biology & Biochemistry 20 (6):875–78. doi:https://doi.org/10.1016/0038-0717(88)90096-X.
- Hunt, N. D., J. D. Hill, and M. Liebman. 2017. Reducing freshwater toxicity while maintaining weed control, profits, and productivity: Effects of increased crop rotation diversity and reduced herbicide usage. Environmental Science & Technology 51 (3):1707–17. doi:https://doi.org/10.1021/acs.est.6b04086.
- Hunt, N. D., J. D. Hill, and M. Liebman. 2019. Cropping system diversity effects on nutrient discharge, Soil erosion, and agronomic performance. Environmental Science & Technology 53 (3):1344–52. doi:https://doi.org/10.1021/acs.est.8b02193.
- Hunt, N. D., M. Liebman, S. K. Thakrar, and J. D. Hill. 2020. Fossil energy use, climate change impacts, and air quality-related human health damages of conventional and diversified cropping systems in Iowa, USA. Environmental Science & Technology 54 (18):11002–14. doi:https://doi.org/10.1021/acs.est.9b06929.
- Jensen, L. S., T. Mueller, J. Magid, and N. E. Nielsen. 1997. Temporal variation of C and N mineralization, microbial biomass and extractable organic pools in soil after oilseed rape straw incorporation in the field. Soil Biology & Biochemistry 29 (7):1043–55. doi:https://doi.org/10.1016/S0038-0717(97)00014-X.
- Joergensen, R. G. 1996. The fumigation-extraction method to estimate soil microbial biomass: Calibration of the Kec value. Soil and Tillage Research 28:25–31.
- Kallenbach, C. M., M. D. Wallenstein, M. E. Schipanksi, and A. S. Grandy. 2019. Managing agroecosystems for soil microbial carbon use efficiency: Ecological unknowns, potential outcomes, and a path forward. Frontiers in Microbiology 10: doi: https://doi.org/10.3389/fmicb.2019.01146.
- Kallenbach, C., and A. S. Grandy. 2011. Controls over soil microbial biomass responses to carbon amendments in agricultural systems: A meta-analysis. Agriculture, Ecosystems & Environment 144 (1):241–52. doi:https://doi.org/10.1016/j.agee.2011.08.020.
- Karlen, D. L., E. G. Hurley, S. S. Andrews, C. A. Cambardella, D. W. Meek, M. D. Duffy, and A. P. Mallarino. 2006. Crop rotation effects on soil quality at three northern Corn/soybean Belt locations. Agronomy Journal 98 (3):484–95. doi:https://doi.org/10.2134/agronj2005.0098.
- Karlen, D. L., G. E. Varvel, D. G. Bullock, and R. M. Cruse. 1994. Crop rotations for the 21st century. Advances in Agronomy 53:1–45.
- Karlen, D. L., M. De, M. D. McDaniel, and D. E. Stott. 2021. Evolution of the soil health movement. In Soil Health Series: Volume 1 Approaches to soil health analysis, Karlen, Douglas L., Stott, Diane E., and Maysoon M., Mikha (Eds.), (pp. 21–48).Madison, WI: Soil Science Society of America.
- Kelner, D. J., J. K. Vessey, and M. H. Entz. 1997. The nitrogen dynamics of 1-, 2-and 3-year stands of alfalfa in a cropping system. Agriculture, Ecosystems & Environment 64 (1):1–10. doi:https://doi.org/10.1016/S0167-8809(97)00019-4.
- King, A. E., G. A. Ali, A. W. Gillespie, and C. Wagner-Riddle. 2020. Soil organic matter as catalyst of crop resource capture. Frontiers in Environmental Science 8:50. doi:https://doi.org/10.3389/fenvs.2020.00050.
- King, A. E., and K. S. Hofmockel. 2017. Diversified cropping systems support greater microbial cycling and retention of carbon and nitrogen. Agriculture, Ecosystems & Environment 240:66–76. doi:https://doi.org/10.1016/j.agee.2017.01.040.
- Kong, A. Y. Y., J. Six, D. C. Bryant, R. F. Denison, and C. van Kessel. 2005. The relationship between carbon input, aggregation, and soil organic carbon stabilization in sustainable cropping systems. Soil Science Society of America Journal 69 (4):1078–85. doi:https://doi.org/10.2136/sssaj2004.0215.
- Kravchenko, A. N., A. K. Guber, B. S. Razavi, J. Koestel, M. Y. Quigley, G. P. Robertson, and Y. Kuzyakov. 2019. Microbial spatial footprint as a driver of soil carbon stabilization. Nature Communications 10:1–10. doi:https://doi.org/10.1038/s41467-018-07882-8.
- Kruczynska, K., and S. Seniczak. 2011. Effect of cattle liquid manure fertilization on the yield of grassland and density of soil oribatid mites (Acari, Oribatida). Biolog Letters 48 (1):13. doi:https://doi.org/10.2478/v10120-011-0003-y.
- Kunkel, K. E., T. R. Karl, H. Brooks, J. Kossin, J. H. Lawrimore, D. Arndt, L. Bosart, D. Changnon, S. L. Cutter, and N. Doesken. 2013. Monitoring and understanding trends in extreme storms: State of knowledge. Bulletin of the American Meteorological Society 94 (4):499–514. doi:https://doi.org/10.1175/BAMS-D-11-00262.1.
- Kuznetsova, A., P. B. Brockhoff, and R. H. B. Christensen. 2017. lmerTest package: Tests in linear mixed effects models. Journal of Statistical Software 82: doi: https://doi.org/10.18637/jss.v082.i13.
- Lafond, J., D. A. Angers, and M. R. Laverdière. 1993. Water-stable macroaggregation in soils amended with various organic materials. Proceedings of the Eastern Canada Soil Structure Workshop, Universite Laval, Canada, pp. 115–27.
- Larson, W., C. E. Clapp, W. H. Pierre, and Y. B. Morachan. 1972. Effects of increasing amounts of organic residues on continuous corn: II. Organic carbon, nitrogen, phosphorus, and sulfur1. Agronomy Journal 64 (2):204–09. doi:https://doi.org/10.2134/agronj1972.00021962006400020023x.
- Lazicki, P. A., M. Liebman, and M. M. Wander. 2016. Root parameters show how management alters resource distribution and soil quality in conventional and low-input cropping systems in Central Iowa. PLoS One 11 (10):e0164209. doi:https://doi.org/10.1371/journal.pone.0164209.
- Lehman, R. M., V. Acosta-Martinez, J. S. Buyer, C. A. Cambardella, H. P. Collins, T. F. Ducey, J. J. Halvorson, V. L. Jin, J. M. F. Johnson, R. J. Kremer, et al. 2015. Soil biology for resilient, healthy soil. Journal of Soil and Water Conservation 70 (1):12A–18A. doi:https://doi.org/10.2489/jswc.70.1.12A.
- Lenth, R. 2019. Estimated marginal means, aka least-squares means. R Package Documentation 34:216–21.
- Li, L.-J., X. Zhu-Barker, R. Ye, T. A. Doane, and W. R. Horwath. 2018a. Soil microbial biomass size and soil carbon influence the priming effect from carbon inputs depending on nitrogen availability. Soil Biology & Biochemistry 119:41–49. doi:https://doi.org/10.1016/j.soilbio.2018.01.003.
- Li, Z., D. Tian, B. Wang, J. Wang, S. Wang, H. Y. H. Chen, X. Xu, C. Wang, N. He, and S. Niu. 2018b. Microbes drive global soil nitrogen mineralization and availability. Global Change Biology 25 (3):1078–88. doi:https://doi.org/10.1111/gcb.14557.
- Li, Z., Z. Zeng, D. Tian, J. Wang, Z. Fu, B. Wang, Z. Tang, W. Chen, H. Y. H. Chen, C. Wang, et al. 2020. The stoichiometry of soil microbial biomass determines metabolic quotient of nitrogen mineralization. Environmental Research Letters 15 (3):34005. doi:https://doi.org/10.1088/1748-9326/ab6a26.
- Liang, C., G. Cheng, D. Wixon, and T. Balser. 2011. An absorbing markov chain approach to understanding the microbial role in soil carbon stabilization. Biogeochemistry 106 (3):303–09. doi:https://doi.org/10.1007/s10533-010-9525-3.
- Liang, C., J. P. Schimel, and J. D. Jastrow. 2017. The importance of anabolism in microbial control over soil carbon storage. Nature Microbiology 2 (8):1–6. doi:https://doi.org/10.1038/nmicrobiol.2017.105.
- Liebman, M., L. R. Gibson, D. N. Sundberg, A. H. Heggenstaller, P. R. Westerman, C. A. Chase, R. G. Hartzler, F. D. Menalled, A. S. Davis, and P. M. Dixon. 2008. Agronomic and economic performance characteristics of conventional and low-external-input cropping systems in the central Corn Belt. Agronomy Journal 100 (3):600–10. doi:https://doi.org/10.2134/agronj2007.0222.
- Lin, B. B. 2011. Resilience in agriculture through crop diversification: adaptive management for environmental change. Bioscience 61 (3):49–58. doi:https://doi.org/10.1525/bio.2011.61.3.4.
- Liu, C., M. Lu, J. Cui, B. Li, and C. Fang. 2014. Effects of straw carbon input on carbon dynamics in agricultural soils: A meta‐analysis. Global Change Biology 20 (5):1366–81. doi:https://doi.org/10.1111/gcb.12517.
- Liu, X., C. Lee Burras, Y. S. Kravchenko, A. Duran, T. Huffman, H. Morras, G. Studdert, X. Zhang, R. M. Cruse, and X. Yuan. 2012. Overview of Mollisols in the world: Distribution, land use and management. Canadian Journal of Soil Science 92 (3):383–402. doi:https://doi.org/10.4141/cjss2010-058.
- Lobell, D. B., M. J. Roberts, W. Schlenker, N. Braun, B. B. Little, R. M. Rejesus, and G. L. Hammer. 2014. Greater sensitivity to drought accompanies maize yield increase in the US Midwest. Science 344 (80):516–19. doi:https://doi.org/10.1126/science.1251423.
- Long, G.-Q., Y.-J. Jiang, and B. Sun. 2015. Seasonal and inter-annual variation of leaching of dissolved organic carbon and nitrogen under long-term manure application in an acidic clay soil in subtropical China. Soil and Tillage Research 146:270–78. doi:https://doi.org/10.1016/j.still.2014.09.020.
- Lowery, B., and J. E. Morrison. 2002. Soil penetrometers and penetrability. In Methods of soil analysis, part 4: Physical methods, ed. W. A. Dick, L. Al-Almoodi, J. H. Dane, and G. C. Topp, 363–85. Madison, WI: Soil Science Society of America.
- Lupwayi, N. Z., W. A. Rice, and G. W. Clayton. 1999. Soil microbial biomass and carbon dioxide flux under wheat as influenced by tillage and crop rotation. Canadian Journal of Soil Science 79 (2):273–80. doi:https://doi.org/10.4141/S98-052.
- Lynch, J. M. 1984 Interactions between biological processes, cultivation and soil structure. Plant Soil 76:307–18.
- MacDonald, J. M., and W. D. McBride. 2009. The transformation of US livestock agriculture scale, efficiency, and risks. Economic Information Bulletin 43 (No. 1476–2016–121035):1–36.
- Manzoni, S., P. Taylor, A. Richter, A. Porporato, and G. I. Ågren. 2012. Environmental and stoichiometric controls on microbial carbon‐use efficiency in soils. New Phytologist 196 (1):79–91. doi:https://doi.org/10.1111/j.1469-8137.2012.04225.x.
- Matson, P. A., R. Naylor, and I. Ortiz-Monasterio. 1998. Integration of environmental, agronomic, and economic aspects of fertilizer management. Science 280 (5360):112–15. doi:https://doi.org/10.1126/science.280.5360.112.
- McDaniel, M. D., and A. S. Grandy. 2016. Soil microbial biomass and function are altered by 12 years of crop rotation. Soil 2 (4):583–99. doi:https://doi.org/10.5194/soil-2-583-2016.
- McDaniel, M. D., A. S. Grandy, L. K. Tiemann, and M. N. Weintraub. 2014a. Crop rotation complexity regulates the decomposition of high and low quality residues. Soil Biology & Biochemistry 78:243–54. doi:https://doi.org/10.1016/j.soilbio.2014.07.027.
- McDaniel, M. D., L. K. Tiemann, and A. S. Grandy. 2014b. Does agricultural crop diversity enhance soil microbial biomass and organic matter dynamics? A meta-analysis. Ecological Applications 24 (3):560–70. doi:https://doi.org/10.1890/13-0616.1.
- McDowell, W. H., W. S. Currie, J. D. Aber, and Y. Yang. 1998. Effects of chronic nitrogen amendments on production of dissolved organic carbon and nitrogen in forest soils. In Biogeochemical investigations at watershed, landscape, and regional scales (pp. 175–82). Dordrecht, Netherlands: Springer.
- McGill, W. B., K. R. Cannon, J. A. Robertson, and F. D. Cook. 1986. Dynamics of soil microbial biomass and water-soluble organic C in Breton L after 50 years of cropping to two rotations. Canadian Journal of Soil Science 66 (1):1–19. doi:https://doi.org/10.4141/cjss86-001.
- Mehlich, A. 1984. Mehlich 3 soil test extractant: A modification of Mehlich 2 extractant. Communications in Soil Science and Plant Analysis 15 (12):1409–16. doi:https://doi.org/10.1080/00103628409367568.
- Mesonet, I. A., 2020. ISU Mesonet - Iowa State University Iowa environmental Mesonet climate data. URL https://mesonet.agron.iastate.edu
- Montgomery, D. R. 2007. Soil erosion and agricultural sustainability. Proceedings of the National Academy of Sciences 104 (33):13268–72. doi:https://doi.org/10.1073/pnas.0611508104.
- Munkholm, L. J., R. J. Heck, and B. Deen. 2013. Long-term rotation and tillage effects on soil structure and crop yield. Soil and Tillage Research 127:85–91.
- NASS, 2016. United States department of agriculture. Crop Production 2015 Summary. 1057-7823
- Nelson, D. W., and L. E. Sommers. 1996. Total carbon, organic carbon, and organic matter. In Methods of soil analysis, part 3: Chemical methods, ed. J. M. Bartels and J. M. Bigham, 961. Madison, WI: Soil Science Society of America.
- Nimmo, J. R., and K. S. Perkins. 2002. Methods of soil analysis. In Methods of soil analysis, part 4: Physical methods, ed. J. H. Dane and G. C. Topp, 317–27. Madison, WI: Soil Science Society of America.
- Ort, D. R., and S. P. Long. 2014. Limits on yields in the corn belt. Science 344:484–85.
- Osler, G. H. R., L. Harrison, D. K. Kanashiro, and M. J. Clapperton. 2008. Soil microarthropod assemblages under different arable crop rotations in Alberta, Canada. Applied Soil Ecology 38 (1):71–78. doi:https://doi.org/10.1016/j.apsoil.2007.09.003.
- Ozlu, E., S. Kumar, and F. J. Arriaga. 2019. Responses of long-term cattle manure on soil physical and hydraulic properties under a corn–soybean rotation at two locations in eastern South Dakota. Soil Science Society of America Journal 83 (5):1459–67. doi:https://doi.org/10.2136/sssaj2019.03.0077.
- Panayiotopoulos, K. P., C. P. Papadopoulou, and A. Hatjiioannidou. 1994. Compaction and penetration resistance of an Alfisol and Entisol and their influence on root growth of maize seedlings. Soil and Tillage Research 31 (4):323–37. doi:https://doi.org/10.1016/0167-1987(94)90039-6.
- Partey, S. T., R. F. Preziosi, and G. D. Robson. 2014. Improving maize residue use in soil fertility restoration by mixing with residues of low C-to-N ratio: Effects on C and N mineralization and soil microbial biomass. Journal of Soil Science and Plant Nutrition 14:518–31.
- Patel, M. S., and N. T. Singh. 1981. Changes in bulk density and water intake rate of a coarse textured soil in relation to different levels of compaction. Journal of the Indian Society of Soil Science 29:110–12.
- Pearson, C. J. 2007. Regenerative, semiclosed systems: A priority for twenty-first-century agriculture. Bioscience 57 (5):409–18. doi:https://doi.org/10.1641/B570506.
- Poffenbarger, H. J., D. C. Olk, C. Cambardella, J. Kersey, M. Liebman, A. Mallarino, J. Six, and M. J. Castellano. 2020. Whole-profile soil organic matter content, composition, and stability under cropping systems that differ in belowground inputs. Agriculture, Ecosystems & Environment 291:106810. doi:https://doi.org/10.1016/j.agee.2019.106810.
- Poffenbarger, H., G. Artz, G. Dahlke, W. Edwards, M. Hanna, J. Russell, H. Sellers, and M. Liebman. 2017. An economic analysis of integrated crop-livestock systems in Iowa, USA. Agriculture Systems 157:51–69. doi:https://doi.org/10.1016/j.agsy.2017.07.001.
- Pryor, S. C., R. J. Barthelmie, and J. T. Schoof. 2013. High-resolution projections of climate-related risks for the Midwestern USA. Climate Research 56 (1):61–79. doi:https://doi.org/10.3354/cr01143.
- Rabalais, N. N., R. E. Turner, and W. J. Wiseman Jr. 2002. Gulf Of Mexico hypoxia, aka “The dead zone.” Annual Review of Ecology and Systematics 33:235–63.
- Rabalais, N. N., R. E. Turner, and W. J. Wiseman. 2001. Hypoxia in the Gulf Of Mexico. Journal of Environmental Quality 30 (2):320–29. doi:https://doi.org/10.2134/jeq2001.302320x.
- Randall, G. W., and J. A. Vetsch. 2005. Nitrate losses in subsurface drainage from a corn–soybean rotation as affected by fall and spring application of nitrogen and nitrapyrin. Journal of Environmental Quality 34 (2):590–97. doi:https://doi.org/10.2134/jeq2005.0590.
- Reddy, M. V. 1984. Seasonal fluctuation of different edaphic microarthropod population densities in relation to soil moisture and temperature in a pine,Pinus kesiya Royle plantation ecosystem. International Journal of Biometeorology 28 (1):55–59. doi:https://doi.org/10.1007/BF02193515.
- Rochette, P., and E. G. Gregorich. 1998. Dynamics of soil microbial biomass C, soluble organic C and CO2 evolution after three years of manure application. Canadian Journal of Soil Science 78 (2):283–90. doi:https://doi.org/10.4141/S97-066.
- Roesch-mcnally, G. E., J. G. Arbuckle, and J. C. Tyndall. 2018. Barriers to implementing climate resilient agricultural strategies: The case of crop diversification in the US Corn Belt. Global Environmental Change 48:206–15.
- Rosolem, C. A., J. S. S. Foloni, and C. S. Tiritan. 2002. Root growth and nutrient accumulation in cover crops as affected by soil compaction. Soil and Tillage Research 65 (1):109–15. doi:https://doi.org/10.1016/S0167-1987(01)00286-0.
- Russelle, M. P., and A. S. Birr. 2004. Large-scale assessment of symbiotic dinitrogen fixation by crops. Agronomy Journal 96 (6):1754–60. doi:https://doi.org/10.2134/agronj2004.1754.
- Sadeghpour, A., Q. M. Ketterings, G. S. Godwin, and K. J. Czymmek. 2016. Nitrogen‐vs. phosphorus‐based manure and compost management of corn. Agronomy Journal 108 (1):185–95. doi:https://doi.org/10.2134/agronj2015.0218.
- Sauvadet, M., M. Chauvat, D. Cluzeau, P.-A. Maron, C. Villenave, and I. Bertrand. 2016. The dynamics of soil micro-food web structure and functions vary according to litter quality. Soil Biology & Biochemistry 95:262–74. doi:https://doi.org/10.1016/j.soilbio.2016.01.003.
- Schlegel, A. J., K. C. Dhuyvetter, and J. L. Havlin. 1996. Economic and environmental impacts of long-term nitrogen and phosphorus fertilization. Journal of Production Agriculture 9 (1):114–18. doi:https://doi.org/10.2134/jpa1996.0114.
- Schoof, J. T., S. C. Pryor, and J. Surprenant. 2010. Development of daily precipitation projections for the United States based on probabilistic downscaling. Journal of Geophysical Research Atmospheres 115 (D13). doi:https://doi.org/10.1029/2009JD013030.
- Setälä, H., E. Martikainen, M. Tyynismaa, and V. Huhta. 1990. Effects of soil fauna on leaching of nitrogen and phosphorus from experimental systems simulating coniferous forest floor. Biology and Fertility of Soils 10:170–77.
- Sharpley, A. 1999. Agricultural phosphorus, water quality, and poultry production: Are they compatible? Poultry Science 78 (5):660–73. doi:https://doi.org/10.1093/ps/78.5.660.
- Sherwood, S., and N. Uphoff. 2000. Soil health: Research, practice and policy for a more regenerative agriculture. Applied Soil Ecology 15 (1):85–97. doi:https://doi.org/10.1016/S0929-1393(00)00074-3.
- Shipitalo, M. J., R. Protz, and A. D. Tomlin. 1988. Effect of diet on the feeding and casting activity of Lumbricus terrestris and L. rubellus in laboratory culture. Soil Biology & Biochemistry 20 (2):233–37. doi:https://doi.org/10.1016/0038-0717(88)90042-9.
- Sinsabaugh, R. L., S. Manzoni, D. L. Moorhead, A. Richter, and J. Elser. 2013. Carbon use efficiency of microbial communities: Stoichiometry, methodology and modelling. Ecology Letters 16 (7):930–39. doi:https://doi.org/10.1111/ele.12113.
- Skopp, J., M. D. Jawson, and J. W. Doran. 1990. Steady-state aerobic microbial activity as a function of soil water content. Soil Science Society of America Journal 56 (4):1619–25. doi:https://doi.org/10.2136/sssaj1990.03615995005400060018x.
- Smil, V. 2004. Enriching the earth: Fritz Haber, Carl Bosch, and the transformation of world food production. Cambridge, MA, USA: MIT press.
- Smith, B. D., and M. Nesbitt. 1995. The emergence of agriculture. Nature 375 (6529):289.
- Soong, J. L., L. Fuchslueger, S. Marañon‐Jimenez, M. S. Torn, I. A. Janssens, J. Penuelas, and A. Richter. 2020. Microbial carbon limitation: The need for integrating microorganisms into our understanding of ecosystem carbon cycling. Global Change Biology 26 (4):1953–61. doi:https://doi.org/10.1111/gcb.14962.
- Stanger, T. F., and J. G. Lauer. 2008. Corn grain yield response to crop rotation and nitrogen over 35 years. Agronomy Journal 100 (3):643–50. doi:https://doi.org/10.2134/agronj2007.0280.
- Stewart, C. E., K. Paustian, R. T. Conant, A. F. Plante, and J. Six. 2007. Soil carbon saturation: Concept, evidence and evaluation. Biogeochemistry 86 (1):19–31. doi:https://doi.org/10.1007/s10533-007-9140-0.
- Sumner, M. E., and W. P. Miller. 1996. Cation exchange capacity and exchange coefficients. In Methods of soil analysis, part 3: Chemical methods, ed. J. M. Bigham and J. M. Bartels, 1201. Madison, WI: Soil Science Society of America.
- Sun, R., -X.-X. Zhang, X. Guo, D. Wang, and H. Chu. 2015. Bacterial diversity in soils subjected to long-term chemical fertilization can be more stably maintained with the addition of livestock manure than wheat straw. Soil Biology & Biochemistry 88:9–18. doi:https://doi.org/10.1016/j.soilbio.2015.05.007.
- Thiede, B., L. Greiman, S. Weiler, S. C. Beda, and T. Conroy. 2017. Six charts that illustrate the divide between rural and urban America. The Conversation, https://theconversation.com/six-charts-that-illustrate-the-divide-between-rural-and-urban-america-72934
- Thomas, G. A., R. C. Dalal, and J. Standley. 2007. No-till effects on organic matter, pH, cation exchange capacity and nutrient distribution in a Luvisol in the semi-arid subtropics. Soil and Tillage Research 94 (2):295–304. doi:https://doi.org/10.1016/j.still.2006.08.005.
- Thomas, G. W. 1996. Soil pH and soil acidity. Methods of Soil Analysis Part 3—Chemical Methods 3:475–90.
- Thompson, M. L., H. Zhang, M. Kazemi, and J. A. Sandor. 1989. Contribution of organic matter to cation exchange capacity and specific surface area of fractionated soil materials. Soil Science 148 (4):250–57. doi:https://doi.org/10.1097/00010694-198910000-00003.
- Tomer, M. D., and M. Liebman. 2014. Nutrients in soil water under three rotational cropping systems, Iowa, USA. Agriculture, Ecosystems & Environment 186:105–14. doi:https://doi.org/10.1016/j.agee.2014.01.025.
- Tomlin, A. D., C. M. Tu, and J. J. Miller. 1995. Response of earthworms and soil biota to agricultural practices in corn, soybean and cereal rotations. Acta Zoologica Fennicia 196: 195–99.
- Topp, C. G., and P. A. Ferre. 2002. Gravimetric method using convective oven-drying. In Methods of soil analysis, part 4: Physical methods, ed. W. A. Dick, L. Al-Almoodi, J. H. Dane, and C. G. Topp, 425. Madison, WI: Soil Science Society of America.
- Turner, B. L., D. W. Hopkins, P. M. Haygarth, and N. Ostle. 2002. β-Glucosidase activity in pasture soils. Applied Soil Ecology 20 (2):157–62. doi:https://doi.org/10.1016/S0929-1393(02)00020-3.
- Turner, R. E., and N. N. Rabalais. 2003. Linking landscape and water quality in the Mississippi River basin for 200 years. Bioscience 53 (6):563–72. doi:https://doi.org/10.1641/0006-3568(2003)053[0563:LLAWQI]2.0.CO;2.
- U.S. Department of Commerce, 2009. Local office service assessment – Central Iowa floods of 2008 Late May through Mid June, Report 2008.
- USDA ERS (United States Department of Agriculture, E.R.S. 2018. Cash receipts by commodity, state ranking, 2018. Webpage, https://data.ers.usda.gov/reports.aspx?ID=17844%0A%0A
- Van Groenigen, J. W., I. M. Lubbers, H. M. J. Vos, G. G. Brown, G. B. De Deyn, and K. J. Van Groenigen. 2014. Earthworms increase plant production: A meta-analysis. Scientific Reports 4 (1):6365. doi:https://doi.org/10.1038/srep06365.
- Vermeulen, S., D. Bossio, J. Lehmann, P. Luu, K. Paustian, C. Webb, F. Augé, I. Bacudo, T. Baedeker, and T. Havemann. 2019. A global agenda for collective action on soil carbon. Nature Sustainability 2 (1):2–4. doi:https://doi.org/10.1038/s41893-018-0212-z.
- Villarini, G., J. A. Smith, M. L. Baeck, and W. F. Krajewski. 2011. Examining flood frequency distributions in the Midwest US 1. JAWRA Journal of the American Water Resources Association 47 (3):447–63. doi:https://doi.org/10.1111/j.1752-1688.2011.00540.x.
- Wardle, D. A., and A. Ghani. 1995. A critique of the microbial metabolic quotient (qCO2) as a bioindicator of disturbance and ecosystem development. Soil Biology & Biochemistry 27 (12):1601–10. doi:https://doi.org/10.1016/0038-0717(95)00093-T.
- Wardle, D. A., G. W. Yeates, R. N. Watson, and K. S. Nicholson. 1995. The detritus food-web and the diversity of soil fauna as indicators of disturbance regimes in agro-ecosystems. Plant and Soil 170 (1):35–43. doi:https://doi.org/10.1007/BF02183053.
- Weisberger, D. A., M. D. McDaniel, J. G. Arbuckle, and M. Liebman. 2021. Farmer perspectives on benefits of and barriers to extended crop rotations in Iowa, USA. Agriculture and Environmental Letters 6 (2):e20049.
- Westerman, P. R., M. Liebman, F. D. Menalled, A. H. Heggenstaller, R. G. Hartzler, and P. M. Dixon. 2005. Are many little hammers effective? Velvetleaf (Abutilon theophrasti) population dynamics in two- and four-year crop rotation systems. Weed Science 53 (3):382–92. doi:https://doi.org/10.1614/WS-04-130R.
- Whalen, J. K., C. Chang, G. W. Clayton, and J. P. Carefoot. 2000. Cattle manure amendments can increase the pH of acid soils. Soil Science Society of America Journal 64 (3):962–66. doi:https://doi.org/10.2136/sssaj2000.643962x.
- Wild, B., J. Li, J. Pihlblad, P. Bengtson, and T. Rütting. 2019. Decoupling of priming and microbial N mining during a short-term soil incubation. Soil Biology & Biochemistry 129:71–79. doi:https://doi.org/10.1016/j.soilbio.2018.11.014.
- You, S.-J., Y. Yin, and H. E. Allen. 1999. Partitioning of organic matter in soils: Effects of pH and water/soil ratio. Science of the Total Environment 227 (2–3):155–60. doi:https://doi.org/10.1016/S0048-9697(99)00024-8.
- Zaller, J. G., F. Heigl, L. Ruess, and A. Grabmaier. 2014. Glyphosate herbicide affects belowground interactions between earthworms and symbiotic mycorrhizal fungi in a model ecosystem. Scientific Reports 4 (1):5634. doi:https://doi.org/10.1038/srep05634.
- Zhalnina, K., R. Dias, P. D. de Quadros, A. Davis-Richardson, F. A. O. Camargo, I. M. Clark, S. P. McGrath, P. R. Hirsch, and E. W. Triplett. 2015. Soil pH determines microbial diversity and composition in the park grass experiment. Microbial Ecology 69 (2):395–406. doi:https://doi.org/10.1007/s00248-014-0530-2.
- Zhang, G. S., K. Y. Chan, A. Oates, D. P. Heenan, and G. B. Huang. 2007. Relationship between soil structure and runoff/soil loss after 24 years of conservation tillage. Soil and Tillage Research 92 (1–2):122–28. doi:https://doi.org/10.1016/j.still.2006.01.006.