
Abstract
s-allyl glutathione (SAG) an analogue of glutathione is explored for its antioxidative and liver protection property in recent years. Selenium nanoparticles (Sh-SeNPs) were synthesized using medicinal plant Spermacoce hispida and conjugated with SAG (SAG-Sh-SeNPs). SAG-Sh-SeNPs and Sh-SeNPs were characterized using by Fourier transform infrared spectroscopy, Transmission electron microscopy, Energy dispersive X-ray analysis, X-ray diffraction analysis and zeta potential analysis. SAG-Sh-SeNPs and Sh-SeNPs were evaluated against acetaminophen (APAP)-induced liver and kidney injury in rat. Pretreatment of NPs attenuated the APAP toxicity-induced elevation of kidney and liver injury markers in the blood circulation. Histological observation showed that NPs pretreatment protected the morphology of liver and kidney tissue. SAG-Sh-SeNPs showed enhanced protection against APAP toxicity in comparison to Sh-SeNPs due to synergistic effect of SAG and Sh-SeNPs. SAG-Sh-SeNPs protected the liver and kidney against APAP toxicity through reducing oxidative stress, enhancing endogenous antioxidants and protecting mitochondrial functions.
Introduction
Acetaminophen (APAP) is an effective antipyretic and analgesic drug. APAP is safe and effective to humans at therapeutic dose ranges. However, an overdose of APAP induces acute hepatotoxicity and nephrotoxicity [Citation1–3]. Two important molecular mechanisms are postulated for the induction of liver and kidney toxicity by APAP. The first molecular mechanism is increased accumulation of N-acetyl-p-benzoquinone imine (NAPQI). NAPQI is reactive intermediate formed through oxidation of APAP by cytochrome P450 3A4 and 2E1 (CYP3A4 and CYP2E1) which in turn binds to cellular proteins and initiates toxicity [Citation4,Citation5]. The second molecular mechanism is considered independent of NAPQI formation which involves increase in reactive nitrogen species (RNS) such as nitric oxide (NO) and peroxynitrites. Increase in RNS in turn results in nitration of proteins and ultimately lead to protein degradation [Citation6–8]. Both the oxidative stress and nitrative stress cumulatively causes mitochondrial dysfunction which includes inhibition of respiration, loss of mitochondrial membrane potential, increase of mitochondrial oxidative stress and onset of mitochondrial permeability transition [Citation9–12]. The endpoint of such mitochondrial dysfunction is initiation of apoptosis and necrosis in liver and kidney due to APAP overdose [Citation13].
Detoxification of both NAPQI and RNS such as peroxynitrite is dependent on its conjugation with reduced glutathione (GSH). At a therapeutic dose of APAP, GSH clears these reactive metabolites efficiently. However, at overdose of APAP, exhaustion of GSH is considered as loss of first line of defence against APAP toxicity. These findings suggest that increasing the GSH content is foremost requirement to surmount APAP overdose toxicity [Citation14]. Secondly, protection of mitochondria is also an important factor to prevail APAP overdose toxicity [Citation15]. In such scenario, it is essential to note that selenium nanoparticles (SeNPs) have been studied for its protective effect against APAP toxicity as well as against other dysfunction due to their antioxidant enhancing property in particular induction of glutathione peroxidase (GPx) and GSH content [Citation16–18]. SeNPs have been regarded as safer and efficient to enhance various biological functions, however, the agglomeration of SeNPs affects its bioactivity, biocompatibility and bioavailability. Hence, surface functionalization of SeNPs with biologically active ligand will not only enhance its biological availability but also will synergistically enhance its therapeutic property [Citation19,Citation20]. Considering all the above facts, in the present study, the SeNPs was green synthesized using aqueous leaf extract of medicinally important plant called Spermacoce hispida (Sh-SeNPs). Previous study from our lab has shown the in vitro antioxidant property of the Sh-SeNPs [Citation21]. After synthesis of Sh-SeNPs, it was conjugated with biologically active ligand called s-allyl glutathione (SAG) to produce SAG-Sh-SeNPs to enhance the biological activity. SAG is a synthetic analogue of GSH. Our lab, as well as other groups, has reported various biological activities of SAG such as enhancing antioxidants, decreasing oxidative stress, anti-inflammatory effect and mitochondrial protection in liver and brain against different toxicities such as carbon tetrachloride and lipopolysaccharides, respectively [Citation22–25]. However, biological efficacy of SAG-Sh-SeNPs to defeat oxidative stress or any other pathological condition has not been studied till date. Hence, in the present study, SAG-Sh-SeNPs was synthesized and physicochemical properties were characterized using UV-visible spectrophotometer, transmission electron microscopy (TEM), energy dispersive x-ray spectroscopy (EDX), fourier transform infrared spectroscopy (FTIR), x-ray diffraction (XRD) and zeta potential analysis. Further, SAG-Sh-SeNPs was evaluated for its protective effect against APAP overdose-induced hepatotoxicity and nephrotoxicity in vivo. The rats were orally administered with 0.2 mg/kg of SAG-Sh-SeNPs for 7 days. On the last 2 days, rats were induced acute liver and kidney injury by intra peritoneal (ip) injection of APAP. After treating the animals, various biochemical parameters [aspartate transaminase (AST), alanine transaminase (ALT), alkaline phosphatase (ALP), glutamyl transpeptidase (GGT), lactate dehydrogenase (LDH), bilirubin, triglycerides, urea, uric acid, creatinine and cholesterol in serum; albumin and total protein in plasma] and histology of tissues (liver and kidney) were determined to understand the hepatoprotective and nephroprotective property of SAG-Sh-SeNPs against APAP overdose. Further, the levels of oxidative stress markers, non-enzymatic antioxidants, enzymatic antioxidants, mitochondrial oxidative phosphorylation (OXPHOS) enzyme activities in liver and kidney tissue were determined to understand the molecular mechanism of SAG-Sh-SeNPs protective effect.
Materials and methods
Chemicals and kits
All the chemicals used in the mitochondrial OXPHOS complex assay were procured from Sigma Chemical Company, USA. All the other chemicals used were procured from Himedia Pvt Limited, India and of the highest purity. All the solvents used in the study were purchased from Merck, India. All aqueous solutions were prepared with distilled and de-ionized water. All the enzyme assay kits and protein estimation standard kit were purchased from Coral Clinical systems, Goa, India. SAG was synthesized as described previously [Citation23].
Preparation of SAG conjugated Sh-SeNPs
Sh-SeNPs was prepared as described earlier [Citation21]. Briefly, aqueous leaf extract of S. hispidia (Sh-ALE) was prepared by boiling 5 g of dried leaf powder in 100 ml of distilled water for 5 h. The aqueous extract was filtered and further used for SeNP synthesis. For Sh-SeNPs synthesis, 30 mM selenious acid solution was mixed with Sh-ALE at the ratio of 4:46, pH 9 and incubated at 40 °C for 1 h. The solution was centrifuged at 12,000×g for 10 min to obtain Sh-SeNPs. The Sh-SeNPs was washed five times to remove excess of the selenious acid.
SAG was conjugated onto Sh-SeNPs by a previously reported method with slight modification [Citation26]. About 50 mg of Sh-SeNPs was mixed with 50 mg of SAG in 5 ml of distilled water. The solution was stirred at room temperature in dark for 24 h. At the end of incubation, the solution was centrifuged at 12,000×g for 10 min to harvest the SAG conjugated Sh-SeNPs. The SAG-Sh-SeNPs was washed thrice to remove the unbound SAG. Further, the SAG-Sh-SeNPs was dried and stored at 4 °C until further use.
Physical characterization of NPs
NPs were characterized using UV-visible spectroscopy (Shimadzu UV 1800, Torrance, CA), TEM (JEM 1101 JEOL, Tokyo, Japan), EDX (HITACHI, Model S-3400N, Tokyo, Japan), FTIR (Thermo Scientific, Waltham, MA) in the scanning range of 4000–500 cm−1, XRD (Bruker axs System, D8, Karlsruhe, Germany) and zeta potential using Nano-ZS instrument (Malvern Instruments Limited, Malvern, UK) in order to identify the size, shape, structure, elemental composition and functional group of the particles.
Animals
Twenty-four male Sprague Dawley rats (n = 4 per group; four per cage) were used for the study. The animals were housed in a room with 12 h light and dark cycle, constant humidity (50–60%) and temperature [22 °C–27 °C]. Standard Laboratory diet and water were given ad libitum. All the animal experiments were duly approved by the Committee for the Purpose of Control and Supervision of Experiments on Animals (CPCSEA), Reg No: 1826/PO/EReBi/S/15/CPCSEA, K S Rangasamy College of Technology, Tiruchengode, Tamil Nadu, India. Animal studies are reported in accordance with the ARRIVE guidelines for reporting experiments involving animals.
Animal experiment scheme
After acclimatization, about 24 rats were divided into six groups as follows: Group 1 (control): Oral gavage of distilled water for 7 days; Group 2 (APAP): oral gavage of 600 mg/kg of APAP solubilized in saline for last 2 days; Group 3 (Sh-SeNPs): ip injection of Sh-SeNPs (0.2 mg/kg/day) in saline for 7 days; Group 4 (SAG-Sh-SeNPs): ip injection of SAG-Sh-SeNPs (0.2 mg/kg/day) in saline for 7 days; Group 5 (Sh-SeNPs plus APAP): ip injection of Sh-SeNPs (0.2 mg/kg/day) in saline for 7 days and oral gavage of 600 mg/kg of APAP solubilized in saline for last 2 days; Group 6 (SAG-Sh-SeNPs plus APAP): ip injection of SAG-Sh-SeNPs (0.2 mg/kg/day) in saline for 7 days and oral gavage of 600 mg/kg of APAP solubilized in saline for last 2 days. After 24 h of last administration of APAP, animals were sacrificed by cervical dislocation.
Sample preparation
For serum separation, blood was allowed to clot for 30 min at room temperature. Plasma was separated in the presence of an anticoagulant. The plasma and serum were separated by centrifugation at 4000×g at 4 °C for 15 min. For biochemical analysis, tissue (liver and kidney) homogenates (10%) were prepared using sodium phosphate buffer (0.1 M, pH 7.4) and supernatant was separated by centrifugation at 12,000×g for 30 min. Mitochondria were isolated by differential centrifugation method as described earlier [Citation27]. Briefly, the tissues were homogenized using mitochondrial isolation buffer [10 mM Tris-MOPS (pH 7.4) containing 0.2 M sucrose and 0.001 M EGTA/Tris]. The homogenates were centrifuged at 600×g for 10 min and the supernatant obtained was centrifuged at 7000×g for 10 min at 4 °C. The mitochondrial pellet obtained was suspended in isolation buffer and used for estimation of various biochemical parameters.
Biochemical analysis
Various biochemical parameters (AST, ALT, ALP, GGT, LDH, bilirubin, triglycerides, urea, uric acid, creatinine and cholesterol in serum; albumin and total protein in plasma) were determined using standard kit supplied by Coral clinical systems, Goa, India in accordance with the manufacturer’s instructions. The concentration of reactive oxygen species (ROS) in the tissue homogenate was measured as reduction of nitro blue tetrazolium as described earlier [Citation28]. The concentration of NO was determined using Griess reagent (Sigma Chemical Company, St. Louis, MO, USA) in accordance with the manufacturer’s instructions [Citation29]. LPO as a measure of thiobarbituric acid reactive substances (TBARS) was determined as described earlier [Citation30]. The concentration of GSH and vitamin C was determined in the presence of 5,5′-dithiobis(2-nitrobenzoic acid) (DTNB) and DTC reagent (containing 2,4-dinitrophenylhydrazine, thiourea and copper sulfate), respectively as described earlier [Citation31,Citation32]. The activity of various antioxidant enzymes such as superoxide dismutase (SOD), catalase (CAT) and glutathione peroxidase (GPx) was determined as described earlier [Citation33–35]. Mitochondrial OXPHOS complex I (NADH-dehydrogenase) activity was measured as the reduction of 2, 6-dichlorophenol indophenol in the presence of 200 mM NADH at 600 nm [Citation36]. Complex III (cytochrome-c-reductase) activity was measured as an increase in absorbance due to reduction of cytochrome c at 550 nm [Citation37].
Statistical analysis
All data in this study were presented as mean ± standard deviation. Statistical analysis of the data was performed by one-way analysis of variance (ANOVA) followed by Tukey's multiple range tests for post-hoc analysis using Sigma Stat Version-3.5 software. The significance level was set at p < .05.
Result and discussion
Characterization of SAG-Sh-SeNPs
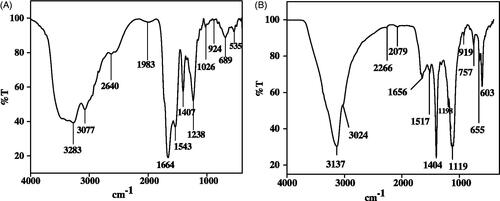
Sh-SeNPs was prepared using aqueous leaf extract of S. hispida as described earlier [Citation21]. SAG was conjugated on the surface of Sh-SeNPs and characterized using various spectroscopic methods. Previous study from our lab has shown the absorption peak for Sh-SeNPs to be 350 nm [Citation21]. The UV-visible spectra obtained for SAG and SAG-Sh-SeNPs showed absorption peak at 305 nm and 326 nm, respectively (). The shift in absorbance peak of Sh-SeNPs from 350 nm to 326 nm for SAG-Sh-SeNPs shows the conjugation of SAG on Sh-SeNPs. TEM analysis revealed the amorphous nature of Sh-SeNPs which is aggregated due to their high surface energy and thus resulting in significant precipitation (). However, SAG-Sh-SeNPs presented monodisperse and spherical structure with a diameter of about 50 nm (). These results suggest that SAG conjugation on SeNPs controlled the dispersibility of the SAG-Sh-SeNPs. The zeta potential of Sh-SeNPs and SAG-Sh-SeNPs was found to be −5.86 mV and −22 mV, respectively (Figure S1). Zeta potential is considered as an important indicator of stability of NPs as well as the good adsorption of ligand (SAG) on the surface of the NPs. Zeta potential also determines the transfection of SeNPs into the cells through its interaction with the cell membrane [Citation19,Citation38]. Hence, SAG-Sh-SeNPs with higher absolute zeta potential value will have a greater stability as well as higher transfection efficiency into cells which can be further used in biological applications. Elemental composition analysis of SAG-Sh-SeNPs employing EDX showed the presence of strong signal for the Se and S atoms. Also, signal for the presence of O atom was noted. The presence of S and O atom indicates that SAG has been conjugated on the surface of SAG-Sh-SeNPs (Figure S2A). The crystal structure and the phase composition of SAG-Sh-SeNPs were determined using XRD pattern (Figure S2B) which is in line with results obtained from TEM analysis. SAG-Sh-SeNPs was crystalline in nature with calculated grain size of 46.8 nm using Scherrer‘s formula. The diffraction peaks at 23°, 30°, 43°, 45°, 51°, 56°, 61° and 65° can be index to the crystal planes of (100), (101), (102), (111), (201), (003), (103) and (210) crystalline Se and well matched with the Standard Joint Committee on Powder Diffraction Standards values (JCPDS) data (06–0362). FT-IR spectrum further confirmed the conjugation of SAG on the surface of SAG-Sh-SeNPs (). The FT-IR spectrum of SAG showed the presence of bands at 3283 cm−1, 3077 cm−1, 2640 cm−1, 1664 cm−1 and 924 cm−1 assigned to the N–H, C–H, H–C = O, C = O and CH = CH2 functional group (). In SAG-Sh-SeNPs spectrum, presence of bands at 3137 cm−1, 3024 cm−1, 1656 cm−1 and 919 cm−1 is observed which is similar to SAG spectrum in turn confirms the conjugation of SAG on the surface of SAG-Sh-SeNPs (). Thus synthesized SAG-Sh-SeNPs was evaluated for its potential to prevent APAP-induced hepatotoxicity and nephrotoxicity in vivo.
Figure 1 (A) UV-visible spectrum of SAG and SAG-Sh-SeNPs. Representative TEM image of Sh-SeNPs (B) and SAG-Sh-SeNPs (C).
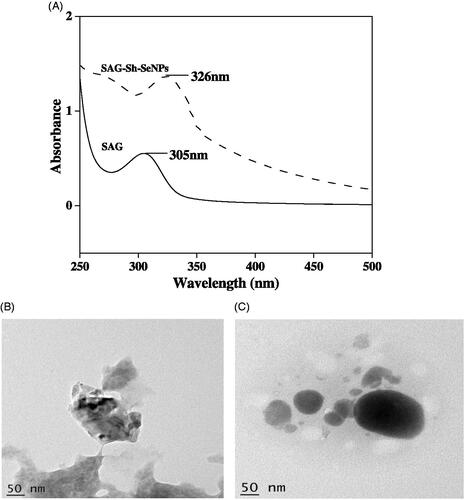
Figure 2 FTIR spectrum of (A) SAG and (B) SAG-Sh-SeNPs.
SAG-Sh-SeNPs protected the liver and kidney against APAP toxicity as evidenced through biochemical and histological evaluation
Administration of APAP resulted in significant rise in hepatic enzymes (AST, ALT, ALP, GGT and LDH) and bilirubin in the serum in comparison to control animals (). Also, the total proteins and albumin level were decreased significantly in comparison to control animal. In addition, the level of kidney dysfunctional markers such as urea, uric acid and creatinine was significantly elevated in APAP intoxicated rat (). Sh-SeNPs and SAG-Sh-SeNPs treatment did not affect the liver and kidney function as evidenced by maintenance of biochemical markers concentration equivalent to that of control group. However, pretreatment with either Sh-SeNPs or SAG-Sh-SeNPs alone has eased the pathological alteration of biochemical parameters which in turn depicts the amelioration of the liver and kidney functional impairment by NPs. The results clearly depict that SAG-Sh-SeNPs showed enhanced protective effect against APAP in comparison to Sh-SeNPs treatment alone.
Table 1. Effect of NPs on the activities of liver-specific functional markers in serum and plasma against.
Table 2. Effect of NPs on the level of kidney-specific functional markers in serum of APAP-induced kidney toxicity in rat.
Histological examination of liver (Figure S3) from control and NPs (Sh-SeNPs and SAG-Sh-SeNPs) alone treated groups showed normal morphology of hepatocyte with well-defined sinusoids (Figure S3A, S3B and S3C). APAP toxicity resulted in highly vacuolated hepatocyte, pyknotic nuclei, necrosis and haemorrhage (Figure S3D). Sh-SeNPs (Figure S3E) and SAG-Sh-SeNPs (Figure S3F) pretreatment protected the liver against APAP-induced necrotic changes. The hepatic architecture was preserved with apparently normal hepatocyte. In some areas, a few cells were very mildly degenerated but without toxic changes compared to APAP group. The kidney tissues obtained from control and NPs (Sh-SeNPs and SAG-Sh-SeNPs) alone treated groups showed normal architecture of glomeruli and tubules (Figure S4A, S4B and S4C). In animals treated with APAP, swelling and distention of tubule epithelium were noted. Also, severe vacuolar degeneration was observed (Figure S4D). Sh-SeNPs (Figure S4E) and SAG-Sh-SeNPs (Figure S4F) pretreatment protected the kidney against APAP-induced severe tubular and glomerular damages. These histological observations were in line with biochemical findings. In recent years, drug-induced liver and kidney injuries have become a major clinical problem. Liver is the major organ of metabolism as well as detoxification. APAP administration has resulted in parenchymal cells necrosis and cholestatic injury which is reflected as increased liver injury markers in the serum as well as decreased protein synthesis from the liver [Citation3,Citation39–41]. Kidney is involved in excretion of drugs and its metabolites. Acute tubular necrosis has resulted in decreased urea and creatinine excretion due to APAP toxicity [Citation42]. The result from the present study is in concordance with various previous studies which consistently show that high dose of APAP induces liver and kidney damage [Citation3,Citation39–43]. Although previous study has shown the protective effect of SeNPs against APAP liver toxicity [Citation16], the result from the present study clearly indicates that SAG-Sh-SeNPs due to synergistic effect of SAG and SeNPs is advantageous than Sh-SeNPs alone in rendering protection against APAP-induced liver and kidney toxicity. Further antioxidative effect of SAG-Sh-SeNPs in bringing about such protective effect has been elucidated.
SAG-Sh-SeNPs decreased the oxidative stress and preserved the antioxidant status of the liver and kidney against APAP toxicity
Two important mechanisms have been postulated for inducing liver and kidney toxicity by APAP overdose: (1) NAPQI accumulation causing covalent binding of NAPQI to the proteins leading to increased oxidative stress [Citation4,Citation5]; (2) increased nitrosative stress independent of NAPQI formation and resulting in ubiquitination of nitrated protein [Citation6,Citation8]. Both the mechanisms ultimately lead to protein, DNA and lipid damage which causes necrosis. In accordance with these notions, in the present study APAP administration has significantly increased the concentration of ROS and NO. Such an increase in reactive oxidants concentration has, in turn, elevated the concentration of MDA which predicts the LPO and cell membrane injury in liver and kidney (). Such an increase in oxidative stress under APAP treatment has been accompanied with decreased concentration of non-enzymatic antioxidants such as GSH and vitamin C () as well as activities of enzymatic antioxidants such as SOD, CAT and GPx in liver and kidney (). Sh-SeNPs and SAG-Sh-SeNPs treatment alone did not affect the concentration of these oxidative stress markers as well as antioxidants concentration. However, pretreatment with SAG-Sh-SeNPs prevented the oxidative stress () and preserved the level of antioxidants () against APAP toxicity in both liver and kidney. The protection rendered by SAG-Sh-SeNPs is higher than Sh-SeNPs treatment against APAP toxicity.
Figure 3 Effect of Sh-SeNPs and SAG-Sh-SeNPs against APAP toxicity-induced oxidative stress such as ROS generation, NO concentration, and lipid peroxidation in rat liver and kidney. Results are expressed as % variation in comparison to control animals as mean ± SD (n = 4 per group). *p < .05 vs. control; #p < .05 vs. APAP treated rat. The 100% value of NBT reduction, NO concentration and MDA concentration corresponds to, liver: 0.344 ± 0.009; kidney: 0.28 ± 0.08 OD at 630 nm/mg tissue, liver: 810 ± 24.52; kidney: 790 ± 21.82 n moles/mg of protein and liver: 0.08 ± 0.003; kidney: 1.01 ± 0.008 n moles/mg of protein, respectively. [![]()
![Figure 3 Effect of Sh-SeNPs and SAG-Sh-SeNPs against APAP toxicity-induced oxidative stress such as ROS generation, NO concentration, and lipid peroxidation in rat liver and kidney. Results are expressed as % variation in comparison to control animals as mean ± SD (n = 4 per group). *p < .05 vs. control; #p < .05 vs. APAP treated rat. The 100% value of NBT reduction, NO concentration and MDA concentration corresponds to, liver: 0.344 ± 0.009; kidney: 0.28 ± 0.08 OD at 630 nm/mg tissue, liver: 810 ± 24.52; kidney: 790 ± 21.82 n moles/mg of protein and liver: 0.08 ± 0.003; kidney: 1.01 ± 0.008 n moles/mg of protein, respectively. [Display full size Control; Display full size APAP; Display full sizeSh-SeNPs; Display full sizeSAG-Sh-SeNPs; Display full sizeSh-SeNPs + APAP; Display full size SAG-Sh-SeNPs + APAP].](/cms/asset/489bdec4-75d5-4b95-b281-590ae3c5679f/ianb_a_1543192_f0003_b.jpg)
Figure 4 Effect of Sh-SeNPs and SAG-Sh-SeNPs against APAP toxicity-induced decrease in non-enzymatic antioxidants (GSH and vitamin C) and enzymatic antioxidants (SOD, catalase and GPx) in rat liver and kidney. Results are expressed as % variation in comparison to control animals as mean ± SD (n = 4 per group). *p < .05 vs. control; #p < .05 vs. APAP treated rat. The 100% value of GSH and vitamin C content corresponds to, liver: 0.574 ± 0.070; kidney: 0.40 ± 0.03 n moles/mg of protein and liver: 7.118 ± 0.144; kidney: 6.75 ± 0.65 µg/mg of protein, respectively. The 100% value of SOD, catalase and GPx activities corresponds to, liver: 2.215 ± 0.158; kidney: 1.75 ± 0.2 U/mg of protein, liver: 0.84 ± 0.08; kidney: 0.52 ± 0.03 kU/mg of protein and liver: 2.529 ± 0.04; kidney: 1.23 ± 0.02 U/mg of protein, respectively. [![]()
![Figure 4 Effect of Sh-SeNPs and SAG-Sh-SeNPs against APAP toxicity-induced decrease in non-enzymatic antioxidants (GSH and vitamin C) and enzymatic antioxidants (SOD, catalase and GPx) in rat liver and kidney. Results are expressed as % variation in comparison to control animals as mean ± SD (n = 4 per group). *p < .05 vs. control; #p < .05 vs. APAP treated rat. The 100% value of GSH and vitamin C content corresponds to, liver: 0.574 ± 0.070; kidney: 0.40 ± 0.03 n moles/mg of protein and liver: 7.118 ± 0.144; kidney: 6.75 ± 0.65 µg/mg of protein, respectively. The 100% value of SOD, catalase and GPx activities corresponds to, liver: 2.215 ± 0.158; kidney: 1.75 ± 0.2 U/mg of protein, liver: 0.84 ± 0.08; kidney: 0.52 ± 0.03 kU/mg of protein and liver: 2.529 ± 0.04; kidney: 1.23 ± 0.02 U/mg of protein, respectively. [Display full size Control; Display full sizeAPAP; Display full sizeSh-SeNPs; Display full sizeSAG-Sh-SeNPs; Display full sizeSh-SeNPs + APAP; Display full sizeSAG-Sh-SeNPs + APAP].](/cms/asset/71c50209-7789-47ac-bff0-a64fc3b4ba51/ianb_a_1543192_f0004_b.jpg)
APAP has been bioactivated by CYP3A4 and CYP2E1 enzymes [Citation5,Citation43]. Also, APAP has been known to increase the protein expression level of CYP2E1 in liver and kidney [Citation44]. CYP2E1 is involved independently in the production of both NAPQI and nitrosative stresses under APAP overdose [Citation5,Citation8]. Hence, inhibition of CYP2E1 function is considered important criteria to overcome the oxidative stress under APAP overdose. In such scenario, it is worth noting that our previous study has shown that SAG interacted with CYP2E1 and CYP3A4 protein efficiently in silico conditions [Citation25]. In addition to oxidative stress, depletion of GSH content due to its conjugation with reactive metabolite is considered an important deleterious effect of APAP overdose [Citation45]. The preservation of GSH content by SAG-Sh-SeNPs can be considered as an important mechanism to overcome APAP toxicity. SAG preserved the antioxidant status, in particular, prevented the depletion of GSH content in liver under CCl4-induced toxicity. In addition, SeNPs is known to affect positively the concentration of GPx enzyme [Citation46]. The combined beneficial effects of both SAG and SeNPs in SAG-Sh-SeNPs have rendered liver and kidney functional protection against APAP toxicity. Increased NO level would react with reactive ROS to generate peroxynitrite radical. Peroxynitrite mediates formation of 3-nitrotyrosine-protein adduct and results in ubiquitination of the nitrated protein. In particular, APAP induced nitrosative stress has been shown to decrease the level of SOD [Citation47]. Hence, prevention of increase in NO concentration by SAG-Sh-SeNPs can be considered yet another mechanism to overcome APAP toxicity. In addition to antioxidative property, mitochondrial protection by drug of interest against APAP toxicity is considered advantageous [Citation48,Citation11,Citation12,Citation15], hence the effect of SAG-Sh-SeNPs against APAP toxicity-induced mitochondrial dysfunction has been further studied.
SAG-Sh-SeNPs protected the mitochondrial OXPHOS function in liver and kidney against APAP toxicity
APAP administration has significantly decreased the activities of mitochondrial OXPHOS complex I and III activity in both liver and kidney (). Sh-SeNPs and SAG-Sh-SeNPs treatment alone did not affect the OXPHOS activities. However, pretreatment with Sh-SeNPs and SAG-Sh-SeNPs preserved the OXPHOS function against APAP. Similar to antioxidative effect, SAG-Sh-SeNPs showed higher protective effect on mitochondrial function in comparison to Sh-SeNPs. APAP administration results in nitration of various proteins such as aldehyde dehydrogenase, citrate synthase and ATP synthase in mitochondria. Also, mitochondrial catalase, SOD and GPx are nitrated which results in the depletion of mitochondrial oxidants [Citation47]. In addition, NAPQI binds to mitochondrial proteins and enhance the conversion of molecular oxygen into ROS [Citation49]. These effects ultimately deplete the mitochondrial bioenergetics and onset the mitochondrial permeability transition which ultimately triggers both necrotic and apoptotic cell death [Citation9]. SAG is well known for its protection of OXPHOS function against CCl4-induced toxicity in the liver. Consistent to this previous study, SAG functionalized SAG-Sh-SeNPs also protected the mitochondrial function against APAP toxicity.
Figure 5 Effect of Sh-SeNPs and SAG-Sh-SeNPs against APAP toxicity-induced decrease in mitochondrial complex I (A) and complex III (B) activity in rat liver and kidney. Results are expressed as % variation in comparison to control animals as mean ± SD (n = 4 per group). *p < .05 vs. control; #p < .05 vs. APAP treated rat. The 100% value of complex I and complex III activities corresponds to, liver: 0.725 ± 0.101; kidney: 0.55 ± 0.1 µmoles/min/mg of protein and liver: 1.017 ± 0.05; kidney: 0.87 ± 0.04 µmoles/min/mg of protein, respectively. [![]()
![Figure 5 Effect of Sh-SeNPs and SAG-Sh-SeNPs against APAP toxicity-induced decrease in mitochondrial complex I (A) and complex III (B) activity in rat liver and kidney. Results are expressed as % variation in comparison to control animals as mean ± SD (n = 4 per group). *p < .05 vs. control; #p < .05 vs. APAP treated rat. The 100% value of complex I and complex III activities corresponds to, liver: 0.725 ± 0.101; kidney: 0.55 ± 0.1 µmoles/min/mg of protein and liver: 1.017 ± 0.05; kidney: 0.87 ± 0.04 µmoles/min/mg of protein, respectively. [Display full sizeControl; Display full sizeAPAP; Display full sizeSh-SeNPs; Display full sizeSAG-Sh-SeNPs; Display full sizeSh-SeNPs + APAP; Display full sizeSAG-Sh-SeNPs + APAP].](/cms/asset/bfa37c99-c9ff-4963-be48-c8f012ca59c2/ianb_a_1543192_f0005_b.jpg)
Conclusion
SAG-Sh-SeNPs was synthesized using aqueous leaf extract of S. hispida as reducing agent. APAP overdose resulted in the liver and kidney dysfunction through increasing the oxidative stress, decreasing the antioxidant status and depleting the mitochondrial bioenergetics. All these effects resulted in necrosis of liver and kidney tissue. Hence, liver and kidney injury markers were increased in the serum of the APAP intoxicated rat. SAG-Sh-SeNPs pretreatment preserved the antioxidant status thereby withheld the increase in oxidative stress against APAP toxicity. In addition, SAG-Sh-SeNPs protected the mitochondrial function. Altogether, SAG-Sh-SeNPs through these mechanisms protected the liver and kidney function against APAP toxicity which is reflected through biochemical parameter and histological observation. In summary, SAG-Sh-SeNPs can be considered as a potential candidate to overcome APAP toxicity, however, further investigation is required to understand the molecular mechanism involved.
Figures_supplementary_biointerface.doc
Download ()Acknowledgements
All the Authors acknowledges Animal house facility, Department of Biotechnology, K. S. Rangasamy College of Technology, Tiruchengodu, India for providing facilities to carry out animal studies.
Disclosure statement
All the authors declare no conflict of interest.
Additional information
Funding
Related Research Data
References
- Boutis K, Shannon M. Nephrotoxicity after acute severe acetaminophen poisoning in adolescents. J Toxicol Clin Toxicol. 2001;39:441–445.
- Pérez-Villalva R, Barrera-Chimal J, Aguilar-Carrasco JC, et al. HSP72 is an early biomarker to detect cisplatin and acetaminophen nephrotoxicity. Biomarkers. 2017;22:548–556.
- Yan M, Huo Y, Yin S, et al. Mechanisms of acetaminophen-induced liver injury and its implications for therapeutic interventions. Redox Biol. 2018;
- Dahlin DC, Miwa GT, Lu AY, et al. N-acetyl-p-benzoquinone imine: a cytochrome P-450-mediated oxidation product of acetaminophen. Proc Natl Acad Sci USA. 1984;81:1327–1331.
- Laine J, Auriola S, Pasanen M, et al. Acetaminophen bioactivation by human cytochrome P450 enzymes and animal microsomes. Xenobiotica. 2009;39:11–21.
- Hinson JA, Bucci TJ, Irwin LK, et al. Effect of inhibitors of nitric oxide synthase on acetaminophen-induced hepatotoxicity in mice. Nitric Oxide. 2002;6:160–167.
- Hinson JA, Pike SL, Pumford NR, et al. Nitrotyrosine-protein adducts in hepatic centrilobular areas following toxic doses of acetaminophen in mice. Chem Res Toxicol. 1998;11:604–607.
- Abdelmegeed MA, Moon K-H, Chen C, et al. Role of cytochrome P450 2E1 in protein nitration and ubiquitin-mediated degradation during acetaminophen toxicity. Biochem Pharmacol. 2010;79:57–66.
- Kon K, Kim JS, Jaeschke H, et al. Mitochondrial permeability transition in acetaminophen-induced necrosis and apoptosis of cultured mouse hepatocytes. Hepatology. 2004;40:1170–1179.
- Hu J, Ramshesh VK, McGill MR, et al. Low dose acetaminophen induces reversible mitochondrial dysfunction associated with transient c-Jun N-terminal kinase activation in mouse liver. Toxicol Sci. 2016;150:204–215.
- Du K, Farhood A, Jaeschke H. Mitochondria-targeted antioxidant Mito-Tempo protects against acetaminophen hepatotoxicity. Arch Toxicol. 2017;91:761–773.
- Du K, Ramachandran A, McGill MR, et al. Induction of mitochondrial biogenesis protects against acetaminophen hepatotoxicity. Food Chem Toxicol. 2017;108:339–350.
- Jaeschke H, McGill MR, Ramachandran A. Oxidant stress, mitochondria, and cell death mechanisms in drug-induced liver injury: lessons learned from acetaminophen hepatotoxicity. Drug Metab Rev. 2012;44:88–106.
- McGill MR, Jaeschke H. Metabolism and disposition of acetaminophen: recent advances in relation to hepatotoxicity and diagnosis. Pharm Res. 2013;30:2174–2187.
- Shi X, Bai H, Zhao M, et al. Treatment of acetaminophen-induced liver injury with exogenous mitochondria in mice. Transl Res. 2018;196:31–41.
- Amin KA, Hashem KS, Alshehri FS, et al. Antioxidant and hepatoprotective efficiency of selenium nanoparticles against acetaminophen-induced hepatic damage. Biol Trace Elem Res. 2017;175:136–145.
- Chen F, Zhang XH, Hu XD, et al. The effects of combined selenium nanoparticles and radiation therapy on breast cancer cells in vitro. Artif Cells Nanomed Biotechnol. 2018;46:937–948.
- Deng G, Chen C, Zhang J, et al. Se@ SiO2 nanocomposites attenuate doxorubicin-induced cardiotoxicity through combatting oxidative damage. Artif Cells Nanomed Biotechnol. 2018;1–10.
- Chaudhary S, Umar A, Mehta S. Surface functionalized selenium nanoparticles for biomedical applications. J Biomed Nanotechnol. 2014;10:3004–3042.
- Zhang W, Zhang J, Ding D, et al. Synthesis and antioxidant properties of Lycium barbarum polysaccharides capped selenium nanoparticles using tea extract. Artif Cells Nanomed Biotechnol. 2017;1–8.
- Vennila K, Chitra L, Balagurunathan R, et al. Comparison of biological activities of selenium and silver nanoparticles attached with bioactive phytoconstituents: green synthesized using Spermacoce hispida extract. Adv Nat Sci: Nanosci Nanotechnol. 2018;9:015005.
- Patruno A, Fornasari E, Di Stefano A, et al. Synthesis of a novel cyclic prodrug of S-allyl-glutathione able to attenuate LPS-induced ROS production through the inhibition of MAPK pathways in U937 cells. Mol Pharmaceutics. 2015;12:66–74.
- Pratheebaa P, Perumal P, Angayarkanni J, et al. 4-[2-Allylsulfanyl-1-(carboxymethyl-carbamoyl)-ethylcarbamoyl]-2-amino-butyric acid: evaluation as topoisomerase inhibitor using in vitro assay and molecular docking study. Med Chem Res. 2015;24:1893–1900.
- Takemura S, Azuma H, Osada-Oka M, et al. S-allyl-glutathione improves experimental liver fibrosis by regulating Kupffer cell activation in rats. Am J Physiol Gastrointest Liver Physiol. 2017;2017:. ajpgi. 00023
- Palvannan T, Chitra L, Ancy I, et al. S-allyl-glutathione, a synthetic analogue of glutathione protected liver against carbon tetrachloride toxicity: focus towards anti-oxidative efficiency. Environ Toxicol Pharm. 2018;58:21–28.
- Liu W, Li X, Wong Y-S, et al. Selenium nanoparticles as a carrier of 5-fluorouracil to achieve anticancer synergism. Acs Nano. 2012;6:6578–6591.
- Frezza C, Cipolat S, Scorrano L. Organelle isolation: functional mitochondria from mouse liver, muscle and cultured fibroblasts. Nat Protoc. 2007;2:287–295.
- Mookerjee A, Basu JM, Majumder S, et al. A novel copper complex induces ROS generation in doxorubicin resistant Ehrlich ascitis carcinoma cells and increases activity of antioxidant enzymes in vital organs in vivo. BMC Cancer. 2006;6:267.
- Boyaci H, Maral H, Turan G, et al. Effects of erdosteine on bleomycin-induced lung fibrosis in rats. Mol Cell Biochem. 2006;281:129–137.
- Wills ED. Mechanisms of lipid peroxide formation in animal tissues. Biochem J. 1966;99:667–676.
- Ellman GL. Tissue sulfhydryl groups. Arch Biochem Biophys. 1959;82:70–77.
- Omaye ST, Turnbull JD, Sauberlich HE. Selected methods for the determination of ascorbic acid in animal cells, tissues, and fluids. Meth Enzymol. 1979;62:3–11.
- Rotruck JT, Pope AL, Ganther HE, et al. Selenium: biochemical role as a component of glutathione peroxidase. Science. 1973;179:588–590.
- Kakkar P, Das B, Viswanathan PN. A modified spectrophotometric assay of superoxide dismutase. Indian J Biochem Biophys 1984;21:130–132.
- Hadwan MH. New method for assessment of serum catalase activity. Indian J Sci Technol 2016;9:
- Janssen AJ, Trijbels FJ, Sengers RC, et al. Spectrophotometric assay for complex I of the respiratory chain in tissue samples and cultured fibroblasts. Clin Chem. 2007;53:729–734.
- Krahenbuhl S, Talos C, Wiesmann U, et al. Development and evaluation of a spectrophotometric assay for complex III in isolated mitochondria, tissues and fibroblasts from rats and humans. Clin Chim Acta. 1994;230:177–187.
- Sun D, Kang S, Liu C, et al. Effect of zeta potential and particle size on the stability of SiO2 Nanospheres as carrier for ultrasound imaging contrast agents. Int J Electrochem Sci. 2016;11:8520–8529.
- Jiang P, Sheng Y-c, Chen Y-h, et al. Protection of Flos Lonicerae against acetaminophen-induced liver injury and its mechanism. Environ Toxicol Pharmacol. 2014;38:991–999.
- Park G, Kim KM, Choi S, et al. Aconitum carmichaelii protects against acetaminophen-induced hepatotoxicity via B-cell lymphoma-2 protein-mediated inhibition of mitochondrial dysfunction. Environ Toxicol Pharmacol. 2016;42:218–225.
- Zhao Z, Wei Q, Hua W, et al. Hepatoprotective effects of berberine on acetaminophen-induced hepatotoxicity in mice. Biomed Pharmacother. 2018;103:1319–1326.
- Patra A, Mandal S, Samanta A, et al. Therapeutic potential of probiotic Lactobacillus plantarum AD3 on acetaminophen induced uremia in experimental rats. Clin Nutr Exp. 2018;19:12–22.
- Kim SN, Seo JY, Jung DW, et al. Induction of hepatic CYP2E1 by a subtoxic dose of APAP in rats: Increase in dichloromethane metabolism and carboxyhemoglobin elevation. Drug Metabo Dispo 2007;
- Ko J-W, Shin J-Y, Kim J-W, et al. Protective effects of diallyl disulfide against acetaminophen-induced nephrotoxicity: a possible role of CYP2E1 and NF-κB. Food Chem Toxicol. 2017;102:156–165.
- Manimaran A, Sarkar SN, Sankar P. Influence of repeated preexposure to arsenic on acetaminophen-induced oxidative stress in liver of male rats. Food Chem Toxicol. 2010;48:605–610.
- Zhang J, Wang H, Bao Y, et al. Nano red elemental selenium has no size effect in the induction of seleno-enzymes in both cultured cells and mice. Life Sci. 2004;75:237–244.
- Abdelmegeed MA, Jang S, Banerjee A, et al. Robust protein nitration contributes to acetaminophen-induced mitochondrial dysfunction and acute liver injury. Free Radic Biol Med. 2013;60:211–222.
- Lee C-H, Kuo C-Y, Wang C-J, et al. A polyphenol extract of Hibiscus sabdariffa L. ameliorates acetaminophen-induced hepatic steatosis by attenuating the mitochondrial dysfunction in vivo and in vitro. Biosci Biotechnol Biochem. 2012;76:646–651.
- Jaeschke H, Bajt ML. Intracellular signaling mechanisms of acetaminophen-induced liver cell death. Toxicol Sci. 2006;89:31–41.