
 ?Mathematical formulae have been encoded as MathML and are displayed in this HTML version using MathJax in order to improve their display. Uncheck the box to turn MathJax off. This feature requires Javascript. Click on a formula to zoom.
Abstract
Herein, quartz crystal microbalance (QCM) biosensor is prepared for the detection of l-histidine by attachment of l-histidine imprinted poly(EGDMA-MAH/Cu(II)) nanoparticles on QCM electrode. The imprinted nanoparticles with the size of 86.43 nm were synthesized via miniemulsion polymerization reaction. Prepared QCM sensors were characterized with ellipsometer, contact angle measurements and FTIR. The thickness measurements demonstrated that the particle thin films were almost monolayer. l-histidine solutions with a concentration range between 6.44 μM and 225.6 μM were introduced to QCM system to determine the adsorption kinetics. Selectivity of the l-histidine imprinted nanoparticles were examined using d-histidine and l-tryptophan as competitor molecules. l-histidine imprinted QCM biosensors was also used for RNAase, lysozyme, cytochrome-C and BSA to investigate the competitive adsorption of surface histidine exposed proteins.
Introduction
Histidine, an essential bioactive molecule, is highly important for human growth and repair of tissues and behaves as a neurotransmitter in human muscular and the central nervous system [Citation1–5]. Additionally, histidine regulates metal ions transmission in biological systems and constitutes the active site of many enzymes and natural proteins [Citation6,Citation7]. Hence, excessive or deficiency of histidine/histidine rich proteins would cause many diseases like Parkinson’s disease [Citation2], epilepsy [Citation8], histidinemia [Citation9], chronic kidney disease [Citation5], the failure of normal erythropoiesis development [Citation10], inflammation and oxidative stress [Citation5,Citation11]. Sensitive, specific and accurate detection of histidine in biological samples has great significance in clinical analysis. The low concentration and similar structural features of other amino acids bother the specific detection of histidine in many biological samples. Various analytical methods including capillary electrophoresis, HPLC, colorimetry, fluorometry, SERS, NMR and electrochemistry [Citation4,Citation12–17] have been proposed to overcome this challange. Some of these analytical methods suffer from the complicated operating procedures, complicated instrumentation, sophisticated detection systems and expensive cost [Citation3].
Among these methods, molecular imprinting (template-assisted synthesis) offering selective and spesific binding sites for template molecule in polymeric network, has been recognized as one of the most promising technique [Citation18–21]. The formation of tailor-made recognition materials based on the molecular imprinting technique can design a durable recognition layer on the transducer surface such as mass-sensitive devices, optrodes, or electrochemical electrodes [Citation22]. QCM is a mass-sensitive device due to the piezoelectric effect. The oscillation frequency of the electrode shifts if a mass adsorbed on the surface of QCM electrode, that enables to examine any interaction through the frequency shift of the electrode [Citation23–27]. Combination of molecular imprinting technique with QCM presents some benefits such as high sensitivity, quick response time, label-free sensing in real time and calculating the kinetic constans of biomolecules [Citation28]. QCM can be used in analytical applications regarding some drawbacks of laboratory-based approaches like high cost, complicated instrumentation and hardship of operating procedures.
Herein, advantages of QCM and molecular imprinting technique were combined to develop QCM biosensor. QCM biosensor was prepared by attachment of l-histidine imprinted nanoparticles (MIP) on the QCM electrodes. QCM electrodes were characterized with ellipsometer, FTIR and contact angle measurements. l-histidine solutions with a concentration range between 6.44 μM and 225.6 μM were introduced to QCM to calculate the absorption kinetics. Competitive adsorption of l-histidine, d-histidine and l-tryptophan was also investigated. Competitive adsorption of surface histidine exposed proteins like RNAase, lysozyme, cytochrome-C and BSA was also conducted to examine the selectivity of QCM biosensor.
Materials and methods
Materials
Hydroquinone, l-histidine methyl ester, dichloromethane, triethylamine, methacroyl chloride, sodium hydroxide and ethanol were supplied by Merck AG (Darmstadt, Germany). α,α’-azobisisobutyronitrile (AIBN), ethylene glycol dimethacrylate (EGDMA) were supplied by Fluka A.G. Sodium dodecyl sulfate (SDS), polyvinyl alcohol (PVA), sodium bicarbonate, sodium bisulfite, ammonium persulfate, and potassium bromide (KBr) were supplied from Sigma-Aldrich Chemical Co (St.Louis, USA).
Formation of l-histidine imprinted poly(EGDMA-MAH/Cu(II)) nanoparticles
Formation of functional monomer
The synthesis of N-methacryloyl-(L)-histidine methyl ester (MAH) monomer was conducted according the previous study [Citation29] and characterized with H-NMR and FTIR analyses.
Synthesis of MAH/copper(II) metal-chelating monomer
For the synthesis of MAH/copper(II), firstly 20% (w/v) MAH solution was prepared in EtOH, then 2.5 mg copper (II) nitrate was added into 20% (w/v) MAH solution and continuously stirred for 2 h. The resulting clear blue colored complex was crystallized from the ethanol/acetonitrile mixture through evaporating the solvent in the rotary evaporator.
Preparation of the QCM biosensor
The synthesis of MIP was performed by two-phase mini-emulsion polymerization method [Citation28]. Same synthesis approach was applied for the synthesis of non-imprinted nanoparticles (NIP) without using l-histidine. Prior to attaching of MIP onto the gold surface of QCM electrode, OCM electrode was immersed into the acidic piranha solution for 20 s then cleaned with deionized water and EtOH. Afterwards, 5 μL of MIP suspension was drop-casted on the QCM electrode and it was dried in a dust-free environment at 37 °C for 6 h. MIP attached QCM electrode was cleaned with DI and pure EtOH. FTIR-ATR characterization measurement of MIP biosensor was conducted by using the FTIR-ATR spectrophotometer. An auto-nulling imaging ellipsometer was used for thickness measument. All measurements were done at a wavelength of 532 nm with an incidence angle of 62°. Contact angle measurements were performed with Kruss DSA100 with sessile drop method.
Analysis of QCM biosensor response
Binding events were performed with l-histidine solutions at different concentrations. A concentration range between 6.44 μM and 225.6 μM were prepared in phosphate buffer (10 mM, pH 7.4). MIP and NIP attached QCM biosensors were used in kinetic analysis studies. MIP QCM biosensor was equilibrated with phosphate buffer at a flow rate of 1.0 mL/min. l-histidine solutions in a concentration range between 6.44 μM and 225.6 μM were individually introduced into the QCM system. l-histidine was desorbed from the surface of MIP QCM biosensor with equilibrium buffer containing 1.0 M NaCl. Interaction between metal-chelating monomer and l-histidine is due to secondary forces. However, coordination bonds between MAH-Cu metal-chelating monomer and l-histidine are the basic interactions. Competitive adsorption of l-histidine, d-histidine and l-tryptophan was investigated to show the selectivity of MIP and NIP QCM biosensors. MIP QCM biosensors were also used for RNAase, lysozyme, cytochrome-C and BSA to investigate the competitive adsorption of surface histidine exposed proteins. The obtained kinetic data were analyzed by using RQCM (Maxtek) software.
Results and dissussion
Characterization studies
Figure S1 presents the 1H-NMR spectrum of MAH monomer. Peaks belonging to the corresponding protons in the MAH structure were depicted on the spectrum. The peaks of the MAH monomer in the 1H-NMR spectrum are as follows: 1.9 ppm 3 H singlet (-C=C-CH3, vinyl methyl), 1.42 ppm 2 H (-C=CH2), 3.56 ppm 3 H (-O-CH3), 4.82–4.87 ppm 1 H (vinyl H), 6.86 ppm 1 H (amine protons), 6.86–7.52 ppm aromatic protons.
When the FTIR spectrum in Figure S2 is examined, the characteristic carbonyl bands of the MAH structure are observed at 1653 and 1629 cm−1, and the amide II stretching vibration band is observed at 1529 cm−1.
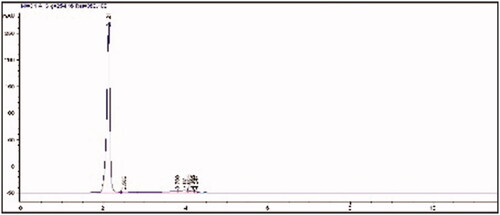
Enantiomeric purity of the synthesized MAH monomer was determined with HPLC using the Chirobiotic T column. The single peak observed at 2.12 min on the chromatogram indicates that MAH monomer has an enantiopurity of 99% ().
Figure 1 HPLC analysis of MAH monomer (flow rate: 0.5 mL/min, methanol-water elution (80–20 v/v), wavelength: 254 nm).
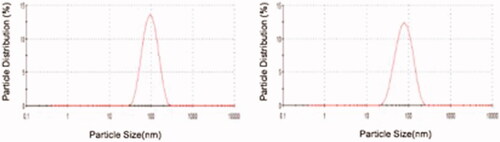
indicates the results of zeta size analysis of MIP and NIP. The average size of l-histidine imprinted nanoparticles was found as 86.43 nm with PDI of 0.138. For MIP, these values were found to be 70.27 nm and 0.150, respectively. As a result of the polymerization processes, the average sizes of MIP and NIP were similar.
Figure 2 Zeta sizer measuments of MIP (a) and NIP (b).
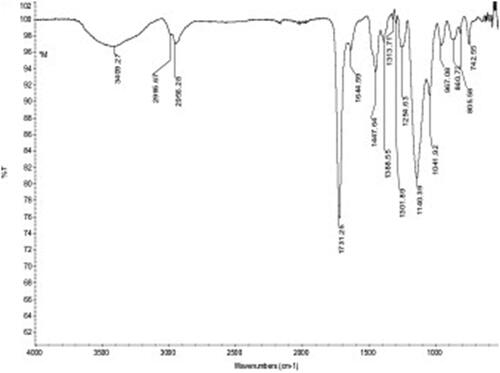
The FTIR-ATR spectrum of MIP attached QCM sensor surface was shown in . Absorption bands belonging to MIP attached QCM sensor surface were marked on the spectrum. The hydroxyl band at 3409 cm−1, aliphatic C-H band at 2995 cm−1 and carbonyl band at 1731 cm−1 of the methacrylate structure were observed. In addition, amide bands originating from MAH monomer were observed at 1644 cm−1 (C=O, amide I) and 1447 cm−1 (N-H bending, amide II). C=C-H asymmetric stretching band belongs to imidazole group were observed at 3025 cm−1, C-C=C symmetrical stretching and C-C=C asymmetric stretching bands were observed at 1584 cm−1 1469 cm−1, respectively.
Figure 3 FTIR-ATR spectrum of MIP attached QCM surface.
Surface characterization of the unmodified QCM sensor, MIP attached QCM surface and NIP attached QCM surface was performed. DSA2 software was utilized to calculate contact angle values. summarizes the surface contact angles of the unmodified QCM sensor, MIP and NIP QCM sensors.
Table 1. Contact angle measurements.
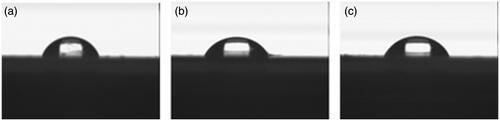
The contact angle of the unmodified, MIP and NIP sensor surfaces was 68.7°, 59.8°, 62.2°, respectively. The decrease in the contact angle value remarks that the hydrophilic property increases owing to the hydrophilic character of MAH-Cu(II) metal chelating monomer to fabricate of both MIP and NIP. The MAH-Cu metal chelating monomer is an amino acid (histidine) based material with hydrophilic character. Thus, the attachment of a hydrophilic polymer on to the surface of QCM electrodes increased the surface hydrophilicity and reduced the contact angle value. indicates contact angle images of unmodified (a), MIP (b) and NIP (c) sensors.
Figure 4 Contact angle measurements of non-modified QCM gold surface (a), MIP attached QCM gold surface (b), NIP attached QCM gold surface (c).
Surface depth obtained from ellipsometer of MIP attached QCM surface and NIP attached QCM surface was found as 54.9 and 52.0 nm. The thickness measurements showed that the nanoparticle distribution on the surface was almost homogeneous.
Evaluation of QCM biosensor response
l-histidine solutions in a concentration range between 6.44 μM and 225.6 μM were introduced to QCM system to examine the effect of concentration on QCM respond. Concentration interval was determined in respect with the probability of l-histidine levels in human plasma. The solutions were interacted with the QCM sensors via a peristaltic pump.
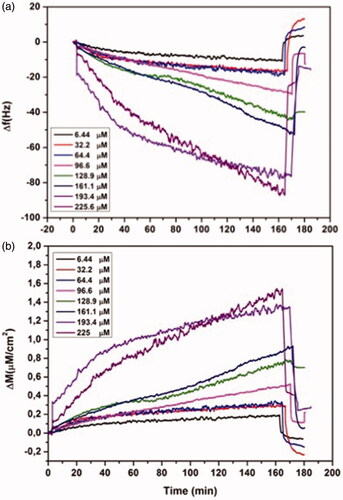
Data obtained with RQCM (Maxtek) software were monitored simultaneously and kinetic data were collected. As seen from , the frequency change (Δf) and the mass change (Δm) increased with the increase of l-histidine concentration. An increase in the concentration enhanced also the driving force.
Figure 5 Real-time responses of MIP QCM biosensor against aqueous solutions of l-histidine at different concentrations in 10 mM phosphate buffer, pH 7.4 at a flow rate of 1.0 mL/min, (a) frequency change, (b) mass change.
LOD and LOQ were calculated according to previous study [Citation30]. The LOD and LOQ were found as 1.06 µM and 3.53 µM, respectively.
Selectivity and reproducibility studies
Distribution and selectivity coefficients for l-histidine, d-histidine and l-tryptophan molecules were determined according to EquationEq. 1(1)
(1) .
(1)
(1)
Kd defines distribution coefficient (1/µM); Ci and Cf, initial and final concentrations of analytes (µM); V, volume of solution (mL) and m is the weight of the polymer (g). Primary reason for this approach is the absence of meaningful difference between initial and final concentrations. The polymer mass can not be precisely determined and the concentration is linearly related to Δm [Citation31]. So, selectivity coefficient becomes,
(2)
(2)
and relative imprinting selectivity obtained,
(3)
(3)
The competitive adsorption of l-histidine, d-histidine, l-tryptophan and binary mixtures of these analytes on MIP QCM biosensor was depicted in . The mass changes of MIP QCM biosensor against l-histidine, d-histidine and l-tryptophan solutions at the concentration of 96.6 µM were measured as 0.35, 0.06 and 0.16, respectively. MIP QCM biosensor was 5.83 and 2.19 times more selective for l-histidine against to d-histidine and l-tryptophan, respectively. Therefore, the molecular imprinted polymers also allow the chiral recognition. The mass changes of NIP QCM biosensor against l-histidine, d-histidine and l-tryptophan solutions at the concentration of 96.6 µM was also determined to examine the imprinting effect as 0.224, 0.235 and 0.22, respectively (). k and k’ of MIP QCM biosensor were summarized in . k’ of MIP QCM biosensor for l-histine are 6.12 and 2.15 according to d-histidine and l-tryptophan. The imprinted binding sides generated in MIP preferentially sense l-histidine better than D-histidine and l-tryptophan.
Figure 6 Real-time responses of MIP QCM biosensor against aqueous solutions for l-histidine, D-histidine, l-tryptophan (a) and binary mixtures (b). Experimental conditions; pH 7.4, flow rate: 1.0 mL/min, concentration of l-histidine, d-histidine, l-tryptophan: 96.6 µM.
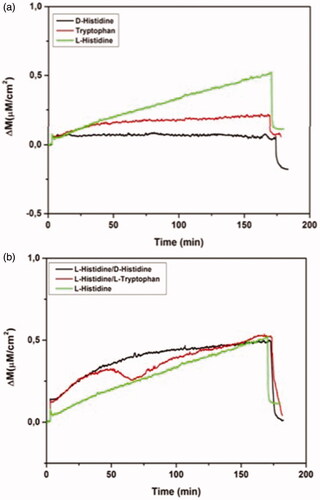
Figure 7 Real-time responses of NIP QCM biosensor against aqueous solutions for l-histidine, D-histidine, l-tryptophan. Experimental conditions; pH 7.4, flow rate: 1.0 mL/min, concentration of l-histidine, d-histidine, l-tryptophan: 96.6 µM.
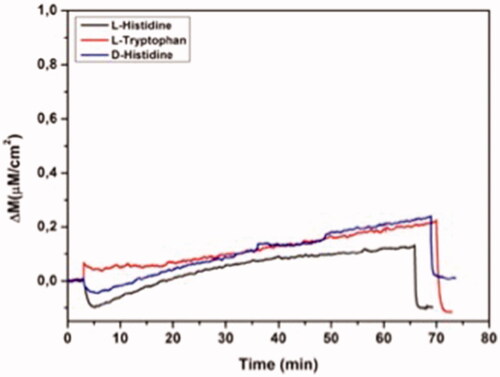
Table 2. Selectivity and relative selectivity coefficients for l-histidine against d-histidine and l-tryptophan.
Table 3. Kinetic rate constants.
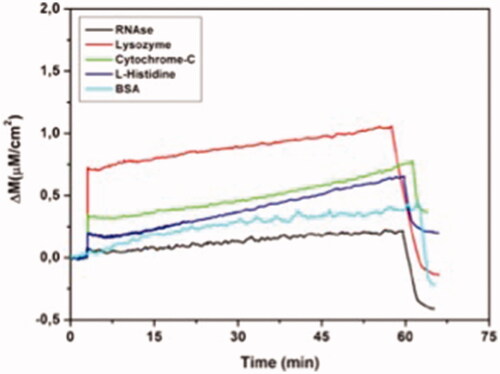
MIP QCM biosensor was also utilized for RNAase, lysozyme, citochrom-c and BSA to investigate the competitive adsorption of surface histidine exposed proteins as shown in .
Figure 8 Real-time responses of MIP QCM biosensor against aqueous solutions for RNAase, lysozyme, cytochrome-C, l-histidine and BSA. Experimental conditions; pH 7.4, flow rate: 1.0 mL/min, concentration of RNAase, lysozyme, cytochrome-C, l-histidine and BSA: 96.6 µM.
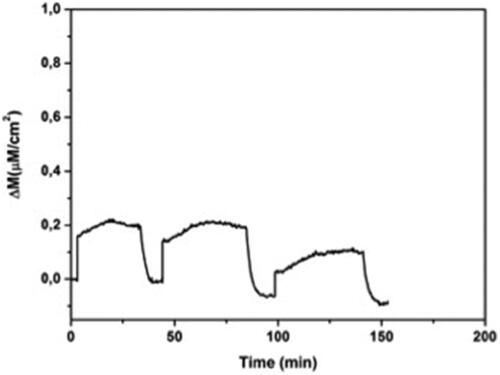
The reproducibility of a process is always considered not only from the economic point aspect, it is also important if the product controlled by a regulatory authority. To examine MIP QCM biosensors reusability, adsorption-equilibrium-regeneration cycles was repeated three times using the l-histidine solution of 96.6 µM. Δm values were depicted in . Δm values of MIP QCM biosensor against l-histidine were found as 0.210, 0.209 and 0.181. Fabricated biosensor responses are stable and could be used many times without significiant loss in l-histidine adsorption (). In this regard, prepared biosensor is capable of l-histidine detection.
Figure 9 Reproducibility of MIP QCM biosensor. Experimental conditions; pH 7.4, flow rate: 1.0 mL/min, concentration of l-histidine: 96.6 µM.
Equilibrium analysis
Maximum analyte adsorption on the sensor surface is defined as the sum of l-histidine binding sites, and concentration values can be defined as the QCM signals.
(4)
(4)
(dΔm/dt, the rate of change of Δm (µM/cm2); Δm and Δmmax, binding signal and maximum signal; ka (µM/s), the binding rate constant; kd (1/s), the dissociation rate constant)
At equilibrium dm/dt =0;
(5)
(5)
The binding constant KA(ka/kd) was obtained from the graph of Δmequilibrium/C vs Δmequilibrium and the dissociation constant KD was obtained from 1/KA and given in [Citation31].
Mathematical approaches for MIP biosensor response
Interaction model between l-histidine and MIP QCM biosensor was evaluated by using Langmuir, Freundlich and Langmuir-Freundlich (LF) adsorption isotherm models (Figure S3–S7) (). LF has higher correlation coefficient, R2 of 0.98 compared to both Langmuir and Freundlich. LF facilitates to describe molecularly imprinted polymers of both homogeneous and heterogeneous distributions at both high and low concentrations. LF is applicable to define the corresponding binding parameters. LF fitting coefficients enable to measure the sum of binding sites, mean association constant and heterogeneity, so the binding behavior of molecularly imprinted polymers can be described by the heterogeneous LF isotherm [Citation32].
Table 4. Equilibrium isotherm models.
Conclusions
l-histidine is an essential amino acid for biological functions. Excessive amounts or deficiency of histidine/histidine rich proteins can cause the life-threating diseases such as Parkinson and kidney disease. So, detection of l-histidine with high selectivity and sensitivity can facilitate the monitoring of mentioned diseases. For this purpose, molecularly imprinted QCM biosensor was designed for the detection of l-histidine. Molecularly imprinted nanoparticles with the size of 86.43 nm were synthesized via mini-emulsion polymerization. The LOD and LOQ were found as 1.06 µM and 3.53 µM, respectively.
Supplementary.docx
Download ()Disclosure statement
No potential conflict of interest was reported by the authors.
Related Research Data
References
- Hu Y, Wang Q, Zheng C, et al. Recyclable decoration of amine-functionalized magnetic nanoparticles with Ni2+ for determination of histidine by photochemical vapor generation atomic spectrometry. Anal Chem. 2014;86:842–848.
- Wu C, Fan D, Zhou C, et al. Colorimetric strategy for highly sensitive and selective simultaneous detection of histidine and cysteine based on G‑Quadruplex-Cu(II) metalloenzyme. Anal Chem. 2016;88:2899–2903.
- Qiao Y, Chen B, Yang Y, et al. Rational design of a highly selective fluorescent sensor for L-histidine detection in aqueous solution. Dalton Trans. 2016;45:1310–1314.
- Qiu S, Miao M, Wang T, et al. A fluorescent probe for detection of histidine in cellular homogenate and ovalbumin based on the strategy of click chemistry. Biosens Bioelectron. 2013;42:332–336.
- Watanabe M, Suliman ME, Qureshi AR, et al. Consequences of low plasma histidine in chronic kidney disease patients: associations with inflammation, oxidative stress, and mortality. Am J Clin Nutr. 2008;87:1860–1866.
- Li LD, Chen ZB, Zhao HT, et al. Electrochemical real-time detection of l-histidine via self-cleavage of DNAzymes. Biosens Bioelectron. 2011;26:2781–2785.
- Chen GN, Wu XP, Duan JP, et al. A study on electrochemistry of histidine and its metabolites based on the diazo coupling reaction. Talanta. 1999;49:319–330.
- Li Q, Jin CL, Xu LS, et al. Histidine enhances carbamazepine action against seizures and improves spatial memory deficits induced by chronic transauricular kindling in rats. Acta Pharmacol Sin. 2005;26:1297–1302.
- Attia MS. Nano optical probe samarium tetracycline complex for early diagnosis of histidinemia in new born children. Biosens Bioelectron. 2017;94:81–86.
- Rao ML, Stefan H, Scheid C, et al. Serum amino acids, liver status, and antiepileptic drug therapy in epilepsy. Epilepsia. 1993;34:347–354.
- Niu YC, Feng RN, Hou Y, et al. Histidine and arginine are associated with inflammation and oxidative stress in obese women. Br J Nutr. 2012;108:7–61.
- Yu H, Xu L, You T. Indirect electrochemiluminescence detection of lysine and histidine separated by capillary electrophoresis based on charge displacement. Luminescence. 2013;28:217–221.
- Ruta J, Grosset C, Ravelet C, et al. Chiral resolution of histidine using an anti-D-histidine L-RNA aptamer microbore column. J Chromatogr B Analyt Technol Biomed Life Sci. 2007;845:186–190.
- Bae DR, Han WS, Lim JM, et al. Lysine-functionalized silver nanoparticles for visual detection and separation of histidine and histidine-tagged proteins. Langmuir. 2010;26:2181–2185.
- Ye S, Guo Y, Xiao J, et al. A sensitive SERS assay of L-histidine via a DNAzyme-activated target recycling cascade amplification strategy. Chem Commun. 2013;49:3643–3645.
- Hu F, Rohr KS, Hong M. NMR Detection of pH-dependent histidine-water proton exchange reveals the conduction mechanism of a transmembrane proton channel. J Am Chem Soc. 2012;134:3703–3713.
- Prasad BB, Kumar D, Madhuri R, et al. Metal ion mediated imprinting for electrochemical enantioselective sensing of l-histidine at trace level. Biosens Bioelectron. 2011;28:117–126.
- Whitcombe MJ, Chianella I, Larcombe L, et al. The rational development of molecularly imprinted polymer-based sensors for protein detection. Chem Soc Rev. 2011;40:1547–1571.
- Mosbach K, Ramström O. The emerging technique of molecular imprinting and its future impact on biotechnology. Nat Biotechnol. 1996;14:163–170.
- Wulff G, Sarhan A. Use of polymers with enzyme-analogous structures for the resolution of racemates. Angew Chem Int Ed. 1972;11:341–342.
- Whitcombe MJ, Kirsch N, Nicholls IA. Molecular imprinting science and technology: a survey of the literature for the years 2004-2011. J Mol Recognit. 2014;27:297–401.
- Dickert FL. Molecular imprinting and functional polymers for all transducers and applications. Sensors 2018;18:327–332.
- Yilmaz E, Majidi D, Ozgur E, et al. Whole cell imprinting based Escherichia Coli sensors: a study for SPR and QCM. Sens. Actuator B-Chem. 2015;209:714–721.
- Diltemiz SE, Keçili R, Ersöz A, et al. Molecular imprinting technology in quartz crystal microbalance (QCM) Sensors. Sensor. 2017;17:454–473.
- Liu S, Zhou D, Guo T. Construction of a novel macroporous imprinted biosensor based on quartz crystal microbalance for ribonuclease A detection. Biosens Bioelectron. 2013;42:80–86.
- Feng F, Zheng J, Qin P, et al. A novel quartz crystal microbalance sensor array based on molecular imprinted polymers for simultaneous detection of clenbuterol and its metabolites. Talanta. 2017;167:2017.
- Speight RE, Cooper MA. A survey of the 2010 quartz crystal microbalance literature. J Mol Recognit. 2012;25:451–473.
- Sener G, Ozgur E, Yilmaz E, et al. Quartz crystal microbalance based nanosensor for lysozyme detection with lysozyme imprinted nanoparticles. Biosens Bioelectron. 2010;26:815–821.
- Garipcan B, Denizli A. A novel affinity support material for the separation of immunoglobulin G from human plasma. Macromol Biosci. 2002;2:135–144.
- Miller JC, Miller JN. Statistics and chemometrics for analytical chemistry. 5th ed. Ellis-Horwood: New York; 2005. Chapter 5, p. 110–154.
- Lin LP, Huang LS, Lin CW, et al. Determination of binding constant of DNA-binding drug to target dna by surface plasmon resonance biosensor technology. Curr Drug Targets Immune Endocr Metabol Disord. 2005;5:61–72.
- Umpleby RJ, Baxter SC, Chen Y, et al. Characterization of molecularly imprinted polymers with the langmuir-freundlich isotherm. Anal Chem. 2001;73:4584–4591.