
Abstract
Oxaliplatin resistance limits the efficiency of treatment for colorectal cancer (CRC). Studies have shown that abnormal expression of microRNAs (miRNAs) were associated with tumorigenesis, cancer development and chemoresistance. The purpose of this study was to identify potential miRNAs related to oxaliplatin resistance in CRC cells. In this work, using small RNA sequencing (small RNA-Seq) and transcriptome sequencing (RNA-Seq), we found that down-regulated miR-483-3p was concurrent with up-regulated FAM171B in oxaliplatin-resistant colorectal cancer cell line HCT116/L as compared with its parental cell line HCT116. Transient transfection of miR-483-3p mimics markedly decreased the levels of FAM171B and restored oxaliplatin responsiveness of HCT116/L cells, and this alteration enhanced cell apoptosis and weakened cell migration. Whereas miR-483-3p inhibitor dramatically promoted the expression of FAM171B and enhanced oxaliplatin resistance of HCT116 cells by repressing cell apoptosis. Furthermore, knockdown of FAM171B in HCT116/L cells could also sensitize its reaction of the treatment with oxaliplatin, which was verified by the reduced cell migration. These findings demonstrate that FAM171B is a functional target of miR-483-3p in the regulation of oxaliplatin resistance in human CRC cells.
Introduction
Globally, colorectal cancer (CRC) is the third most common cancer in women and the fourth most common cancer in men [Citation1]. CRC incidence rates are increasing in both sexes in the Middle East, South East and East Asian countries [Citation2]. Despite improvements in the efficacy of the multidisciplinary and comprehensive therapeutics based on surgical operation of CRC, but unfortunately, the survival rate of patients with CRC is still very low, approximately 10–15% of patients with initially localized disease, metastases will develop within 5 years and half of CRC patients survive less than five years [Citation3]. The high mortality rate in patients with CRC is mainly due to liver and lung metastasis. Currently, the mainstay first-line cytotoxic treatment of patients with metastatic CRC (mCRC) consists of a fluoropyrimidine together with either oxaliplatin (XELOX/FOLFOX) or irinotecan (XELIRI/FOLFIRI) [Citation4]. However, approximately 50% of the patients do not obtain an objective response to treatment combination, which mainly are results of chemoresistance and the lack of predictive biomarkers for standard chemotherapeutic treatment.
Oxaliplatin is part of the “dach” family of platinum compounds and is considered to be one of the most effective chemotherapeutic drugs for CRC. In CRC cells, oxaliplatin binds to DNA nucleobases and interacts with DNA, triggering apoptotic pathways and causing DNA damage [Citation5]. However, the occurrence of resistance remains. Resistance to oxaliplatin is multifactorial. Hypothetical drug resistance mechanisms include inefficient cellular drug uptake and accumulation [Citation6], activation of the antioxidant glutathione system for detoxication [Citation7], enhancement of DNA repair [Citation8] and up-regulation of anti-apoptosis pathways [Citation9]. In addition, the induction of epithelial-mesenchymal transition increases insulin-like growth factor signalling and that changes in cellular metabolism [Citation10]. Therefore, it is utmost important to identify molecular biomarkers associated with oxaliplatin resistance.
MicroRNAs (miRNAs) are short, endogenous, and non-coding RNAs which bind to the 3’-untranslated regions (UTR) of target messenger RNAs (mRNAs) by complementary base pairing, thereby negatively regulating gene expression [Citation11]. Plenty of evidence demonstrated that aberrantly expressed miRNAs could regulate the expression of genes involved in fundamental cancer progression, such as cell proliferation, apoptosis, differentiation and migration [Citation12]. For instance, overexpression of miR-135b was found to be involved for cancer progression, metastasis and invasion [Citation13], miR-214 was suggested to repress cell apoptosis in human ovarian cancer via targeting PTEN [Citation14]. Growing studies also showed that miRNAs had been linked to anti-cancer drug resistance. Several miRNAs had been linked to 5-FU resistance [Citation15], as well as to oxaliplatin resistance [Citation16]. These results suggest that miRNAs are potential oncogenic or tumour suppressing roles in cancer development. Therefore, there is an urgent need to better define how dysregulated miRNAs can modulate drug response of colorectal cancer and possibly interfere with multiple pathways and factors implicated in the phenomenon.
In this study, we comparatively assessed differentially expressed miRNAs and genes of HCT116 and HCT116/L cells with the final aim of clarifying the miRNAs and their target genes associated with oxaliplatin resistance. Previous studies have suggested that miR-483-3p was dysregulated in some types of tumours [Citation17–19]. However, the mechanisms by which miR-483-3p is associated with oxaliplatin resistance in CRC are largely unknown. According to small RNA-Seq results, we found that miR-483-3p was downregulated in the HCT116/L cells compared to HCT116 cells. And potential target genes of miR-483-3p were screened by combined analysis of small RNA-Seq and RNA-Seq. We found that inhibition of miR-483-3p in HCT116 cells could increase resistance to oxaliplatin. Overexpression of miR-483-3p in HCT116/L cells restored sensitivity to oxaliplatin. We also found that FAM171B was a direct target of miR-483-3p in CRC. Finally, our data demonstrated that the regulation of FAM171B by miR-483-3p had an essential role in oxaliplatin resistance in CRC cells.
Materials and methods
Cell lines and culture
The human colorectal cancer cell lines HCT116, LOVO and SW480 were purchased from the cell bank of the Chinese Academy of Sciences (Shanghai, China). Oxaliplatin-resistant cells (HCT116/L) were established by stepwise escalation method: parental cells (HCT116) were cultured with stepwise increasing concentrations of oxaliplatin (Sigma-Aldrich, St. Louis, MO) over 8 months. All cell lines were cultured in RPMI-1640 (Gibco, Carlsbad, CA) supplemented with 10% foetal bovine serum (FBS) (Gibco, Carlsbad, CA), 2 mmol/l l-glutamine, 100 U/mL of penicillin and 100 μg/mL of streptomycin (Gibco, Carlsbad, CA) at 37 °C in 5% CO2 incubation.
In vitro drug sensitivity assay
We used the Cell Counting Kit-8 (CCK-8; Dojindo, Kumamoto, Japan) to analyze the inhibition ratio of cell. Cells were seeded in a 96-well plate (Thermo Fisher Scientific, Wilmington, DE) with three duplicate wells at a density of 1 × 10⁴ cells per well. After 24 h of incubation, they were either cultured under different concentrations of oxaliplatin for 48 h. After treatment, 10 µL of the CCK-8 solution was added to each well and the 96-well plate was subsequently incubated at 37 °C for 2 or 3 h. The OD value was detected at a wavelength of 450 nm using a microplate reader (Thermo Fisher Scientific, Wilmington, DE) to determine the cell viability. Three independent experiments were performed. The inhibition ratio of cell was calculated as follows: inhibition ratio = 1 − (ODexperiment − ODblank)/(ODcontrol − ODblank).
Transfection of cell lines
Cells were seeded into 6-well plates or 96-well plates. Twenty-four hours later, transfections were performed using cells obtained at 80% confluence with Lipofectamine 2000 transfection reagent (Invitrogen, Carlsbad, CA) and Opti-MEM (Gibco) according to the manufacturer’s instructions. The cells were washed with 1× PBS, and after 4–6 h of transfection, the medium was replaced by complete medium. SiRNA and control siRNA (GenePharma, Shanghai, China) were used to knockdown FAM171B. MiR-483-3p inhibitor and its nonsense negative control (NC) (GenePharma, Shanghai, China) were used for miRNA downregulation. MiR-483-3p mimics and its nonsense negative control (NC) (GenePharma, Shanghai, China) were used for miRNA upregulation. Their sequences were as follows: MiR-483-3p inhibitor: 5′-AAGACGGGAGGAGAGGAGUGA-3′; Inhibitor negative control: 5′-CAGUACUUUUGUGUAGUACAA-3′; MiR-483-3p mimics: Sense 5′-UCACUCCUCUCCUCCCGUCUU-3′, Antisense 5′-GACGGGAGGAGAGGAGUGAUU-3′; Mimics negative control: Sense 5′-UUCUCCGAACGUGUCACGUTT-3′, Antisense 5′-ACGUGACACGUUCGGAGAATT-3′. The siRNA sequences were as follows: FAM171B-siR975: Sense 5′-GCAUACCUGCUUGGACAUUTT-3′, Antisense 5′-AAUGUCCAAGCAGGUAUGCTT-3′; FAM171B-siR1673: Sense 5´-GCGUAUGGGCGUUCCCAUATT-3´, Antisense 5´-UAUGGGAACGCCCAUACGCTT-3′; FAM171B-siR2116: Sense 5´-GCAUCCCAGAGCCUGGUUUTT-3′, Antisense 5′-AAACCAGGCUCUGGGAUGCTT-3′; FAM171B negative control: Sense 5′-UUCUCCGAACGUGUCACGUTT-3′, Antisense 5´-ACGUGACACGUUCGGAGAATT-3′. Cells were harvested after transfection for 48–72 h and used for RNA extraction and qRT-PCR to assess the transfection efficiency.
RNA extraction, reverse transcription and qRT-PCR
Total RNA from cell lines was extracted using TRIzol reagent according to a previously described method [Citation20]. For genes detection, the samples were amplified by PCR using One Step SYBR PrimeScriptTM RT-PCR Kit II as previously described [Citation21]. Mir-X miRNA qRT-PCR SYBR Kit (Clontech Laboratories Inc, Takara Bio, Japan) was used to detect miRNAs’ expression levels by the ABI ViiATM 7 according to the protocols. The cDNA was obtained via AMV reverse transcriptase (TaKaRa), which was conducted as follows: 36 °C for 30 min, 85 °C for 5 min and 4 °C for 20 min. Subsequently, real-time qPCR was denatured at 95 °C for 10 s followed by extension at 95 °C for 5 s and 60 °C for 20 s, which was performed for 40 cycles. MiRNAs and genes expression were normalized with U6 and GAPDH, respectively. Each sample was analyzed in triplicate. The expression levels of miRNAs and genes were measured using the 2−ΔΔCt method. Primers for qRT-PCR were listed in and .
Table 1. Primers of miRNAs used for quantitative real-time polymerase chain reaction (qRT-PCR).
Table 2. Primers of genes used for quantitative real-time polymerase chain reaction (qRT-PCR).
Apoptosis assay
Cells were plated in 6-well plates (6 × 10⁵ cells/well) and transfected with miR-483-3p mimics and miR-483-3p inhibitor. After 24 h of transfection, the cells were treated with the different concentrations of oxaliplatin for 48 h. Subsequently, cells were washed with PBS, resuspended in binding buffer and stained with annexin V-FITC and PI (KeyGen Biotech, Jiangsu, China) for 10 min in the dark. The frequency of apoptosis was measured using a flow cytometer (BD FACSCalibur, San Jose, CA) and the CellQuestTM software. At least 10,000 cells were analysed for each sample. Results were presented as the percentage of total cells that were living cells, early apoptotic cells, late apoptotic cells and necrotic cells.
Cell migration assay
The cell migration assays were assessed by using 24-well transwell boyden chambers covered by polycarbonate membranes with 8.0-µm pores (CorningV R CostarV R, Corning, NY). The cells were suspended after being transfected for 48 h, and approximately 15 × 105 cells were added into the upper chamber with 200 µL serum-free media. The lower chamber was filled with 600 μL of medium containing 10% FBS and oxaliplatin (5 μg/mL). Cells were incubated for 48 h at 37 °C. Next, cotton swabs were used to wipe off the remaining cells in the upper chambers. Whereas the cells that migrated through the membrane were fixed with paraformaldehyde for 30 min and then stained with 1% crystal violet for 10 min. The number of migrated cells in five random microscopic fields were counted and photographed using a light microscope. The experiments were conducted at least in triplicate.
Small RNA sequencing analysis
Three replicate samples of HCT-116 and HCT-116/L were used for small RNA sequencing. A total amount of 2.5 ng RNA per sample was used as input material for the RNA sample preparations. Sequencing libraries were generated using NEB NextUltraTM small RNA Sample Library Prep Kit for Illumina (NEB) following manufacturer’s recommendations. The library preparations were sequenced on an Illumina Hiseq 2500 platform. The clean reads were performed sequence alignment with Silva database, GtRNAdb database, Rfam database and Repbase database, respectively. The ribosomal RNA (rRNA), transfer RNA (tRNA), small nuclear RNA (snRNA), small nucleolar RNA (snoRNA) and other ncRNA and repeats were filtered out. The remaining reads were used to detect known miRNAs and novel miRNAs predicted by comparing with known miRNAs from miRBase. The expression levels of miRNAs in each sample were statistically analyzed and normalized using the TPM algorithm [Citation22]. Differential expression analysis of two groups was performed using the DESeq R package (1.10.1) [Citation23]. The resulting p values were adjusted using the Benjamini and Hochberg’s approach for controlling the false discovery rate (FDR). In the process of differentially expressed miRNAs detection, |log2 FC|≥1 and FDR ≤ 0.05 were used as screening standard. The Fold Change (FC) indicated the ratio of the expression levels between the two groups. Target genes of miRNAs were predicted using miRanda [Citation24] and RNAhybrid [Citation25] based on known miRNAs and novel miRNAs and gene sequence information of corresponding species.
Transcriptome sequencing analysis
Three replicate samples of HCT-116 and HCT-116/L were simultaneously used for transcriptome sequencing. A total amount of 1 μg RNA per sample was used as input material for the RNA sample preparations. Sequencing libraries were generated using NEB NextUltraTM RNA Library Prep Kit for Illumina (NEB). The library preparations were sequenced on an Illumina platform and paired-end reads were generated. The adaptor sequences and low-quality sequence reads were removed from the data sets. Raw sequences were transformed into clean reads after data processing. These clean reads were then mapped to the reference genome sequence. Only reads with a perfect match or one mismatch were further analyzed and annotated based on the reference genome. Hisat2 tools soft were used to map with the reference genome. Quantification of gene expression levels was estimated and normalized using the FPKM algorithm [Citation26].
Statistical analysis
Each experiment was repeated at least three times. Numerical data were presented as mean ± SD. All analyses were performed using GraphPad Prism Software Version 6.0 (GraphPad Software-Inc, La Jolla, CA) and SPSS 16.0 (SPSS Inc, Chicago, IL). Significance analysis of normal distributed data was performed using two-tail Student’s t-test. “*” represents p < .05, “**” represents p < .01, “***” represents p < .001 and “****” represents p < .0001 in this study.
Results
Cell toxicity profile of oxaliplatin-resistant cell line HCT116/L and its parental cell line HCT116
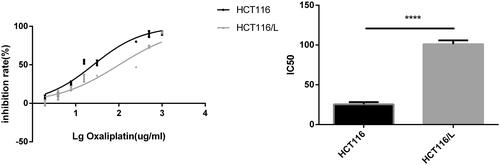
To determine the mechanism underlying oxaliplatin resistance, HCT116/L cells were established by stepwise escalation method and resistance to oxaliplatin was tested regularly by drug sensitivity assay. The single cell-derived clones for the HCT116 and HCT116/L cell lines were obtained by a limiting dilution strategy and were used for further study. The 50% inhibitory concentration values (IC50) of oxaliplatin (mean ± SD) in the HCT116 and HCT116/L cell lines were determined to be 25.73 μg/mL and 101.4 μg/mL, respectively. The resistant index was calculated to be 3.94 (p<.0001), and the dose-response growth curve was plotted and shown in .
Figure 1. The inhibition ratio of oxaliplatin-resistant colorectal cancer cells HCT116/L and the parental cell line HCT116 after treated with different concentrations of oxaliplatin for 24h using the drug sensitivity assay. ****p < .0001 (Student’s t-test).
Identification of differentially expressed miRNAs and genes
To identify miRNAs and target genes associated with oxaliplatin resistance in colorectal cancer, we performed simultaneous small RNA-Seq and RNA-Seq of HCT116 and HCT116/L cells. Sequencing results showed that the number of differentially expressed miRNAs and genes were 189 and 1671, respectively (). Six miRNAs and five genes were randomly selected to validate their differential expression using qRT-PCR. The results showed that all the selected miRNAs and genes showed identical expression trends between the small RNA-Seq/RNA-Seq and qRT-PCR analyses (), indicating that the sequencing dates were accurate and reliable. And then, through joint analysis of two sequencing data, we screened miRNAs and target genes that may be associated with oxaliplatin resistance. To further narrow down miRNA and target gene candidates, the selection criteria were |log2 FC|> =1, FDR< =0.001 and TPM/FPKM > 0. Some novel genes and miRNAs were also not considered. Importantly, miRNAs and genes with opposite expression trends were selected in HCT116 and HCT116/L cells. Finally, a total of 13 differentially expressed candidate miRNAs () and corresponding 252 target genes were obtained after screening by various standards. The 5 upregulated miRNAs were: miR-409-3p, miR-196b-5p, miR-92a-1-5p, miR-1254 and miR-212-5p. The 8 downregulated miRNAs were miR-135b-3p, miR-483-3p, miR-642a-5p, miR-1247-5p, miR-3158-3p, miR-151a-5p, miR-139-3p and miR-139-5p.
Figure 2. Identification of differentially expressed miRNAs and genes in HCT116 and HCT116/L. (a). Clustering maps of differentially expressed miRNAs (left)/genes (right) seated across three HCT116 and three HCT116/L samples. Columns represent different samples, and rows represent different miRNAs/genes. Red indicates high expression of miRNAs/genes, and green indicates low expression of miRNAs/genes. (b). Volcano plot of differentially expressed miRNAs (left)/genes (right), where each dot represents a miRNA/gene. Upregulated and downregulated miRNAs/genes are shown as red and green dots, respectively, while the blue and black dots represent those miRNAs/genes whose expressions are not significantly different between HCT116 and HCT116/L cells. The x-axis indicates the difference of the identified miRNA/gene level, while the y-axis shows the significance of the miRNA/gene level. Fold change (FC) is a ratio of the expression of two samples and false discovery rate (FDR) is the adjusted p values using the Benjamini and Hochberg approach. Differentially expressed miRNAs and genes were identified by an FC greater than two-fold and an FDR less than 0.05. (c/d). Small RNA-Seq/RNA-Seq data and qRT-PCR validation of selected differentially expressed miRNAs/genes. Log2 FC/RQ is the logarithm of the fold change or relative quantity to base 2. Error bars represent the standard deviation (STDEV) of the qRT-PCR analysis (n = 3).
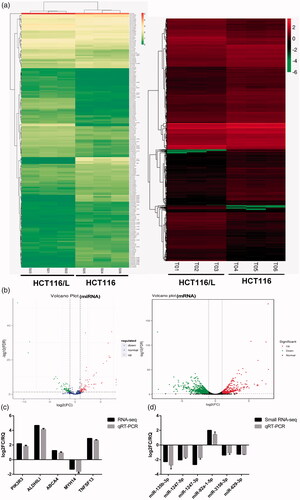
Table 3. Expression of 13 differentially expressed candidate miRNAs in colorectal cancer cells.
Overexpression of miR-483-3p restored oxaliplatin responsiveness in HCT116/L cells
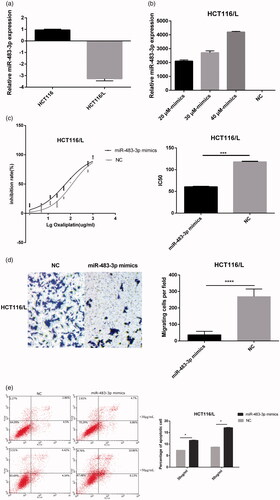
Notably, among the miRNAs down-regulated in HCT116/L cells, we observed that miR-484-3p () was associated with apoptosis [Citation27], proliferation [Citation28], and platinum resistance [Citation29]. Therefore, we taken it as the target of this study. To further determine the role of miR-483-3p in HCT116/L cells, miR-483-3p mimics which imitated mature miRNA duplexes were transfected in HCT116/L cells (). As can be seen from , drug sensitivity assays showed the 50% inhibitory concentrations (IC50) of oxaliplatin was decreased significantly in HCT116/L cells transfected with miR-483-3p mimics compared with a scrambled control. (The IC50 were 59.78 μg/mL and 118.8 μg/mL, respectively, p<.001), suggesting that overexpressed miR-483-3p attenuated the oxaliplatin resistance of HCT116/L cells. Furthermore, the effect of miR-483-3p mimics on apoptosis was examined by flow cytometry which can evaluate the percentage of early and late apoptotic cells. As expected, after 24 h of oxaliplatin (30 μg/mL and 50 μg/mL) treatment, cell apoptosis was increased in HCT116/L cells treated with miR-483-3p mimics (). We next investigated how ectopic expression of the miR-483-3p affected the ability of cell migration. As shown in , miR-483-3p upregulation suppressed the migration using transwell assays. Taken together, these results indicated that overexpression of miR-483-3p restored oxaliplatin responsiveness via increased apoptosis and weakened migration in HCT116/L cells.
Figure 3. Overexpression of miR-483-3p restored oxaliplatin responsiveness in HCT116/L cells. (a). qRT-PCR analysis was performed for miR-483-3p, which was differentially expressed between HCT116 and HCT116/L cells. The expression level of miR-483-3p was normalized to the level in HCT116 cells. (b). The expression level of miR-483-3p in HCT116/L transfected with different concentrations (20 μM, 30 μM and 40 μM) of miR-483-3p mimics. (c). The drug sensitivity of the HCT116/L cells transfected with negative control (NC) or miR-483-3p mimics. The IC50 of oxaliplatin in transfected HCT116/L cells was calculated from the inhibition curves. Each experiment was performed in triplicate. (d). The effect of overexpression of miR-483-3p on the migration using cell migration assay of HCT116/L cells. (e). Overexpression of miR-483-3p in HCT116/L cells increased the apoptosis rate. Various concentrations of oxaliplatin resulted in differences in the cell apoptosis rate. The data were presented mean ± SD of three independent experiments. *p < .05, **p < .01, ***p < .001 and ****p < .0001(Student’s t-test).
Inhibition of miR-483-3p enhanced the resistance of HCT116 cells to oxaliplatin treatment
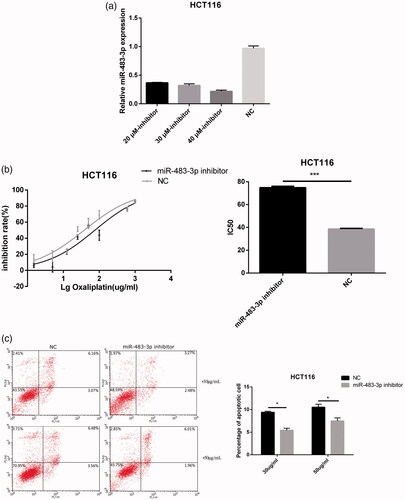
To more specifically confirm the role of miR-483-3p in oxaliplatin resistance, HCT116 cells were transfected with miR-483-3p inhibitor or a negative control (). Subsequently, drug sensitivity assays revealed that HCT116 cells transfected with miR-483-3p inhibitor greatly enhanced resistance to oxaliplatin compared with cells transfected with the miRNA inhibitor control (The IC50 were 75.68 μg/mL and 38.08 μg/mL, respectively, p < .001; ). In addition, pre-treatment with miR-483-3p inhibitor for 24 h followed by treatment with oxaliplatin (30 μg/mL and 50 μg/mL) decreased the proportion of apoptotic HCT116 cells when compared to pre-treatments with negative control (). These results suggested that inhibition of miR-483-3p might enhance oxaliplatin resistance at least in part by repressing apoptosis in HCT116 cells.
Figure 4. Downexpression of miR-483-3p enhanced the resistance of HCT116 to oxaliplatin treatment. (a). The expression level of miR-483-3p in HCT116 transfected with different concentrations (20 μM, 30 μM and 40 μM) of miR-483-3p inhibitor. (b). Inhibition of miR-483-3p induced by transfection of miR-483-3p inhibitor enhanced the resistance of HCT116 cells to oxaliplatin at 24 h post treatment. (c). Inhibition of miR-483-3p in HCT116 cells decreased the apoptosis rate. *p < .05 and ***p < .001 (Student’s t-test).
MiR-483-3p regulated oxaliplatin resistance by targeting FAM171B
In order to investigate the direct target genes of miR-483-3p, miRanda and RNAhybrid database which provide the current and comprehensive information of experimentally validated miRNA-target interactions were utilized. And FAM171B was predicted the direct target of miR-483-3p. As shown in , the expression of FAM171B was upregulated in the HCT-116/L cells when compared to HCT-116 cells. To more specifically elucidate that miR-483-3p negatively regulated the expression of FAM171B, miRNA inhibitors or mimics were transfected in CRC cells. We found that the expression of FAM171B was significantly increased after miR-483-3p inhibitor treatment compared with the control group in HCT116 cells (), whereas the mRNA level of FAM171B was markedly decreased in HCT116/L cells with miR-483-3p mimics treatment (). These results demonstrated that the expression of FAM171B was modulated by miR-483-3p.
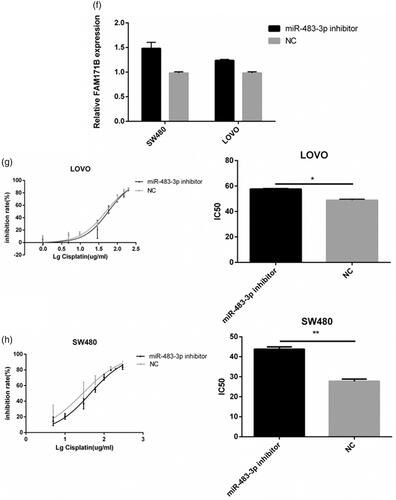
Figure 5. FAM171B is a direct target of miR-483-3p in CRC cells. (a). The expression levels of FAM171B between HCT116 and HCT116/L cells. (b). Relative levels of FAM171B mRNA were analysed by qRT-PCR in HCT116/L cells after different siRNA treatments. (c). Relative levels of FAM171B mRNA were analysed in HCT116 cells transfected with the miR-483-3p inhibitor and inhibitor negative control. (d). Relative levels of FAM171B mRNA were analysed in HCT116/L cells transfected with the miR-483-3p mimics and mimics negative control, separately. (e). Inhibitory effects of various concentrations of oxaliplatin on siR975-treated HCT116/L cells. (f). Relative levels of FAM171B mRNA by qRT-PCR in SW480 and LOVO cells transfected with the miR-483-3p inhibitor and inhibitor negative control. (g/h). Inhibitory effects of various concentrations of oxaliplatin on SW480 and LOVO cells transfected with the miR-483-3p inhibitor and inhibitor negative control. *p < .05, **p < .01, and ***p < .001 (Student’s t-test).
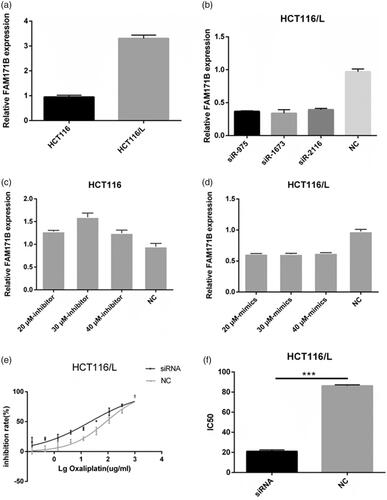
To further explore whether miR-483-3p modulated oxaliplatin resistance by targeting FAM171B, specific siRNAs targeting human FAM171B (siR975, siR1673, siR2116) and a scramble control (siNC) were used to transfect HCT116/L cells. It was noticed that the knockdown ratio of FAM171B was approximately 62% in HCT116/L cells (). As expected, the silencing of FAM171B in HCT116/L cells resulted in a statistically significant increase in sensitivity to oxaliplatin. The IC50 of oxaliplatin in siR975-treated HCT116/L cells and in siNC-treated HCT116/L cells were 22.12 μg/mL and 85.4 μg/mL, respectively (), suggesting that FAM171B was involved in the resistance of HCT116/L cells to oxaliplatin.
To examine whether FAM171B also played a role in oxaliplatin resistance in other CRC cells, two other CRC cell lines (SW480 and LOVO) all were transfected with the miR-483-3p inhibitor or the negative control. As shown in , FAM171B expressions were remarkably increased in miR-483-3p inhibitor group compared to negative control group in SW480 and LOVO cells. Drug sensitivity assay showed that the IC50 of oxaliplatin were significantly increased when upregulation of FAM171B in LOVO (49.42 μg/mL vs. 57.24 μg/mL, p < .05; ) and SW480 cells (28.53 μg/mL vs. 44.62 μg/mL, p < .01; ). Similar increase in resistance to oxaliplatin was observed in the SW480 and LOVO with HCT116 cells. Collectively, these data indicated that miR-483-3p regulated oxaliplatin resistance by targeting FAM171B in CRC cells.
Knockdown of FAM171B weakened cell migration in HCT116/L cells
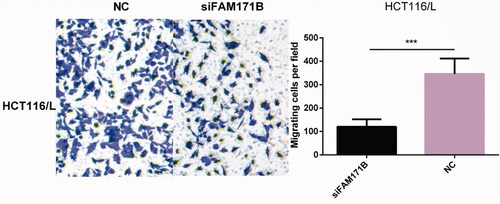
In the further experiment, we examined the effect of knockdown of FAM171B on cell migration in HCT116/L cells. Notably, transwell migration assays showed that the silencing of FAM171B dramatically inhibited migration behaviour of HCT116/L cells (), suggesting that FAM171B was a functional target of miR-483-3p in regulating biological behaviours of human colorectal cancer cells in vitro.
Figure 6. Effect of FAM171B knockdown on cell migration in HCT116/L. In vitro migration assay showed that knockdown of FAM171B weakened HCT116/L cell migration. ***p < .001 (Student’s t-test).
Discussion
Colorectal cancer mortality is quite high, especially in more developed countries, though its incidence is increasing in very recent years in developing areas of the world. Despite improvements in the efficacy of novel tumour targeting therapeutics, the resistance to some chemotherapy drugs, such as oxaliplatin, remains an obstacle in CRC treatment. The molecular mechanisms of oxaliplatin-resistance are multiple, one of which is the aberrant expression of miRNAs. Among these miRNAs, miR-483-3p was reported as a promising cancer predictive marker. The hsa-miR-483 gene is a mammal-conserved miRNA that resides at the 2nd intron of the human insulin growth factor 2 (IGF2) gene at the 11p15.5 chromosome region [Citation30]. The hsa-miR-483 gene encodes for two mature miRNAs: miR-483-5p and miR-483-3p, and both of them are found dysregulated in different types of cancer. Some studies have showed that miR-483-5p was abnormally observed in the serum of cancer patients, suggesting it may be a cancer biomarker in various malignancies [Citation31]. On the other hand, miR-483-3p regulates different cancer-related pathways such as chemoresistance, immune escape, cancer metabolism and anti-apoptosis. Interestingly, it has been reported that mature miR-483-3p is upregulated in some types of tumours [Citation32], but downexpressed in others [Citation33]. For example, silencing of miR-483-3p promotes acquired gefitinib resistance and EMT in EGFR-mutant NSCLC by targeting integrin β3 [34], whereas glucose uptake increases the expression of the oncogenic miR-483-3p through the OGT pathway in liver cancer cells [Citation17], suggesting that miR-483-3p may have complicated cancer-type specific functions. However, whether miR-483-3p is involved in oxaliplatin resistance has not been elucidated in colorectal cancer. Therefore, the purpose of this paper is to establish a link between miR-483-3p and oxaliplatin resistance in colorectal cancer.
In order to understand the roles of miR-483-3p in the tumorigenesis of colorectal cancer, our study used the small RNA-seq and RNA-seq to identify miRNAs and genes specifically expressed in HCT116 and HCT116/L cells, followed by a joint analysis of the two sequencing results. A total of 13 differentially expressed miRNAs and 252 target genes were obtained after screening. Finally, in view of the special role of miR-484-3p in cancer, we used it as the research object of this study. We found that miR-483-3p was down-regulated in the HCT116/L cells compared to HCT116 cells. This prompted us to examine the possible involvement of miR-483-3p in the drug-resistant phenotype and also to consider evidence about its potential oncogenic role. To better comprehend the mechanism of miR-483-3p associated with acquired resistance to oxaliplatin in vitro, we modulated miR-483-3p expression by transiently transfecting miR-483-3p mimics or inhibitor into HCT116/L cells and HCT116 cells, respectively. Then we assessed the sensitivity to oxaliplatin by drug sensitivity assay and verified the biological function of miR-483-3p through other experiments.
We observed that the inhibition of miR-483-3p correlated with reduced cell apoptosis and increased oxaliplatin-based chemoresistance in HCT116 cell. At the same time, miR-483-3p inhibitor also enhanced resistance of SW480 cells and LOVO cells to oxaliplatin. Indeed, it was previously shown that silencing of miR-483-3p promotes acquired gefitinib resistance and cell proliferation, inhibited cell apoptosis [Citation34]. But in our results, the inhibition of miR-483-3p had no effect on migration and cell proliferation, which may be that the pathways regulating drug resistance are multiple and complex. Conversely, sensitivity to oxaliplatin was further enhanced upon overexpression of miR-483-3p in HCT116/L cells, which was contrary to previous studies [Citation18]. The reason may be that miR-483-3p has specific functions in complex cancer types, or that cancer resistance is regulated by multiple miRNAs at the same time. In addition, miR-483-3p overexpressing decreased cell migration and increased cell apoptosis. It had been demonstrated that its pro-apoptotic activity was mediated by a direct targeting of several anti-apoptotic genes, such as API5, BIRC5 and RAN [Citation19].
Ectopic expression of miR-483-3p regulates drug resistance by regulating the expression of target genes in cancer. Such as, ATM kinase [Citation16], CD147 [Citation29], integrin β3 [Citation34] and PKC-alpha [Citation18]. In this study, we found that decreased expression of miR-483-3p was concomitant with increased expression of FAM171B in HCT116/L cells as compared with its HCT116 cells. Otherwise, overexpression of miR-483-3p induced downregulation of FAM171B in HCT116/L cells. At the same time, as a result of miR-483-3p inhibitor therapy of HCT116 cells, cellular FAM171B was significantly increased. Interestingly, previous studies found that there may be feedback regulation mechanisms between miRNAs and target genes [Citation35]. In addition, our results showed that the knockdown of FAM171B in HCT116/L cells increased sensitivity to oxaliplatin and decreased cell migration, which were consistent with the results of overexpressed miR-483-3p and further implied that FAM171B was the target of miR-483-3p in CRC.
In summary, we provide evidences that miR-483-3p expression is decreased in HCT116/L cells. And this is the first study supporting an association between miR-483-3p, FAM171B and oxaliplatin resistance in CRC. Altogether, our study provides new insight into mechanisms of acquired resistance to oxaliplatin and a potential target in CRC cells. However, further efforts are required to test the effect of miR-483-3p adjuvant treatment on clinical use of oxaliplatin for cancer patients.
Acknowledgements
We would like to acknowledge all those who contributed to the development of this research and provided input during the study.
Disclosure statement
No potential conflict of interest was reported by the authors.
Additional information
Funding
Related Research Data
References
- Jeyalakshmi K, Kumar S, Amber K, et al. Computational analysis of miRNA and their gene targets significantly involved in colorectal cancer progression. MicroRNA. 2018;7:1–9.
- Zhang J, Dhakal IB, Zhao Z, et al. Trends in mortality from cancers of the breast, colon, prostate, esophagus, and stomach in East Asia: role of nutrition transition. Eur J Cancer Prev. 2012;21:480–489.
- Rasmussen MH, Lyskjaer I, Jersie-Christensen RR, et al. miR-625-3p regulates oxaliplatin resistance by targeting MAP2K6-p38 signalling in human colorectal adenocarcinoma cells. Nat Commun. 2016;7:12436.
- Rasmussen MH, Jensen NF, Tarpgaard LS, et al. High expression of microRNA-625-3p is associated with poor response to first-line oxaliplatin based treatment of metastatic colorectal cancer. Mol Oncol. 2013;7:637–646.
- Graham J, Muhsin M, Kirkpatrick P. Oxaliplatin. Nat Rev Drug Discov. 2004;3:11.
- Hector S, Bolanowska-Higdon W, Zdanowicz J, et al. In vitro studies on the mechanisms of oxaliplatin resistance. Cancer Chemother Pharmacol. 2001;48:398–406.
- Landriscina M, Maddalena F, Laudiero G, et al. Adaptation to oxidative stress, chemoresistance, and cell survival. Antioxid Redox Signal. 2009;11:2701–2716.
- Ahmad S. Platinum–DNA interactions and subsequent cellular processes controlling sensitivity to anticancer platinum complexes. Chem Biodivers. 2010;7:543–566.
- Yang SY, Sales KM, Fuller B, et al. Apoptosis and colorectal cancer: implications for therapy. Trends Mol Med. 2009;15:225–233.
- Zhou Y, Tozzi F, Chen J, et al. Intracellular ATP levels are a pivotal determinant of chemoresistance in colon cancer cells. Cancer Res. 2012;72:304–314.
- Eulalio A, Huntzinger E, Izaurralde E. Getting to the root of miRNA-mediated gene silencing. Cell. 2008;132:9–14.
- Lu R, Ji Z, Li X, et al. miR-145 functions as tumor suppressor and targets two oncogenes, ANGPT2 and NEDD9, in renal cell carcinoma. J Cancer Res Clin Oncol. 2014;140:387–397.
- Xu W-G, Shang Y-L, Cong X-R, et al. MicroRNA-135b promotes proliferation, invasion and migration of osteosarcoma cells by degrading myocardin. Int J Oncol. 2014;45:2024–2032.
- Yang H, Kong W, He L, et al. MicroRNA expression profiling in human ovarian cancer: miR-214 induces cell survival and cisplatin resistance by targeting PTEN. Cancer Res. 2008;68:425–433.
- Kurokawa K, Tanahashi T, Iima T, et al. Role of miR-19b and its target mRNAs in 5-fluorouracil resistance in colon cancer cells. J Gastroenterol. 2012;47:883–895.
- Zhou Y, Wan G, Spizzo R, et al. miR-203 induces oxaliplatin resistance in colorectal cancer cells by negatively regulating ATM kinase. Mol Oncol. 2014;8:83–92.
- Pepe F, Pagotto S, Soliman S, et al. Regulation of miR-483-3p by the O-linked N-acetylglucosamine transferase links chemosensitivity to glucose metabolism in liver cancer cells. Oncogenesis. 2017;6:e328.
- Arrighetti N, Cossa G, De Cecco L, et al. PKC-alpha modulation by miR-483-3p in platinum-resistant ovarian carcinoma cells. Toxicol Appl Pharmacol. 2016;310:9–19.
- Bertero T, Bourget-Ponzio I, Puissant A, et al. Tumor suppressor function of miR-483-3p on squamous cell carcinomas due to its pro-apoptotic properties. Cell Cycle. 2013;12:2183–2193.
- Wen S, Wang X, Wang Y, et al. Nucleoside diphosphate kinase 2 confers acquired 5-fluorouracil resistance in colorectal cancer cells. Artif Cells Nanomed Biotechnol. 2018;46(Suppl. 1):896–905.
- Xu Y, Zhang C, Liang H, et al. Dishevelled 1, a pivotal positive regulator of the Wnt signalling pathway, mediates 5-fluorouracil resistance in HepG2 cells. Artif Cells Nanomed Biotechnol. 2018;1–9. doi:10.1080/21691401.2018.1453827.
- Fahlgren N, Howell MD, Kasschau KD, et al. High-throughput sequencing of arabidopsis microRNAs: evidence for frequent birth and death of miRNA genes. PLoS One. 2007;2:e219.
- Anders S, Huber W. Differential expression analysis for sequence count data. Genome Biol. 2010;11:R106.
- Betel D, Wilson M, Gabow A, et al. The microRNA.org resource: targets and expression. Nucleic Acids Res. 2008;36:D149–D153.
- Rehmsmeier M, Steffen P, Hochsmann M, et al. Fast and effective prediction of microRNA/target duplexes. RNA. 2004;10:1507–1517.
- Romualdi C, Bortoluzzi S, d’Alessi F, et al. IDEG6: a web tool for detection of differentially expressed genes in multiple tag sampling experiments. Physiol Genomics. 2003;12:159–162.
- Lupini L, Pepe F, Ferracin M, et al. Over-expression of the miR-483-3p overcomes the miR-145/TP53 pro-apoptotic loop in hepatocellular carcinoma. Oncotarget. 2016;7:31361–31371.
- Bertero T, Gastaldi C, Bourget-Ponzio I, et al. CDC25A targeting by miR-483-3p decreases CCND-CDK4/6 assembly and contributes to cell cycle arrest. Cell Death Differ. 2013;20:800–811.
- Peng L, Zhu H, Wang J, et al. MiR-492 is functionally involved in Oxaliplatin resistance in colon cancer cells LS174T via its regulating the expression of CD147. Mol Cell Biochem. 2015;405:73–79.
- Fu H, Tie Y, Xu C, et al. Identification of human fetal liver miRNAs by a novel method. FEBS Lett. 2005;579:3849–3854.
- Dai X, Pang W, Zhou Y, et al. Altered profile of serum microRNAs in pancreatic cancer-associated new-onset diabetes mellitus. J Diabetes. 2016;8:422–433.
- Veronese A, Lupini L, Consiglio J, et al. Oncogenic role of miR-483-3p at the IGF2/483 locus. Cancer Res. 2010;70:3140–3149.
- Wang W, Zhao LJ, Tan Y-X, et al. Identification of deregulated miRNAs and their targets in hepatitis B virus-associated hepatocellular carcinoma. World J Gastroenterol. 2012;18:5442–5453.
- Yue J, Lv D, Wang C, et al. Epigenetic silencing of miR-483-3p promotes acquired gefitinib resistance and EMT in EGFR-mutant NSCLC by targeting integrin β3. Oncogene. 2018;37:4300–4312.
- Valeri N, Braconi C, Gasparini P, et al. MicroRNA-135b promotes cancer progression by acting as a downstream effector of oncogenic pathways in colon cancer. Cancer Cell. 2014;25:469–483.