
 ?Mathematical formulae have been encoded as MathML and are displayed in this HTML version using MathJax in order to improve their display. Uncheck the box to turn MathJax off. This feature requires Javascript. Click on a formula to zoom.
Abstract
Introduction
Indinavir (IDV) is a potent HIV protease inhibitor used in the treatment of human immunodeficiency virus (HIV). IDV is a weak base with limited aqueous solubility in its unprotonated form; therefore, solubility of IDV in the gastrointestinal tract fluids is the rate-limiting step of its absorption and onset of action. However, in many cases, drugs are not absorbed well in the gastrointestinal tract; polymer nanoparticles were recognized as an effective carrier system for drug encapsulation and are now studied as a vehicle for oral delivery of insoluble compounds. Preparation of methoxy poly (ethylene glycol)-poly (e-caprolactone) (mPEG-PCL) nanoparticles is among the strategies to overcome low bioavailability of drugs with poor aqueous solubility.
Materials and method
The structure of the copolymers was characterized using 1H NMR, FTIR, DSC and GPC techniques. IDV loaded mPEG- PCL nanoparticles prepared by emulsification solvent evaporation method were optimized using D-optimal experimental design and were characterized by various techniques such as DLS, DSC, XRD, AFM and SEM. Using Caco-2 cells as a cellular model, we studied the cellular uptake and transport.
Results
In vivo pharmacokinetic studies were performed in rats. The plasma AUC (0–t), t1/2 and Cmax of IDV-mPEG-PCL NPs were increased by 5.30, 5.57 and 1.37 fold compared to the IDV solution, respectively.
Conclusion
The results of this study are promising for the use of biodegradable polymeric nanoparticles to improve oral drug delivery.
Introduction
Human Immunodeficiency Virus (HIV) infection is a retrovirus that causes the demolition of T cells called CD4, which are vital for human immune functions. The malfunction in these cells leads to the human acquired immune deficiency syndrome (AIDS), continues to be one of the most relevant healthcare problems at the global level and it is still a significant cause of morbidity and mortality worldwide [Citation1]. One of the most efficient methods for the therapy of AIDS is the use of protease inhibitors (PIs). IDV is a specific and potent protease inhibitor, which is commonly used as a drug for AIDS treatment [Citation2,Citation3].
IDV has been introduced as a BCS class IV (low permeability, low solubility) drug [Citation4–6]. IDV is typically administered orally as a capsule but its clinical applications have been limited because of the short biological half-life (1.8 h), extensive first-pass metabolism and low gastrointestinal absorption. Different nanotechnology strategies have been investigated in order to improve the performance of IDV [Citation3,Citation7,Citation8]. In recent years, a considerable amount of researches have been carried out using polymeric nanoparticles as nanocarriers for encapsulation, delivery and targeting of poorly water-soluble drugs for oral drug delivery [Citation9,Citation10]. Polymeric nanoparticles are generally composed of polymers such as poly (lactic acid) (PLA), poly (lactic-co-glycolic acid) (PLGA), polycaprolactone (PCL) and poly (glycolic acid) (PGA) [Citation11,Citation12]. These polymeric nanoparticles have some unique properties such as biocompatibility and biodegradability [Citation13,Citation14]. The main advantage of PCL compared to the other aliphatic polyesters, such as PLA and PLGA, is its high strength of permeability to drugs and especially the hydrophobic ones [Citation15–18]. The mPEG-PCL polymer is hydrolyzed at lower rates compared to the PLA and PLGA polymers and can be useful for slow release drug delivery applications [Citation19–21]. mPEG- PCLcopolymer has been widely used as carriers for poorly water-soluble drugs [Citation22–25].
Therefore, the main objective of this research was to design and prepare optimized IDV loaded polymer-based nanoparticles as a good candidate for oral drug delivery by applying a simple preparation method.
Materials and methods
Materials
Methoxy poly (ethylene glycol) (MePEG, Mn = 5000), ε-caprolactone (98% purity), Stannous-II octoate (Sn(Oct)2), Indinavir, Verapamil, Lusifer yellow and Polyvinyl alcohol (PVA, Mw 30,000–50,000 Da, 87% hydrolyzed) were purchased from Sigma-Aldrich. The 6-well Transwell inserts were purchased from Costar Corning, NY, USA. The Caco-2 cells were purchased from Pasteur Institute of Iran. Roswell Park Memorial Institutemedium (RPMI 1640), heated inactivity fetal bovin serum (FBS), trypsin-EDTA (0.025%), penicillin-streptomycin solution and Hanks' balanced salt solution (HBSS) containing CaCl2 and MgCl2. DMSO (99.5% purity) as a co-solvent, Triton-X100, dichloromethane (DCM), acetonitrile, chloroform and all other reagents were of analytical grade and used without further purification.
Synthesis of mPEG-PCL block copolymer
According to the previous reports, mPEG-PCL copolymer has been synthesized by ring-opening polymerization of ε-caprolactone, initiated by mPEG-5000 with Sn(Oct)2 as a catalyst [Citation26–28]. Briefly, pre-weighted amount of mPEG and ε-caprolactone (w/w = 1:2) were introduced into a dry two-necked flask containing Sn(Oct)2 and then dissolved in an anhydrous toluene solution. The system was kept under the nitrogen atmosphere at 130 °C for 24 h and then cooled in room temperature. After cooling, the resulted mixture was dissolved in chloroform and precipitated in excess cold diethyl ether in order to remove the monomers and catalyst. The mPEG-PCL copolymer was separated from the mixture by filtration method and then dried in a vacuum oven at 45 °C for 48 h.
Characterization of mPEG-PCL copolymer
The formation of mPEG-PCL copolymer has been determinated using proton nuclear magnetic resonance spectroscopy (1H NMR), Fourier transform infrared (FT-IR) and gel permeation chromatography (GPC). 1H NMR spectrum was obtained using a Bruker AVANCE 400 (Bruker, Germany) spectrometer, and FT-IR spectral studies were acquired using a Bruker FT-IR spectrometer (Tensor 27, Germany). The average molecular weight (Mw) and distribution of the mPEG–PCL copolymerconfirmed via a GPC (Knaure, Germany) system equipped with refractive index detector and an ultrastyragel column (Waters, USA). The mobile phase contained tetrahydrofuran (THF) with a flow rate of 1 ml/min. The calibration curve was generated using polystyrene standards with a molecular weight range from 4500 to 29,500 Da (Varian Palo Alto, CA) [Citation29].
Experimental design and optimization
The main objectives of this section were the experimental stages optimization in order to achieve the best imaginable analytical performance of the system, along with cost and time savings. In this study, a multi-purpose optimization method was used in order to optimize the preparation method of the polymeric mPEG–PCL nanoparticle [Citation30,Citation31]. Experimental design and statistical analysis have been accomplished with Design-Expert software (Version 7.0.2, State-Ease Minneapolis, MN, USA). A Response Surface, D-optimal design was used for estimating the contribution of the most effective factors include the amount of mPEG-PCL (A), PVP concentration (B), amount of organic phase (C) and their effects on the nanoparticle size, polydispersity index, drug loading efficiency and capacity. Three independent variables are shown in in the coded levels of + 1 and −1, which represent the highest and lowest values respectively. In order to achieve the optimum condition, 3D surfaces and contour graphs have been used for data analysis. F values, p values, and model F value of each independent variable were obtained from analysis of variance (ANOVA). Statistical analysis was considered significant and meaningful if the p values were less than 0.05.
Table 1. Considered variables and responses along with their levels and constraints.
Preparation of IND- mPEG-PCL NPs
A common method used for the preparation of polymeric nanoparticles is the emulsification-solvent evaporation method [Citation22,Citation32]. Briefly, a pre-determined amount of mPEG-PCL copolymer and IDV were dissolved in DCM. Then, the resulted solution was added to PVA aqueous solution while stirring continuously. Stirring continued until the solvent evaporates completely. In the next step, the nanoparticles were separated by ultracentrifuge at 40,000 rpm and 4 C for 30 min. Eventually, the prepared IDV-mPEG-PCL nanoparticles have been lyophilized and stored at 4 °C.
Characterization
Particle size and surface morphology
Nanoparticle’s mean diameter and polydispersity index (PI) were determined using dynamic light scattering (DLS) (Malvern, Worcestershire, UK). The operation was performed at temperature 25 °C, medium refractive index 1.33 and viscosity 0.8872 cP under 90° using samples appropriately diluted with deionized water. The morphology of nanoparticles was determined using scanning electron microscopy (SEM) (Phillips, the Netherlands) and Atomic Force Microscopy (AFM) (JPK, Berlin, Germany), In order to make the samples conductive, they were coated with a thin layer of gold before recorded by SEM at 20 KV. The AFM sample was prepared by casting a drop of the nanoparticle suspension on a slide cleaved mica substrate, and then it was dried in air. AFM measurements were performed in intermittent contact mode.
X-ray diffractometry (XRD) analysis
The crystallinity of IDV, mPEG-PCL copolymers, IDV-mPEG-PCL and physically mixed of IDV and mPEG-PCL copolymers have been characterized using powder X-ray diffractometer (XRD, X, Pert PRO MPD, Netherlands) with a copper anode (Generator Settings: 40 mv, 40 kV). The samples were scanned and analyzed from 2θ of 3–80° with a step size of (2θ): 0.0260 and scan step time(s) of 37.9950.
Differential scanning calorimetry (DSC) analysis
Thermal analysis of IDV-mPEG-PCL and bulk materials has been performed using Differential Scanning Calorimetry (DSC, Mettler Toledo, UK). About 4 mg of dried samples were completely sealed in the aluminum pans. Air was considered as a reference (empty pan). Samples were heated from 25 to 200 °C (heating rate of 10 °C/min) under the nitrogen atmosphere.
Drug loading and entrapment efficiency determination
Nanoparticles were dissolved in DCM, a common solvent for mPEG-PCL and IDV, and the organic solvent was evaporated under a nitrogen atmosphere. The resulted mixture was dissolved in 1 ml of the mobile phase of the HPLC assay. The concentration of free IDV was analyzed by HPLC method [Citation33]. The percentage of drug LC and LE have been calculated by applying the following equations [Citation34].
In vitro release studies
In vitro release studies of IDV from IDV-mMPEG-PCL were investigated using dialysis method. Due to the low solubility of IDV in water and in order to prepare a sink condition, simulated gastric fluid (pH 1.2), simulated intestinal fluid (pH 6.8) and phosphate buffer solution (pH 7.4) were used as receptor mediums. Amount of nanoparticles of the formulation was dialyzed buffer over a period of 96 h. In order to mimic the biological conditions, a bio-incubator (Heidolph, Germany) with temperature controlled shaker at 37 °C and agitation speed of 100 rpm has been used. The amount of released IDV in the receptor medium was determined by HPLC, and the accumulated release profile versus time was illustrated. This study has been reiterated triplicate, and the outcomes were explained as mean values ± standard deviation.
Release kinetics
In order to identify the dominating mechanism of the in vitro drug release of IDV-mPEG-PCL NPs, five kinetic models: zero-order, first-order, Hixson–Crowell, Higuchi and Korsmeyer–Peppas models were selected to fit the release profile. The goodness of fitting for the release kinetic models were evaluated with correlation coefficient values (R2) and the minimum Akaike information criterion (AIC). Data analysis was carried out using the Excel add-in DDSolver program.
Cell culture
The Caco-2 cell line between the passages 30–35 was cultured in 25 cm2 culture flask containing RPMI complete media. The culture flask was incubated at 37 °C under the condition of 5% CO2 atmosphere and 95% relative humidity. After reaching 70–80% confluency, the monolayer was washed with PBS and trypsinized to generate cell suspension. Dissociated cells were immediate with RPMI and subsequently centrifuged at 2000 rpm for 5 min. Pellet was re-dispersed and then subjected to cell count. Thereafter, cells were used in subsequent experiments [Citation32,Citation35].
Transport study
Cells were cultured at a density of 105 cells/cm2 onto 6-well transwell plates with the surface area of 4.7 cm2. The culture medium was changed every day and cell monolayers were used after 21–30 days post seeding. Prior to the experiment, the culture medium was replaced by transport buffer (HBSS, pH 7.4). The transwell membrane was investigated visually by optical microscopy in order to ensure the formation of a monolayer [Citation36]. The integrity of the monolayers was checked by monitoring the transport of the paracellular leakage marker, Lucifer yellow (LY), across the monolayers. In short, 1 ml of LY solution (100 μg/ml) was added to each well in the apical (AP) side and 2 ml of HBSS was added to each well in the basolateral (BL) side for AP-to-BL transport study. The culture plate was incubated for 2 h at 37 °C. 200 μl of aliquots were collected and transferred to a 96-well black plate for the fluorescence intensity measurement. Excitation and emission wavelengths were set at 485 nm and 535 nm, respectively. The cell monolayers were considered tight enough for the transport experiments when the Papp for LY was less than 0.5 × 10⁻⁶ cm/s. The transport buffer containing IDV-mPEG-PCLNPs formulations or IDV solution with concentrations of (10,100 and 200 μg/ml in HBSS) was added on AP (1 ml) side while the BLside of the inserts contained 2 ml volume of transport buffer. After incubating the culture at 37 °C for 30, 60, 120 and 180 min, 200 μl of aliquots was removed from BL side and replaced with the same volume of transport buffer to maintain experimental homeostasis. The concentration of IDV in samples was determined via HPLC method. All transport studies were conducted at 37 °C. The Papp expressed in cm/s, was calculated according to the following equation:
where ΔQ/Δt is the permeability rate (μg/min), A is the surface area of the cell membrane (cm2), C0 is the initial concentration of drug in the apical (μg/ml), and 60 is a coefficient for minute to second conversion.
Quantitative uptake Caco-2 cell using HPLC
For quantitative analysis, cells were seeded in a 12-well plate at a density of 1 × 10⁵ cells/cm2. Upon reaching to almost 80% confluency, the cells were equilibrated with HBSS (pH 7.4) for 1 h before the addition of IDV-mPEG-PCL NPs suspension and IDV solution at concentrations 10, 100 and 200 µg/ml. After 3 h of incubation, the IDV-mPEG-PCL NPs suspension and IDV solution were removed and the sample columns were washed with cold phosphate buffer solution (PBS, pH 7.4) in order to eliminate extra particles. The cell membrane was permeabilized with 0.5% Triton X-100 for 30 min. Afterwards, 250 µl of the mobile phase was added and the samples centrifuged for 10 min at 14,000 rpm and the supernatant was injected into the HPLC. In order to examine the effect of IDV concentration on the nanoparticle uptake, cells were treated with different concentrations of the drug in 3 h [Citation37,Citation38].
In vivo study
In order to perform the Pharmacokinetic studies, the male Sprague-Dawley rats (n = 14) that weighed 250–300 g and 6–8 weeks old from the Laboratory of Animals Center of Zanjan University of Medical Sciences were used. All animal studies were conducted in compliance with the Ethics Committee guidelines of the Zanjan University of Medical Science. The rats were kept in separate cages (54 × 33 × 20 cm) at 23 ± 2 °C for 12-h dark-light period. One day before the experiments, the rats were anaesthetized by intraperitoneal injection of 100 mg/kg ketamine and 10 mg/kg xylazine. Briefly, a polyethylene-silicone rubber cannula was inserted in the right jugular vein applying a standard surgical protocol [Citation39,Citation40]. Details of the surgery protocol have been described in our previous work [Citation41]. The IDV solution as control was prepared by dissolving IDV sulfate in water. On the day of experiments, the rats were intersected into two groups (for each group, n = 7) randomly, then each group received IDV solution, IDV-mPEG-PCL NPs through the gavages at the doses of 20 mg/kg of IDV. At time intervals of 0, 0.25, 0.5, 1, 2, 4, 6, 8, 10 and 12 h followed by the drug administration, a 500-μl blood sample was obtained from the cannula. After each sampling, the same volume was replaced with saline solution. Plasma was separated by centrifuging blood samples at 3000 × g for 10 min. Then, the supernatant fraction was transferred into a clear glass tube and was stored at −70 °C until further analysis. To 100 µL of plasma supernatant, 20 µL of perchloric acid (70%) was added, respectively; and, after vortex mixing for 1 min, the resulting suspension was centrifuged at 18,000 g for 10 min. To 100 µL of plasma precipitation supernatant, prepared as described, 20 µL of internal standard (verapamil) (50 µg/ml), 1 ml of KOH 4 M solution, and 3 ml of TBME were added in a polypropylene test tube. The resulting mixture was shaken at 1800 rpm for 15 min and then centrifuged at 5000 g for 10 min. The organic layer was separated by aspiration into a clean 13 ml polypropylene test tube and evaporated to dryness using a vacuumed centrifuge at ambient temperature. Finally, 100 µL of mobile phase was added to test tubes, vortex mixed for 1 min and 100 µL of the resulting solution was injected into the HPLC system [Citation33]. Pharmacokinetic parameters of the IDV, namely peak plasma concentration (Cmax), time to Cmax (Tmax), mean residence time (MRT) and area under the concentration-time curve (AUC0–t) were calculated using non-compartmental analysis. All parameter values are reported as the mean value ± standard deviation unless otherwise noted.
Statistical analysis
Results were presented as Mean ± Standard Deviation (SD). Uptake and transport data were analyzed using General Liner Model (GLM) by SPSS (Version 22, SPSS). A value of p <0.05 was considered significant.
Results and discussion
Synthesis and analysis of mPEG -PCL copolymers
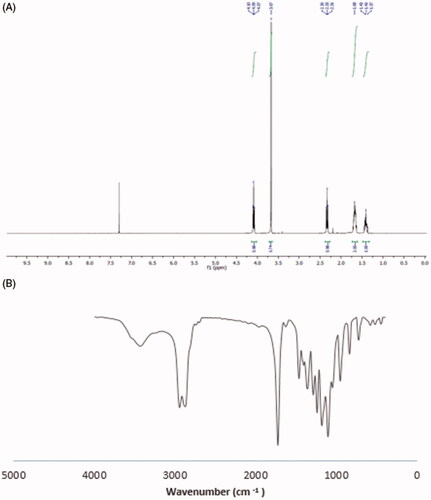
mPEG-PCL copolymers were synthesized by ring-opening polymerization. The 1HNMR spectrum of mPEG-PCL copolymer is shown in . The peak of 3.67 ppm is related to the hydrogen of PEG methyl group. The peaks of 1.42, 1.67, 2.31 and 4.08 ppm are related to methylenes (CH2) in PCL, respectively, which have good accordance with previous studies [Citation28,Citation42]. The GPC results showed that the weight and number-based average molecular weights of mPEG-PCL copolymer were 13.313 and 8.507 KDa, respectively. One of the other techniques which used for studying the synthesized copolymer was FT-IR spectrum. The FT-IR spectrum of mPEG-PCL copolymers is shown in . A sharp and intense absorption band detected at a frequency of 1730 cm−1 confirms the presence of esteric carbonyl groups (C = O) which indicates the formation of mPEG-PCL copolymer. These results show a good agreement with earlier studies [Citation28].
Figure 1. 1H NMR spectra of mPEG-PCL copolymer in CDCl3 (A). FT-IR spectrum of mPEG-PCL copolymer (B).
Experimental design and D-optimal design
Based on preliminary studies, the most effective factors include the amount of polymer (mPEG-PCL) (A), surfactant concentration (B) and amount of organic phase (C), and four dependent variables consist of particle size (PS), polydispersity index (PI), drug loading efficiency (DLE) and drug loading capacity (DLC) have been opted and 20 experimental runs were conducted. The design and results of the experiments are shown in . With the aim of predicting the optimized condition and fit the best mathematical model, the analysis of variance (ANOVA) was used for all of the responses (the data are shown in ). The equation obtained through software for the polymeric nanoparticles in particle size is as follows:
The suggested model is Quadratic. The F-value of 16.18 implies that the model is significant. The Values of “Prob > F” is less than 0.05. In this case, A, B, BC, A2 and B2 are significant model terms. The Lack of fit test was not significant. In the PZ equation, the positive coefficient of A indicates a significant effect of increasing it on PS and also the magnitude of its coefficients indicates the relative contributions of this factor on the response. The difference between the signs of the coefficients of B and B2 in the equation indicates that the amount of surfactant has a dual effect on the size of nanoparticles. In low amounts of surfactant, the increase in the amount of surfactant will lead to the decrease of the particle size. This can be due to the placing of surfactant molecules on nanoparticles’ surface and reducing the surface tension between the organic-aqueous phases and the size of the droplets formed in the initial emulsion. On the other hand, PVP forms a protective layer around the emulsion droplets and which can prevent aggregation of droplets. While with high amounts, increasing the amount of surfactant leads to the formation of particles with greater size, due to the viscosity increase. Scholes et al. showed that increasing the emulsifier concentration has a dual effect on particle size in PLGA nanospheres [Citation43]. In the present study, a decrease in particle size was observed when the volume of aqueous phase increased, which is attributed to the reduction of viscosity. The equation for the polymeric nanoparticles in PDI which was obtained from the software is as follows.
Table 2. Experimental design matrix, and analysis of variance for D-optimal design.
The suggested model is linear. The F-value of 21.60 implies that the model is significant. Values of “Prob > F” less than 0.05 indicate that the model terms are significant. In this case, A, B and C are significant terms of the model. The Lack of fit test was not significant. The “Pred R-Squared” of 0.6934 is in reasonable agreement with the “Adj R-Squared” of 0.7648. A very small value of A coefficient showed that this factor had a lower impact on PDI than other variables. The equation obtained from software for the polymeric nanoparticles in DEE is as follows.
The F-value of 7.84 implies the model is significant. Values of “Prob > F” less than .0500 indicate model terms are significant. In this case, A, B, CB and A2 are significant terms of the model. The Lack of fit test was not significant. In the DEE equation, the positive coefficient of A shows a significant effect of increasing A on DEE. Final equation obtained from the software for the polymeric nanoparticles in DLE is as follows:
It seems that in quantities less than 40 mg, the amount of polymer is not sufficient for accumulation to occur. Increasing the amount of polymer to 100 mg had no significant effect on particle size but cause the drug accumulation to be increased. The percentage of drug accumulation in the presence of different volumes of the internal phase practically did not differ significantly. In addition, by increasing the amount of organic phase, the amount of accumulated drug did not change significantly. As shown earlier in the results, the amount of polymer and surfactant percentages with p values < 0.05 have the greatest effect on nanoparticle size. In addition, the amount of organic phase with p values > 0.05 did not have a significant effect on the size of nanoparticles.
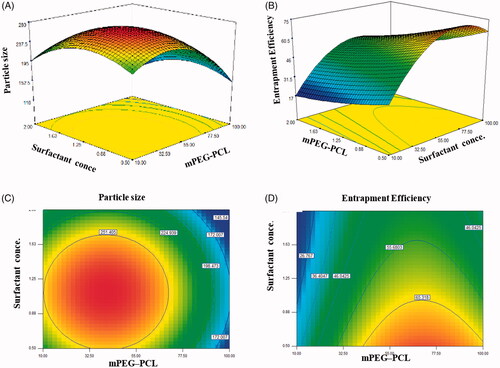
The 3D surfaces studies showed that the curvature of mPEG–PCL axis is remarkable while the curvature of particle size and entrapment efficiency is gradual along the surfactant concentration . It can be concluded that the value of particle size and entrapment efficiency were strongly influenced by mPEG–PCL. The contour plot of response surface of particle size is elliptical, which shows an interaction between surfactant concentration and mPEG–PCL . The interaction between mPEG–PCL and surfactant concentration is more noteworthy (complete elliptical contour) . The highest response value occurred at the ellipse center (the point that two main axes cut each other) that is in a good agreement with the regression equation results. In contour plot of response surface of entrapment efficiency, the interaction between variables was not observed .
Figure 2. Interactive effect of surfactant concentration and amount of mPEG-PCL on the particle size and 3D surfaces (A,B); interactive effect of surfactant concentration and amount of mPEG-PCL on the entrapment efficiency and 3D surfaces (C,D).
The results of the experimental design indicated that this system was highly influenced by the amount of mPEG–PCL, which resulted in high drug EE and small particle sizes for the preparation of mPEG–PCL NP loaded with indinavir. On the basis of selected solution PS, PI, DLE and DLC of the predicted optimal mPEG–PCL NP loaded with IDV were optimized at 211.41 nm, 0.273, 76.26% and 5.19% at optimum values of the dependent variables that set as follow: A: 82.24, B: 0.5 and C: 15 ml. In order to evaluate the validity of the selected solution, three repetitions of the experiment were done. The result showed that there was a good agreement between the predicted and experimental values.
Preparation and characterization of IDV-mPEG-PCL NPs
The prepared IDV-mPEG NPs had the mean particle size of 211 ± 10.12 nm with the polydispersity index of 0.220 ± 0.15. The morphological characteristics of IDV-mPEG-PCL NPs in the optimal formulation have been investigated using SEM and AFM. As it is shown in , the observed particle size corresponds to the results of DLS and the morphology of the nanoparticles is spherical.
Figure 3. AFM image of IDV-mPEG-PCL NPs (A). SEM image of IDV-mPEG-PCL NPs (B). DSC spectra of IDV, mPEG-PCL, the physical mixture of free IDV and MPEG-PCL and IDV-mPEG-PCL NPs (C). XRD spectra of IDV, mPEG-PCL, the physical mixture of free IDVand MPEG-PCL and IDV-mPEG-PCL NPS (D).
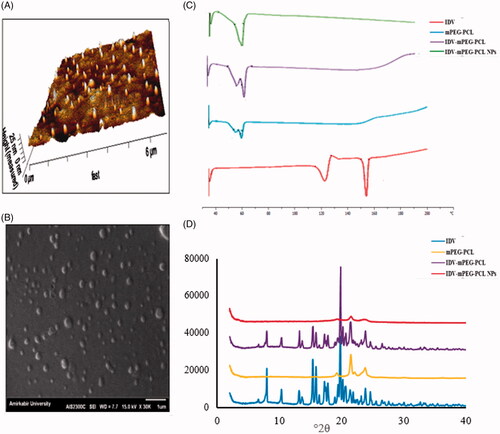
The DSC thermogram of IDV, mPEG-PCL and IDV-mPEG-PCL NPs are depicted in . Crystalline IDV demonstrated two sharp endothermic peaks at 122.95 and 156.25. The DSC thermogram of IDV showed a small endotherm at 122.95 °C, which could be assigned to water molecules bounded to the IDV crystal lattice to form the monohydrate. An additional endotherm at 156.25 corresponded to the Tm of the drug its melting point (Tm) [Citation42], which were disappeared in the IDV-mPEG-PCL NPs thermogram. It can be related to the change in the physical state of IDV from crystalline to amorphous.
The XRD spectra of IDV, mPEG-PCL, the physical mixture of IDV and mPEG-PCL and IDV-mPEG-PCL NPs are shown in . Free IDV has the characteristic peaks at 2θ of 5–30° by X-ray diffraction analysis, due to its crystalline structure. Angles at 2θ 10.85, 12.91, 18.59, 19.40, 20.91, 21.69, 23.80 and 24.54° degrees indicates IDV's crystalline nature, which was confirmed by previous studies [Citation44]. However, these peaks could not be detected in the XRD spectra of IDV-mPEG-PCL NPs which indicated that the transformation of IDV from crystalline structure to amorphous state during the preparation of IDV-mPEG-PCL NPs, and it could be concluded that IDV was molecularly incorporated in the core–shell structure of mPEG-PCL NPs. This conclusion could be further confirmed by the XRD spectrum of physical mixture of IDV and mPEG-PCL, in which the characteristic diffraction peaks of IDV and mPEG-PCL were both obvious [Citation23,Citation26]. These results were consistent with the entrapment efficiency and DSC analysis results [Citation45].
In vitro release profile
The release profiles of free IDV and IDV-mPEG-PCL NPs in simulated gastric fluid (pH 1.2), simulated intestinal fluid (pH 6.8) and phosphate buffer solution (pH 7.4) in sink conditions are shown in . The release of free IDV was evaluated to verify that the diffusion of drug molecules across the dialysis membrane was not a rate-limiting. The results showed that up to 90% of free IDV were released in the initial hours, during the test period. The results revealed the maximum drug release percent attainable after a period of 96 h in PBS pH 1.2, 6.8 and 7.4 were 60%, 40% and 15%, respectively. IDV is a weak base with pKa of 3.7 and 5.9. The solubility of IDV is very high in an acidic environment but relatively low in a neutral environment, showing its release behaviour was dependent on pH. The IDV-mPEG-PCL NPs release rate was faster in SGF than PBS. Approximately 15% of IDV was released from IDV-mPEG-PCL NPs in PBS within 12 h compared with nearly 60% in SGF.
Figure 4. The release profiles of IDV-m-PEG-PCL NPS and free drug behavior through the dialysis membrane in PBS (pH 7.4, 37 °C) (A). Plasma concentration-time curves of IDV-mPEG-PCL NPs and IDV solution after oral administration (20 mg/kg of IDV in rat) (B). Effect of concentration on IDV transport from the apical to basolateral side of the Caco-2 cell monolayer. NPs concentrations and IDV (10, 100,and 200 μg/ml) (C). The Caco-2 cell uptake efficiency measurement after 3 h incubation with IDV-mPEG-PCL NPs and IDV at 37 °C. NPs concentrations and IDV (10, 100 and 200 μg/ml) (D). Data represent mean ± SD, n = 3.
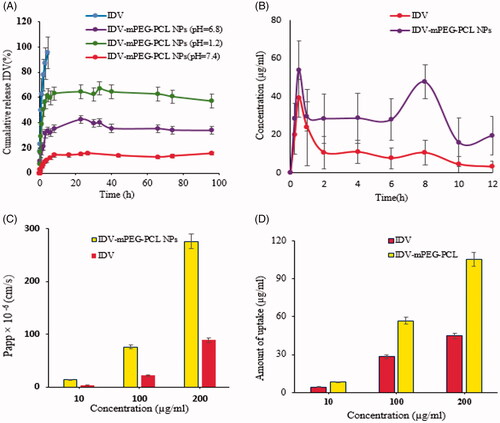
However, based on the presented figure, loaded IDV in polymeric NPs have a sustained release profile. The released profile of IDV showed a two-step profile. A relatively burst release of IDV-mPEG-PCL NPs in the first step has been observed in the first 12 h due to rapid diffusion of IDV from IDV-mPEG-PCL matrix. However, at the second step, a steady and sustained release of drug was observed. The sustained release of IDV from mPEG-PCL NPs has mediated the entrapment of IDV in the inner part of IDV-mPEG-PCL NPs matrix. This initial burst release and sustained release has been reported by some studies on polymeric nanoparticles [Citation27,Citation46]. The IDV-mPEG-PCL NPs were able to sustain release IDV. Due to hydrophobicity, the interaction of IDV with the hydrophobic segment of the copolymer (PCL) is stronger, resulting in a sustained release. Thus, the release of IDV is expected to occur as the polymer is hydrolytically and/or enzymatically degraded into the body. Regarding the first few hours of the experiment, IDV released may be derived from weak interactions with mPEG-PCL [Citation39]. The various kinetic equations were fitted to the release data of IDV from prepared IDV-mPEG-PCL NPs. The release data modelling is summarized in . Furthermore, based on the correlation coefficient criterion and AIC, the release profiles of the NPs in SGF, SIF and PBS were best fitted with the Korsmeyer–Peppas model (R2 = 0.9008, 0.8418 and 0.9026, respectively).
Table 3. Summary of model parameters of IDV release data.
Transport studies of IDV-mPEG-PCL NPs
The effect of Papp coefficient of free IDV and encapsulated IDV on Caco-2 cell monolayer was studied with different concentrations . Formation of the cell monolayer has been ensured using an optical microscope. The confluent cell monolayer has been formed on the transwell membrane filter after 21 days. The results of transport studies illustrated that IDV solution causes a significant decrease in transports of IDV across the cell monolayer compared to encapsulated IDV (p < 0.05). The amount of transported IDV that passed through the Caco-2 cells increased by increasing the concentration. The values of Papp coefficient, less than 1 × 10⁻⁶ cm/s, show low permeability more than 2 × 10⁻⁶ cm/s show intermediate permeability and values above 10 × 10−6 cm/s show high permeability [Citation47,Citation48]. Using these criteria, it is clear from that the majority of the compounds which have been studied in IDV-mPEG-PCL NPs and Caco-2 monolayers are highly permeable. Increasing the efficiency of transport of IDV-mPEG-PCL NPs is regulated by considering the polymer hydrophobicity. PCL can interact better with intestinal epithelium due to the hydrophobic-hydrophilic interaction.
Cell uptake studies of IDV-mPEG-PCL NPs
The amount of uptake of IDV-mPEG-PCL NPs and IDV by the Caco-2 cells with different concentrations is shown in ; uptake studies of IDV across the cell monolayer showed an increase in the uptake from polymeric NPs which was significant (p < 0.05) compared to IDV solution. In addition, it was shown that increasing the concentration of IDV-mPEG-PCL NPs leads to enhancing the cells uptake. In other words, the uptake of nanoparticles by Caco-2 cells was concentration dependent and increased with concentration augmentation. This phenomenon has been reported by some studies on polymeric nanoparticles [Citation38].
In vivo pharmacokinetics
To confirm whether IDV-mPEG-PCL NPs can improve the pharmacokinetics of IDV in vivo, the pharmacokinetics of IDV solution and IDV-mPEG-PCL NPs was studied in rats. Rats were orally administered with IDV or IDV-mPEG-PCL NPs (IDV 20 mg/kg). Blood was collected at different time intervals. Results of pharmacokinetics are shown in and and were analyzed using Excel add-in pkSolver program. Plasma concentration-time curves of IDV-mPEG-PCLNPs and IDV solution after Oral administration (20 mg/kg of IDV in rat) are shown in . The relevant pharmacokinetic parameters have also been summarized in . With regard to the non-compartmental analysis, the NPs exhibited pharmacokinetic parameters that were significantly altered compared to those of the IDV solution. Its pharmacokinetic parameters suggested that the NPs could extend . It is also worth noting that the Cmax of the NPs (53.84844 µg/mL) was reached within a half-life of IDV from 2.23 h to 12.4083 h (p < 0.05) and delay the MRT from 5.068 h to 17.708 h (p < 0.05). It is also worth noting that the Cmax of the NPs (53.84844 µg/mL) was reached within 0.5 h, demonstrating that there are different absorption rates for solution IDV and IDV-mPEG-PCL NPs. In addition, the AUC0–t for the formulation was approximately 5.30-fold higher than that of free IDV. Thus, it was suggested that encapsulation of IDV in mPEG-PCL NPs improved t½, AUC0–t, AUC0–∞ and Cmax of IDV in vivo [Citation28]. The important findings of this study are the double peak phenomenon and the alterations in plasma IDV concentration-time curves. Multiple previous studies have reported similar double peak phenomenon in Saquinavir PK profiles. In fact, IDV is one of the class IV compounds categorized in Biopharmaceutics Classification System (BSC) with low solubility and low permeability. The dissolution of IDV is a critical limiting step for its intestinal absorption. Since IDV has an ionizable group and is a weak base at pk 3.7 and 5.9, its solubility decreases with increasing pH (from 1 to 8), and precipitation occurs as the drug enters the small intestine that results in vitro release confirms. When the drug enters the colon (cecum) with (pH 5), increased dissolution and solubility result in absorption augment and contribute to the second peak. This phenomenon has been reported by some studies [Citation49,Citation50].
Table 4. The plasma pharmacokinetic parameters of IDV after oral administration of IDV solution, and IDV-mPEG-PCL NPs at a dose of 20 mg/kg in the rat.
Conclusion
The copolymer mPEG-PCL has been synthesized and characterized. The copolymer mPEG-PCL, which could self-assemble into nanoparticles. The preparation procedure of IDV-mPEG-PCL NPs was simple and without homogenizer. mPEG-PCL NPs encapsulated IDV was prepared, with the goal of improving the water solubility and permeability of IDV. The drug loading and the entrapment efficiency of IDV to these nanoparticles are good. The morphology of the polymeric NPs has been studied using SEM and AFM. The in vitro release studies showed that the release of encapsulated IDV has initial burst release followed by sustained release. IDV-mPEG-PCL NPs were prepared and designed for transport and uptake cellular in vitro. The Papp of IDV transported in the AP-BL direction was higher in the case of IDV loaded in polymeric NPs in comparison to free IDV. The results of pharmacokinetic studies in rat showed that the administration of the IDV-mPEG-PCL NPs produced an increase in the plasma concentration of IDV compared with the IDV solution. After oral administration of IDV-mPEG-PCL NPs, AUC0–∞ IDV was increased in comparison with IDV solution. Also, the reported amounts for MRT and t1/2 IDV-mPEG-PCL NPs were significantly higher than those for IDV solution that the IDV-mPEG-PCL NPs enhance systemic circulation t½ of IDV in vivo. In addition, a good cellular uptake by Caco-2 cell line and enhance systemic circulation t½ of IDV in vivo. In conclusion, the results demonstrated that nanoparticles of biodegradable polymers of small enough size and with the appropriate surface coating may have great potential for being utilized as a means of orally delivery lipophilic drugs.
Acknowledgements
The authors are most grateful for the continuing technical support of this research project by Faculty of Pharmacy, Hamadan University of Medical Sciences. The authors would like especially thank, Dr Mohammad Reza Saghatchi Zanjani for his kind helps in animal testing part of the study.
Disclosure statement
No potential conflict of interest was reported by the authors.
Additional information
Funding
References
- O'Keefe M. Lessons from the rise and fall of the military AIDS hypothesis: politics, evidence and persuasion. Contemp Politics. 2012;18:239–253.
- Safren SA, W. Otto M, Worth JL, et al. Two strategies to increase adherence to HIV antiretroviral medication: life-steps and medication monitoring. Behav Res Ther. 2001;39:1151–1162.
- Prabhakar K, Afzal SM, Surender G, et al. Tween 80 containing lipid nanoemulsions for delivery of indinavir to brain. Acta Pharm Sin B. 2013;3:345–353.
- Holmstock N, De Bruyn T, Bevernage J, et al. Exploring food effects on indinavir absorption with human intestinal fluids in the mouse intestine. Eur J Pharm Sci. 2013;49:27–32.
- Lindenberg M, Kopp S, Dressman JB. Classification of orally administered drugs on the World Health Organization Model list of Essential Medicines according to the biopharmaceutics classification system. Eur J Pharm Biopharm. 2004;58:265–278.
- Wu C-Y, Benet LZ. Predicting drug disposition via application of BCS: transport/absorption/elimination interplay and development of a biopharmaceutics drug disposition classification system. Pharm Res. 2005;22:11–23.
- de Oliveira MP, et al. Tissue distribution of indinavir administered as solid lipid nanocapsule formulation in mdr1a (+/+) and mdr1a (−/−) CF-1 mice. Pharm Res. 2005;22:1898–1905.
- Sosnik A, Imperiale JC, Vázquez-González B, et al. Mucoadhesive thermo-responsive chitosan-g-poly (N-isopropylacrylamide) polymeric micelles via a one-pot gamma-radiation-assisted pathway. Colloids Surf B Biointerfaces. 2015;136:900–907.
- Letchford K, Burt H. A review of the formation and classification of amphiphilic block copolymer nanoparticulate structures: micelles, nanospheres, nanocapsules and polymersomes. Eur J Pharm Biopharm. 2007;65:259–269.
- Soppimath KS, Aminabhavi TM, Kulkarni AR, et al. Biodegradable polymeric nanoparticles as drug delivery devices. J Control Release. 2001;70:1–20.
- Nahar M, et al. Functional polymeric nanoparticles: an efficient and promising tool for active delivery of bioactives. Crit Rev Ther Drug Carrier Syst. 2006;23:259–318.
- Satija J, Gupta U, Jain NK. Pharmaceutical and biomedical potential of surface engineered dendrimers. Crit Rev Ther Drug Carrier Syst. 2007;24:257–306.
- Gref R, Minamitake Y, Peracchia M, et al. Biodegradable long-circulating polymeric nanospheres. Science 1994;263:1600–1603.
- Duncan R. The dawning era of polymer therapeutics. Nat Rev Drug Discov. 2003;2:347
- Sinha VR, Bansal K, Kaushik R, et al. Poly-ɛ-caprolactone microspheres and nanospheres: an overview. Int J Pharm. 2004;278:1–23.
- Labet M, Thielemans W. Synthesis of polycaprolactone: a review. Chem Soc Rev. 2009;38:3484–3504.
- Li Z, Tan BH. Towards the development of polycaprolactone based amphiphilic block copolymers: molecular design, self-assembly and biomedical applications. Mater Sci Eng C. 2014;45:620–634.
- Li N, Zhao L, Qi L, et al. Polymer assembly: promising carriers as co-delivery systems for cancer therapy. Prog Polym Sci. 2016;58:1–26.
- Taboada P, Velasquez G, Barbosa S, et al. Block copolymers of ethylene oxide and phenyl glycidyl ether: micellization, gelation, and drug solubilization. Langmuir. 2005;21:5263–5271.
- Ribeiro MENP, Vieira ÍGP, Cavalcante IM, et al. Solubilisation of griseofulvin, quercetin and rutin in micellar formulations of triblock copolymers E62P39E62 and E137S18E137. Int J Pharm. 2009;378:211–214.
- Crothers M, Zhou Z, Ricardo NMPS, et al. Solubilisation in aqueous micellar solutions of block copoly (oxyalkylene). Int J Pharm. 2005;293:91–100.
- Gou M, Wei X, Men K, et al. PCL/PEG copolymeric nanoparticles: potential nanoplatforms for anticancer agent delivery. Cdt. 2011;12:1131–1150.
- Gou M, Men K, Shi H, et al. Curcumin-loaded biodegradable polymeric micelles for colon cancer therapy in vitro and in vivo. Nanoscale. 2011;3:1558–1567.
- Feng R, et al. Novel star-type methoxy-poly (ethylene glycol)(PEG)–poly (ε-caprolactone)(PCL) copolymeric nanoparticles for controlled release of curcumin. J Nanopart Res. 2013;15:1748.
- Zhao L, Li N, Wang K, et al. A review of polypeptide-based polymersomes. Biomaterials. 2014;35:1284–1301.
- Xue B, Wang Y, Tang X, et al. Biodegradable self-assembled MPEG-PCL micelles for hydrophobic oridonin delivery in vitro. J Biomed Nanotechnol. 2012;8:80–89.
- Mohanty AK, Jana U, Manna PK, et al. Synthesis and evaluation of MePEG-PCL diblock copolymers: surface properties and controlled release behavior. Prog Biomater. 2015;4:89–100.
- Peng W, Jiang X-y, Zhu Y, et al. Oral delivery of capsaicin using MPEG-PCL nanoparticles. Acta Pharmacol Sin. 2015;36:139.
- Danafar H, et al. Biodegradable m-PEG/PCL core-shell micelles: preparation and characterization as a sustained release formulation for curcumin. Adv Pharm Bull. 2014;4:501–510.
- Sadegh Malvajerd S, Azadi A, Izadi Z, et al. Brain delivery of curcumin using solid lipid nanoparticles and nanostructured lipid carriers: preparation, optimization, and pharmacokinetic evaluation. ACS Chem Neurosci. 2019;10:728–739.
- Derringer G, Suich R. Simultaneous optimization of several response variables. J Qual Technol. 1980;12:214–219.
- Derakhshandeh K, et al. Preparation and in vitro characterization of 9-nitrocamptothecin-loaded long circulating nanoparticles for delivery in cancer patients. Int J Nanomedicine. 2010;5:463.
- Hamidi M. Simple and sensitive high‐performance liquid chromatography method for the quantitation of indinavir in rat plasma and central nervous system. J Sep Sci. 2006;29:620–627.
- Khuroo T, Verma D, Talegaonkar S, et al. Topotecan–tamoxifen duple PLGA polymeric nanoparticles: investigation of in vitro, in vivo and cellular uptake potential. Int J Pharmaceutics. 2014;473:384–394.
- Fatima S, Iqbal Z, Panda AK, et al. Polymeric nanoparticles as a platform for permeability enhancement of class III drug amikacin. Colloids Surf B Biointerfaces. 2018;169:206–213.
- Shamsa ES, et al. Nanoparticles prepared from N, N-Dimethyl-N-Octyl chitosan as the novel approach for oral delivery of insulin: preparation, statistical optimization and in-vitro characterization. Iranian J Pharm Res. 2018;17:442.
- Win KY, Feng S-S. Effects of particle size and surface coating on cellular uptake of polymeric nanoparticles for oral delivery of anticancer drugs. Biomaterials. 2005;26:2713–2722.
- Derakhshandeh K, Hochhaus G, Dadashzadeh S. In-vitro cellular uptake and transport study of 9-nitrocamptothecin PLGA nanoparticles across Caco-2 cell monolayer model. Iranian J Pharm Res. 2011;10:425.
- Waynforth HB, Flecknell PA. Experimental and surgical technique in the rat. Vol. 127. London: Academic Press; 1980.
- Harms P, Ojeda S. A rapid and simple procedure for chronic cannulation of the rat jugular vein. J Appl Physiol. 1974;36:391–392.
- Dadashzadeh S, Derakhshandeh K, Shirazi FH. 9-nitrocamptothecin polymeric nanoparticles: cytotoxicity and pharmacokinetic studies of lactone and total forms of drug in rats. Anti-Cancer Drugs. 2008;19:805–811.
- Piazza RD, Brandt JV, Gobo GG, et al. mPEG-co-PCL nanoparticles: the influence of hydrophobic segment on methotrexate drug delivery. Colloids Surf A Physicochem Eng Aspects. 2018;555:142–149.
- Scholes PD, Coombes AGA, Illum L, et al. The preparation of sub-200 nm poly (lactide-co-glycolide) microspheres for site-specific drug delivery. J Control Release. 1993;25:145–153.
- Singh P, Premkumar L, Mehrotra R, et al. Evaluation of thermal stability of indinavir sulphate using diffuse reflectance infrared spectroscopy. J Pharm Biomed Anal. 2008;47:248–254.
- Imperiale JC, Bevilacqua G, Rosa P. d T V E, et al. Production of pure indinavir free base nanoparticles by a supercritical anti-solvent (SAS) method. Drug Dev Ind Pharm. 2014;40:1607–1615.
- Qiu J-F, et al. Preparation and characterization of monomethoxy poly (ethylene glycol)-poly (ε-caprolactone) micelles for the solubilization and in vivo delivery of luteolin. Int J Nanomedicine. 2013;8:3061.
- Yee S. In vitro permeability across Caco-2 cells (colonic) can predict in vivo (small intestinal) absorption in man-fact or myth. Pharm Res. 1997;14:763–766.
- Artursson P, Karlsson J. Correlation between oral drug absorption in humans and apparent drug permeability coefficients in human intestinal epithelial (Caco-2) cells. Biochem Biophys Res Commun. 1991;175:880–885.
- Li J, Liu Y, Yu X, et al. Reduced oral bioavailability and altered pharmacokinetics of saquinavir by co-administration with biochanin A in rats. Drug Res (Stuttg). 2016;66:484–488.
- Li J, Liu Y, Zhang J, et al. Effects of resveratrol on P-glycoprotein and cytochrome P450 3A in vitro and on pharmacokinetics of oral saquinavir in rats. Drug Des Devel Ther. 2016;10:3699.