
Abstract
Background
Histone H1.5 has been considered as a novel cancer marker as its expression is associated with various human cancers. The objective of this study was to explore the effects of H1.5 phosphorylation in Ras-driven growth and migration of glioma cells.
Methods
The plasmids for expression of wide-type of Ras or RasG12V/Y40C were transfected into A172 cells. The expression levels of phosphorylated AKT and H1.5T10ph were tested by Western blot. The effects of H1.5T10ph on A172 cells growth and migration were determined by MTT, soft-agar colony formation, and transwell assay. qRT-PCR and ChIP assay were utilized to assess the role of H1.5T10ph in the transcription of Ras downstream genes. Besides, qRT-PCR and Western blot analysis were carried out to reveal the enzymes which were responsible for phosphorylating H1.5.
Results
H1.5T10ph was down-regulated by Ras mutation, which accompanied by the activation of AKT signaling. Ras-driven A172 cells growth and migration were inhibited when H1.5T10ph was overexpressed. Additionally, H1.5T10ph was able to regulate the transcription of Ras downstream genes, including CYR61, IGFBP3, WNT16B, NT5E, GDF15, and CARD16. Further experiments revealed that Ras-AKT signaling repressed H1.5T10ph expression through degradation of GSK3, and the degradation was dependent on MDM2 mediation.
Conclusion
Ras-AKT signaling driven the growth and migration of glioma cells possibly through repressing the phosphorylation of H1.5 at threonine 10. Ras-AKT activation repressed H1.5T10ph through MDM2-dependent degradation of GSK3. The findings provide a better understanding of Ras’s oncogenic functions which further suggest Ras as a therapeutic target for glioma.
Introduction
Glioma is a devastating invasive cerebral tumor accounting for 30–40% of all intracranial tumors [Citation1]. It is one of the leading causes of central nervous system tumor-related death around the world. As glioma is a highly aggressive tumor, surgery is difficult to achieve complete resection. Thus, adjuvant radiotherapy and chemotherapy following surgery are necessary in order to improve the outcome of patients with glioma. Nevertheless, the median survival rate of glioblastoma multiforme is only about 10 months [Citation2]. Further studies are currently focusing on the molecular mechanism of tumorigenesis to find out the specific therapeutic targets in glioma.
Numerous evidences suggest that the occurrence of glioma is related with the activation of multiple oncogenes, including Ras family genes [Citation3]. The family of Ras contains three members: K-Ras, H-Ras, and N-Ras. Among which, K-Ras was found to be essential for the maintenance of glioblastoma [Citation4]. Mutation of K-Ras is frequently occurred in patients with cancers, like colorectal cancer [Citation5] and cardia cancer [Citation6]. Besides this, Ras drives oncogenesis through acting as a GDP-GTP-regulated binary on-off switch, which regulates various signaling pathways that control the growth and metastasis of tumor cells [Citation7]. Ras mutations are known to activate various signaling pathways, including MAPK, ERK, and PI3K/AKT [Citation8,Citation9]. Targeting these signaling pathways has been considered as a novel strategy in treating human cancers which harbor Ras mutations [Citation9]. While the current studies suggest the oncogenic function of Ras mutation in a wide range of human cancers, the precise mechanisms underlined its function are not clear.
Histones are a class of basic proteins in eukaryocyte that consists of four members: H1, H2A, H2B, and H4. The function of histones on regulating gene expression is mainly dependent on its post-translational modification on the specific amino acid residues [Citation10]. For the selected example, repressing the trimethylation of histone H3 at lysine 4 (H3K4me3) by demethylase KDM5B was related to defects in genome silencing [Citation11]. Likewise, acetylation of histone H3 at lysine 27 (H3K27ac) increased the expression of transcription factors, including NRF1, GABPA, and MEF2A [Citation12]. Histone H1.5 is a somatic subtype of the histone H1 variants that functions as a pivotal regulator in stabilizing chromatin structure, gene expression, DNA repair, and cell proliferation [Citation13]. Moreover, histone H1.5 has been considered as a novel cancer marker as its expression is associated with various human cancers, like prostatic cancer [Citation13], ovarian granulosa cell tumor [Citation14], and leiomyoma [Citation15].
This article aimed to study whether histone H1.5 modification was involved in the progression of glioma induced by Ras-AKT activation. Besides this, how Ras-AKT signaling altered histone H1.5 modification was studied. The findings of this study will provide a better understanding of Ras’s oncogenic functions.
Materials and methods
Cell culture
A172 cells (American Type Culture Collection, ATCC, Manassas, VA) were cultured in Dulbecco’s Modified Eagle’s Medium (DMEM) medium (ATCC). To make a complete growth medium, fetal bovine serum (Gibco, Grand Island, NY) was added to a final concentration of 10%. Routine culture conditions are 37 °C at a humidified incubator with 5% CO2.
MG132, a proteasome inhibitor, was purchased from MedChemExpress (Monmouth Junction, NJ). MG132 with a concentration of 25 nM was used to treat cells for suppressing proteasomal chymotrypsin-like peptidase activity.
Plasmid construction and transfection
Full-length of Ras, H1.5, GSK3, and MDM2 were amplified by quantitative real-time polymerase chain reaction (qRT-PCR). The PCR products of Ras and H1.5 were, respectively, inserted into pEGFP-N1 plasmid (Clontech, Palo Alto, CA, USA). The pEGFP-RasG12V/Y40C construct for expression of RasG12V/Y40C was mutated using site-directed mutagenesis. The H1.5T10E construct for expression of the mimicked H1.5T10ph was constructed by using the TaKaRa MutanBEST Kit (Takara, Dalian, China). The full-length of GSK3 and MDM2 was inserted into pCMV-HA (Clontech, Palo Alto, CA, USA) or His-tagged vector (Invitrogen, Carlsbad, CA, USA), respectively. MDM2-MU was constructed by using site-directed mutagenesis. siRNA specific for MDM2 was purchased from GenePharma (Shanghai, China). The nontargeting siRNA was used as a reference control.
A172 cells were transfected with the plasmids and siRNAs with the mediation of Lipofectamine 2000 (Invitrogen). The transfection lasted for 48 h and transfection efficiency was tested by qRT-PCR or Western blot.
Cell viability
After the indicated transfection, cells were incubated at 96-well plates with a density of 5000 cells/well for 48 h. The viability of cells was measured by Cell Proliferation and Cytotoxicity Assay Kit (Beyotime, Shanghai, China). Optical density (OD) values at 570 nm were recorded by an enzyme-linked immunosorbent assay (ELISA) reader (Bio-Rad, Hercules, CA, USA) to evaluate cell viability.
Soft-agar colony formation assay
About 0.35 and 0.6% low-melting agarose was made by mixing agarose solution with cell culture medium. The transfected A172 cells were suspended in 0.35% low-melting agarose, and placed onto six-well plates which were precoated with 0.6% low-melting agarose. After incubation at 37 °C for 2 weeks, the number of colonies was counted microscopically.
Transwell assay
The migratory capacity of A172 cells following transfection was tested by using a transwell system with 8-μm pore filters (Costar, Boston, MA). The upper chamber of the system was filled with cell suspension which was made by suspending A172 cells in serum-free medium. The lower chamber was filled with a complete growth medium. Twenty-four hours later, the cells in the lower side were stained by 0.5% crystal violet (Beyotime, Shanghai, China) and collected by acetic acid. The OD values of samples at 570 nm were read to evaluate cell migration.
Cell cycle distribution
The transfected A172 cells were collected and fixed in 70% ethanol overnight at 4 °C. The cells were resuspended in the solution containing 0.2 mg/mL propidium iodide (PI) and 0.2 mg/mL DNAse-free RNAse A (both from Sigma, St. Louis, MO, USA). After staining for 30 min at room temperature in a dark room, the cells were analyzed using an Epics XL flow cytometer (Beckman Coulter, Fullerton, CA, USA). The percentage of cells in each cell-cycle phases was analyzed by the ModFit software (Verity Software House, Topsham, ME, USA) [Citation16].
Chromatin immunoprecipitation (ChIP)
The transfected A172 cells were incubated for 1% formaldehyde at room temperature for cross-linking. Ten minutes later, the cells were lysed with sodium dodecyl sulfate (SDS) lysis buffer (Beyotime), and the lysates were sonicated in an ultrasonic bath (Bioruptor, Tosho Denki, Yokohama, Japan). Immunoprecipitation was carried out by using primary antibodies against H1.5T10ph (generated as previously described [Citation17]) and GSK3 (ab40870, Abcam, Cambridge, MA). Normal anti-IgG antibody was used as an internal control (ab2410). Protein A-agarose/salmon sperm DNA beads (Millipore, Bedford, MA, USA) were then added into the sample and the precipitate was washed with salt solution as previously described [Citation18]. The DNA was eluted from the precipitate and qRT-PCR was conducted to analyze the enrichment of target mRNAs.
qRT-PCR
Total RNAs were extracted from the transfected cells by using TRIzol (Invitrogen). The extracted RNAs were reverse transcribed into cDNA by using M-MuLV reverse transcriptase (Fermentas, MD, USA) and QuantiTect SYBR Green PCR Kit (Qiagen, Hilden, Germany) was used for the process of qRT-PCR. β-actin was used as a reference control. Fold changes were calculated by the 2–ΔΔCt method.
Western blot
Primary antibodies used in this procedure were listed as follows. Anti-H1.5T10ph antibody was generated as previously described [Citation17]. Antibodies specific for anti-H1.5 (ab18208), anti-pAKTSer473 (ab81283), anti-AKT (ab235958), anti-GSK3 (ab40870), anti-HA (ab18181), anti-GFP (ab13970), anti-His (ab1206), anti-MDM2 (ab38618), anti-β-actin (ab8226) were all purchased from Abcam.
Total proteins were extracted from the transfected A172 cells by using RIPA lysis buffer (Beyotime). The extracted proteins were separated by SDS-polyacrylamide gel electrophoresis (SDS-PAGE) and transferred onto polyvinylidene fluoride (PVDF) membranes (Millipore, Bedford, MA, USA). Immunoblotting was conducted by using primary antibodies at 4 °C overnight and then probed by the secondary antibodies for 1 h at room temperature. The bands were developed by BeyoECL Plus kit (Beyotime). The intensity of target bands was analyzed by Gel-Pro Analyzer 4.0 software (Media Cybernetics, Inc., Rockville, MD, USA).
Statistics
Data presented as mean ± standard deviation (SD). Statistical analysis was performed by using SPSS 20.0 software (IBM, New York). Statistical difference between groups was analyzed by one-way analysis of variance (ANOVA) followed by Duncan post hoc multiple comparisons. A p value of <.05 was considered as a significant result.
Results
H1.5T10ph is negatively regulated by Ras-AKT activation
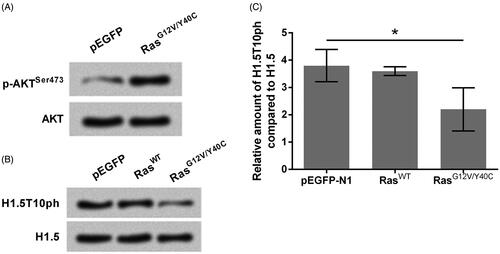
It is widely reported that Ras mutation is capable of activation of AKT signaling [Citation19]. This fact was also confirmed in this study. As compared to the cells transfected with pEGFP-empty vector, the expression of p-AKTSer473 was clearly up-regulated in the cells transfected with RasG12V/Y40C expression plasmid (). Meanwhile, we found that transfection of cells with RasG12V/Y40C expression plasmid significantly down-regulated the expression of H1.5T10ph (p < .05, ). This result indicated that activation of Ras-AKT led to the repressed phosphorylation of H1.5 at T10.
Figure 1. H1.5T10ph is negatively regulated by Ras-AKT activation. The plasmids for expression of wide-type of Ras (RasWT) or RasG12V/Y40C were transfected into A172 cells. The empty pEGFP plasmid was transfected as a blank control. Protein expression levels of (A) p-AKT, AKT and (B) H1.5T10ph, H1.5 were measured by Western blot. (C) Semiquantitative analysis of H1.5T10ph expression. *p < .05.
H1.5T10ph inhibits Ras-AKT activation induced growth and migration of A172 cells
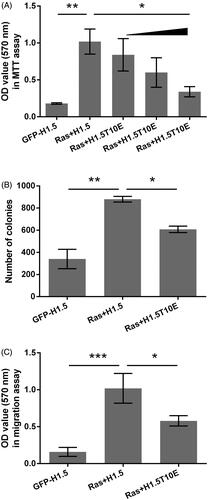
The involvement of H1.5T10ph in Ras-driven tumor cells growth and migration was then studied. As seen in , the viability of A172 cells was significantly increased by transfection with RasG12V/Y40C expression plasmid (p < .01). However, transfection of cells with increasing amounts of H1.5T10E (a plasmid for expressing mimicked H1.5T10ph) significantly reduced A172 cells viability (p < .05). Same trends were observed in the results from colony formation and transwell assays. showed that RasG12V/Y40C significantly increased the number of colonies and migratory capacity (p < .01 and p < .001). The increased colony number and migration by RasG12V/Y40C were attenuated by transfection with H1.5T10E (p < .05). These data suggested that the growth and migration of A172 cells induced by Ras mutation could be inhibited by H1.5 T10ph.
Figure 2. H1.5T10ph inhibits Ras-AKT activation induced growth and migration of A172 cells. The plasmids for expression of H1.5 (GFP-H1.5) and RasG12V/Y40C were transfected into A172 cells. H1.5T10E, a plasmid for expressing mimicked H1.5T10ph, was transfected instead of GFP-H1.5 in the indicated group. (A) Cell viability was tested and OD-values were recorded in MTT assay. Increasing amount of H1.5T10E (0.5, 1, and 2 μg) was used in this procedure. (B) Number of colony and (C) migration were measured by soft-agar colony formation and transwell assays. Two micrograms of H1.5T10E was utilized in these two assays. *p < .05, **p < .01, ***p < .001.
H1.5T10ph regulates the transcription of Ras downstream genes
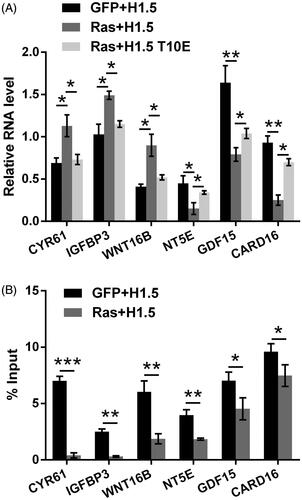
The expression of Ras downstream genes was then studied to further reveal the involvement of H1.5T10ph in tumor growth and metastasis mediated by Ras. qRT-PCR data in displayed that, the expression levels of CYR61, IGFBP3, WNT16B were up-regulated (all p < .05), while NT5E, GDF15, CARD16 were down-regulated (p < .05, p < .01, and p < .01) by transfection with RasG12V/Y40C expression plasmid. These alterations induced by RasG12V/Y40C were significantly reversed by H1.5T10E (p < .05). Besides this, ChIP assay was carried out to analyze the effects of H1.5T10ph on the transcription of these genes. Data in showed that the enrichment of H1.5T10ph was declined at these genomic loci (p < .05, p < .01, or p < .001). These data collectively suggested that H1.5T10ph was capable of regulating the transcription of these genes.
Figure 3. H1.5T10ph regulates the transcription of Ras downstream genes. (A) A172 cells were transfected with plasmids for expression of RasG12V/Y40C, H1.5 or mimicked H1.5T10ph (H1.5T10E). mRNA levels of Ras downstream genes were determined by qRT-PCR. (B) A172 cells were transfected with plasmids for expression of RasG12V/Y40C and H1.5. ChIP assay was carried out to detect the enrichment of H1.5T10ph in the promoter of these genes. *p < .05, **p < .01, ***p < .001.
GSK3 overexpression up-regulates H1.5T10ph and reverses Ras-AKT activation induced tumor cells growth and migration
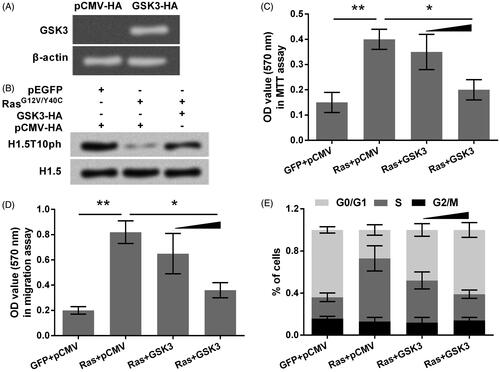
A previous study has reported GSK3 as a kinase for catalyzing the phosphorylation of H1.5 at T10 [Citation17]. This finding was confirmed in this study. As seen in , the declined expression of H1.5T10ph by RasG12V/Y40C was recovered by transfection with GSK3-HA (HA-tagged plasmid for expressing GSK3). The transfection efficiency of GSK3-HA was shown in , in which the mRNA levels of GSK3 were observed in gel electrophoresis. Furthermore, the role of GSK3 in A172 cells growth and migration induced by Ras-AKT activation was studied. As shown in , cell viability and migration increased by RasG12V/Y40C were both attenuated by GSK3 overexpression (p < .05). Besides this, GSK3 overexpression arrested more cells in G0/G1 phase and declined the percentage of cells in S phase (). These data indicated that, GSK3 catalyzed H1.5T10ph to repress Ras-AKT activation induced growth and migration of A172 cells.
Figure 4. GSK3 overexpression up-regulates H1.5T10ph and reverses Ras-AKT activation induced tumor cells growth and migration. (A) GSK3 expression plasmid (GSK3-HA) was transfected into A172 cells, and transfection efficiency was tested by qRT-PCR. Results were shown in gel electrophoresis. (B) A172 cells were co-transfected with plasmids for expression of RasG12V/Y40C and GSK3. The expression of H1.5T10ph was measured by Western blot. (C) Cell viability, (D) migration, and (E) cell-cycle progression were respectively assessed by MTT assay, soft-agar colony formation assay and flow cytometry. GSK3-HA plasmid was used with concentrations of 0.5 and 1 μg in these assays. *p < .05, **p < .01.
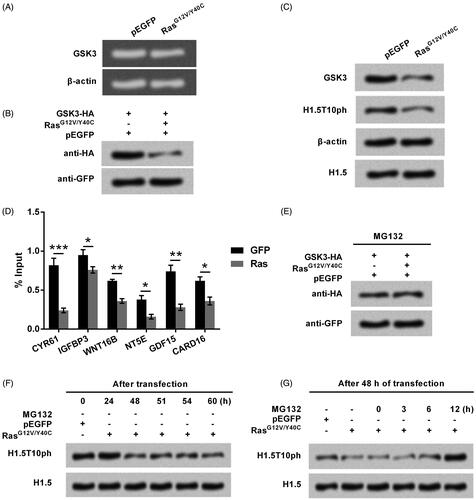
Ras-AKT signaling represses H1.5T10ph expression through degradation of GSK3
Further studies aimed to link Ras-AKT signaling with GSK3 as those two are both closely associated with H1.5T10ph. Gel electrophoresis results in showed that, the expression of GSK3 mRNA was unchanged by RasG12V/Y40C. However, both the exogenous and endogenous levels of GSK3 proteins were down-regulated by RasG12V/Y40C (). The results indicated that GSK3 was post-transcriptionally down-regulated by Ras-AKT activation. Besides this, ChIP results showed that the enrichment of GSK3 was significantly declined at the genomic loci of Ras downstream genes (p < .05, p < .01 or p < .001, ), indicating GSK3 was also capable of regulating the transcription of these genes. Then, MG132, a proteasome inhibitor, was used to treat A172 cells. Results in showed that, RasG12V/Y40C did not down-regulated exogenous levels of GSK3 by addition of MG132, indicating Ras-AKT signaling repressed GSK3 expression via a proteasome-dependent way. Further studies revealed that, the expression of H1.5T10ph repressed by RasG12V/Y40C was gradually recovered by addition of MG132 (). All these data hinted us that Ras-AKT signaling repressed the phosphorylation of H1.5 at T10 through degradation of GSK3.
Figure 5. Ras-AKT signaling represses H1.5T10ph expression through degradation of GSK3. (A) The plasmid for expression of RasG12V/Y40C was transfected into A172 cells. The mRNA level of GSK3 was tested by qRT-PCR and the data was shown in gel electrophoresis. (B) A172 cells were co-transfected with plasmids for expression of GSK3 and RasG12V/Y40C. Exogenous levels of GSK3 protein was tested by Western blot. (C) Plasmid for expressing RasG12V/Y40C was transfected and then the endogenous levels of GSK3 protein was tested by Western blot. (D) The enrichment of GSK3 in the promoter of Ras downstream genes was tested by ChIP. (E) MG132, a protease inhibitor, was used to treat A172 cells. The expression of GSK3 was tested by Western blot. (F) RasG12V/Y40C expression plasmid was transfected into A172 cells. The expression of H1.5T10ph was monitored following transfection of 0–60 h. (G) After 48 h of transfection, A172 cells were treated by MG132 for 0–12 h. The expression of H1.5T10ph was reassessed. *p < .05, **p < .01, ***p < .001.
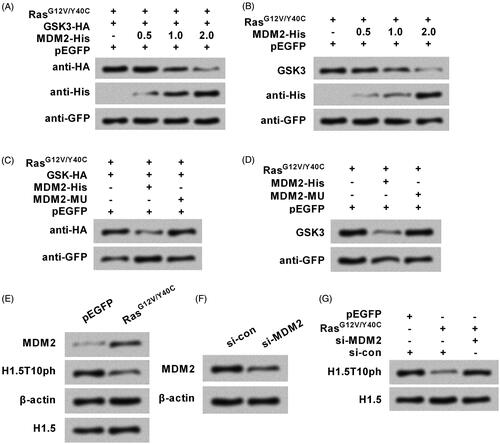
Ras-AKT signaling degrades GSK3 through modulation of MDM2
Finally, how Ras-AKT activation degraded GSK3 was studied. As we described above, the repressed GSK3 expression by Ras-AKT activation was via a proteasome-dependent way. Thus, we focused on investigating MDM2, a well-known protein in controlling proteasome-mediated degradation [Citation20], to reveal whether Ras-AKT activation degraded GSK3 through MDM2. showed that transfection of cells with MDM2-His (a His-tagged plasmid for expressing MDM2) remarkably down-regulated the exogenous and endogenous levels of GSK3 proteins. However, no such down-regulations were observed by transfection with a mutated type of MDM2 (MDM2-MU) (). Besides this, MDM2 expression could be up-regulated by RasG12V/Y40C (). However, the silence of MDM2 by siRNA transfection recovered H1.5T10ph expression which was repressed by RasG12V/Y40C (). The transfection efficiency of siRNAs was shown in .
Figure 6. Ras-AKT signaling degrades GSK3 through modulation of MDM2. (A) The plasmids for expression of RasG12V/Y40C, GSK3, and MDM2 were transfected into A172 cells. His-tagged MDM2 plasmid (MDM2-His) was used with concentrations of 0.5, 1, and 2 μg. Exogenous levels of GSK3 protein were tested by Western blot. (B) The plasmids for expression of RasG12V/Y40C and MDM2 were transfected. Endogenous levels of GSK3 protein were reassessed. A plasmid for expression of mutated type of MDM2 (MDM2-MU) was transfected instead of the MDM2-His. (C) Exogenous and (D) endogenous levels of GSK3 protein were respectively tested. (E) RasG12V/Y40C expression plasmid was transfected into A172 cells, and then the protein levels of MDM2 and H1.5T10ph were measured. (F) siRNA specific for MDM2 (si-MDM2) was transfected into cell. Transfection efficiency was tested by Western blot. (G) RasG12V/Y40C expression plasmid and si-MDM2 were co-transfected into cell. The expression of H1.5T10ph was measured.
Discussion
Like other core histones, the N- and C-terminal tails of H1.5 are subjected to various post-translational modifications, including methylation, acetylation, phosphorylation, and so forth. These post-translational modifications are able to alter the stability of chromatin structure, thereby regulate gene expression and finally function to cellular biological processes, including cell proliferation, migration, differentiation, death, and tumorigenesis [Citation21]. Phosphorylation is one of the best-known modifications of H1.5. As we know, there are 20 amino acid residues in H1.5 that can be phosphorylated. While recent work believed different phosphorylation enabled H1.5 to have different functions [Citation22], the significance of the phosphorylation remains unclear. The present work found that Ras-AKT activation was able to repress the phosphorylation of H1.5 at threonine 10 in A172 cells. The uncontrolled growth and migration of A172 cells induced by Ras-AKT activation were attenuated by H1.5T10ph. Furthermore, it was revealed that Ras-AKT repressed H1.5T10ph through MDM2-dependent degradation of GSK3.
Rapid growth and metastasis are the important properties of malignant tumors. They also are main factors of recurrence of cancers. Glioma is the most aggressive brain tumor with high invasiveness and poor prognosis. Evidences have shown that Ras mutations frequently occur in glioma. And Ras mutation leads to the activation of a wide range of signaling pathways, including AKT [Citation23], which participate in controlling tumor cells proliferation, death, metastasis, and cell-cycle progression. This here, we found that AKT activation induced by Ras mutation led to the down-regulation of H1.5T10ph, but has no impacts on H1.5 expression. The result indicated Ras-AKT activation was able to repress the phosphorylation of H1.5 at threonine 10. Besides this, H1.5T10ph was found to be involved in A172 cells growth and migration which were driven by Ras-AKT activation, indicating H1.5T10ph as a tumor suppressor.
To further confirm the tumor-suppressive role of H1.5T10ph in cancer, the regulatory effects of H1.5T10ph on the transcription of Ras downstream genes were studied, including CYR61, IGFBP3, WNT16B, NT5E, GDF15, and CARD16. These factors are all pivotal regulators in the tumor as well. Among which, CYR61, IGFBP3, WNT16B, and NT5E were reported to be oncogenes while GDF15 and CARD16 were considered as tumor suppressors. In different solid tumors, CYR61 was shown to promote tumor growth and vascularization as well as cell invasiveness and metastasis [Citation24,Citation25]. Like CYR61, overexpression of WNT16B promoted tumor growth and chemotherapy resistance [Citation26]. Depletion of IGFBP3 [Citation27] or NT5E [Citation28] induced tumor cell loss and thereby suppressed tumor cells growth. Of contrast, in vitro and in vivo experiments suggested overexpression of GDF15 [Citation29] or CARD16 [Citation30] inhibited tumor cell growth via controlling caspases and cell proliferation, respectively. The findings of this study demonstrated that H1.5T10ph was capable of regulating the transcription of these genes, further confirmed the involvement of H1.5T10ph in the progression of glioma.
GSK3 is a multifunctional Ser/Thr kinase that phosphorylates glycogen synthase. Recent article evidenced that GSK3 not only involved in the regulation of glycogen metabolism, but also play central roles in a variety of signaling pathways which are closely associated with cell mobility, proliferation, and survival [Citation31]. More interestingly, a previous study strongly suggested that GSK3 was responsible for phosphorylating H1.5 at threonine 10 [Citation17]. Our data was in line with this finding and further revealed that Ras-AKT signaling suppressed H1.5T10ph via degradation of GSK3. Actually, previous studies have linked GSK3 with Ras signaling. As reported by Lee et al., GSK3 was required for Ras degradation, and this process was mediated through proteasomes [Citation32]. Besides this, GSK3 was reported to be essential for tumor survival mediated by Ras [Citation33]. However, the present study for the first time suggested that Ras-AKT signaling degraded GSK3 to promote the growth and migration of glioma cells.
MDM2 is a ubiquitin-protein ligase that functions as a regulator of tumor suppressor protein p53. Additionally, it was known as an enzyme in controlling proteasome-mediated degradation [Citation20]. In this study, we found that Ras-AKT activation did not repress GSK3 expression in the presence of proteasome inhibitor MG132, indicating Ras-AKT signaling degraded GSK3 via a proteasome-dependent way. Our further studies confirmed that the degradation of GSK3 by Ras-AKT activation through MDM2.
Considering the importance of Ras in the onset and progression of human cancers, clinical trials have been developed to target Ras. At present, several drugs direct targeting Ras are in phase II and III trials, like tipifarnib (R115777, Zanestra), lonafarnib (SCH66336, Sarasar), ISIS 2503, ISIS 5132, and so forth. However, most of them have been confirmed to have no effects [Citation34]. So, some studies turned to reveal the clinical usage of drugs that affect Ras downstream signaling. For instance, temsirolimus (CCI-779) and everolimus (RAD-001), the drugs for inhibiting PI3K/AKT/mTOR signaling [Citation35,Citation36], are in trials at present. A better understanding of Ras-AKT signaling will be helpful for the development of antitumor drugs. The present article found that the oncogenic function of Ras-AKT signaling may be through inhibiting H1.5 phosphorylation. The findings together with others reported elsewhere [Citation37,Citation38] suggested that Ras-AKT signaling worked through regulating histone modification. The present article provided a possible explanation of Ras’s oncogenic functions. And the findings made beneficial for exploiting the drugs for targeting this signaling in the clinic.
Conclusions
These findings suggested that Ras-AKT signaling driven the growth and migration of glioma cells through repressing the phosphorylation of H1.5 at threonine 10. Furthermore, Ras-AKT activation repressed H1.5T10ph through MDM2-dependent degradation of GSK3.
Acknowledgement
This research did not receive any specific grant from funding agencies in the public, commercial, or not-for-profit sectors.
Disclosure statement
The authors declare that there are no conflicts of interest.
Related Research Data
References
- Zeng T, Cui D, Gao L. Glioma: an overview of current classifications, characteristics, molecular biology and target therapies. Front Biosci. 2015; 20:1104–1115.
- Konar SK, Bir SC, Maiti TK, et al. A systematic review of overall survival in pediatric primary glioblastoma multiforme of the spinal cord. J Neurosurg Pediatr. 2017;19:239–248.
- Luhtala N, Aslanian A, Yates JR, III, et al. Secreted glioblastoma nanovesicles contain intracellular signaling proteins and active Ras incorporated in a farnesylation-dependent manner. J Biol Chem. 2017;292:611–628.
- Holmen SL, Williams BO. Essential role for Ras signaling in glioblastoma maintenance. Cancer Res. 2005;65:8250–8255.
- Niu W, Wang G, Feng J, et al. Correlation between microsatellite instability and RAS gene mutation and stage III colorectal cancer. Oncol Lett. 2019; 17:332–338.
- Wei L, Chang H, Huo S. Analyses on K-ras mutations and fascin expression in patients with cardia cancer. Oncol Lett. 2019;17:1807–1811.
- Hobbs GA, Der CJ, Rossman KL. RAS isoforms and mutations in cancer at a glance. J Cell Sci. 2016;129:1287–1292.
- Coura BP, Bernardes VF, de Sousa SF, et al. KRAS mutations drive adenomatoid odontogenic tumor and are independent of clinicopathological features. Mod Pathol. 2019;32:799–806.
- Polosukhina D, Love HD, Correa H, et al. Functional KRAS mutations and a potential role for PI3K/AKT activation in Wilms tumors. Mol Oncol. 2017;11:405–421.
- Kimura H. Histone modifications for human epigenome analysis. J Hum Genet. 2013;58:439–445.
- Zhang B, Zheng H, Huang B, et al. Allelic reprogramming of the histone modification H3K4me3 in early mammalian development. Nature. 2016;537:553–557.
- Nammo T, Udagawa H, Funahashi N, et al. Genome-wide profiling of histone H3K27 acetylation featured fatty acid signalling in pancreatic beta cells in diet-induced obesity in mice. Diabetologia. 2018;61:2608–2620.
- Khachaturov V, Xiao GQ, Kinoshita Y, et al. Histone H1.5, a novel prostatic cancer marker: an immunohistochemical study. Hum Pathol. 2014;45:2115–2119.
- Momeni M, Kalir T, Farag S, et al. Expression of H1.5 and PLZF in granulosa cell tumors and normal ovarian tissues: a short report. Cell Oncol. 2014;37:229–234.
- Momeni M, Kalir T, Farag S, et al. Immunohistochemical detection of promyelocytic leukemia zinc finger and histone 1.5 in uterine leiomyosarcoma and leiomyoma. Reprod Sci. 2014;21:1171–1176.
- Pan XW, Zhao XH. In vitro proliferation and anti-apoptosis of the papain-generated casein and soy protein hydrolysates towards osteoblastic cells (hFOB1.19). Int J Mol Sci. 2015;16:13908–13920.
- Happel N, Stoldt S, Schmidt B, et al. M phase-specific phosphorylation of histone H1.5 at threonine 10 by GSK-3. J Mol Biol. 2009;386:339–350.
- Liu Y, Xing ZB, Zhang JH, et al. Akt kinase targets the association of CBP with histone H3 to regulate the acetylation of lysine K18. FEBS Lett. 2013;587:847–853.
- Steinbrunn T, Stuhmer T, Gattenlohner S, et al. Mutated RAS and constitutively activated Akt delineate distinct oncogenic pathways, which independently contribute to multiple myeloma cell survival. Blood. 2011;117:1998–2004.
- Nihira NT, Ogura K, Shimizu K. Acetylation-dependent regulation of MDM2 E3 ligase activity dictates its oncogenic function. Sci Signal. 2017;10:pii: eaai8026.
- Godde JS, Ura K. Cracking the enigmatic linker histone code. J Biochem. 2007;143:287–293.
- Liao R, Mizzen CA. Interphase H1 phosphorylation: regulation and functions in chromatin. Biochim Biophys Acta. 2016;1859:476–485.
- Fang B. RAS signaling and anti-RAS therapy: lessons learned from genetically engineered mouse models, human cancer cells, and patient-related studies. Acta Biochim Biophys Sin (Shanghai). 2016;48:27–38.
- Sun ZJ, Wang Y, Cai Z, et al. Involvement of Cyr61 in growth, migration, and metastasis of prostate cancer cells. Br J Cancer. 2008;99:1656–1667.
- Habel N, Stefanovska B, Carene D, et al. CYR61 triggers osteosarcoma metastatic spreading via an IGF1Rbeta-dependent EMT-like process. BMC Cancer. 2019;19:62.
- Johnson LM, Price DK, Figg WD. Treatment-induced secretion of WNT16B promotes tumor growth and acquired resistance to chemotherapy: implications for potential use of inhibitors in cancer treatment. Cancer Biol Ther. 2013;14:90–91.
- Chen CH, Chen PY, Lin YY, et al. Suppression of tumor growth via IGFBP3 depletion as a potential treatment in glioma. J Neurosurg. 2019; 1–12. [Epub ahead of print]. doi:10.3171/2018.8.JNS181217
- Peng D, Hu Z, Wei X, et al. NT5E inhibition suppresses the growth of sunitinib-resistant cells and EMT course and AKT/GSK-3beta signaling pathway in renal cell cancer. IUBMB Life. 2019;71:113–124.
- Lu X, He X, Su J, et al. EZH2-mediated epigenetic suppression of GDF15 predicts a poor prognosis and regulates cell proliferation in non-small-cell lung cancer. Mol Ther Nucleic Acids. 2018; 12:309–318.
- Karasawa T, Kawashima A, Usui F, et al. Oligomerized CARD16 promotes caspase-1 assembly and IL-1beta processing. FEBS Open Biol. 2015;5:348–356.
- Paudel P, Seong SH, Zhou Y, et al. Rosmarinic acid derivatives' inhibition of glycogen synthase kinase-3beta is the pharmacological basis of Kangen-Karyu in Alzheimer's disease. Molecules. 2018;23;pii: E2919.
- Lee SK, Jeong WJ, Cho YH, et al. Beta-catenin-RAS interaction serves as a molecular switch for RAS degradation via GSK3beta. EMBO Rep. 2018;19:pii: e46060.
- Kazi A, Xiang S, Yang H, et al. GSK3 suppression upregulates β-catenin and c-Myc to abrogate KRas-dependent tumors. Nat Commun. 2018;9:5154.
- Downward J. Targeting RAS signalling pathways in cancer therapy. Nat Rev Cancer. 2003;3:11–22.
- Porta C, Paglino C, Mosca A. Targeting PI3K/Akt/mTOR signaling in cancer. Front Oncol. 2014;4:64.
- Colon-Otero G, Weroha SJ, Foster NR, et al. Phase 2 trial of everolimus and letrozole in relapsed estrogen receptor-positive high-grade ovarian cancers. Gynecol Oncol. 2017;146:64–68.
- Li Y, Sun D, Sun W, et al. Ras-PI3K-AKT signaling promotes the occurrence and development of uveal melanoma by downregulating H3K56ac expression. J Cell Physiol. 2019. [Epub ahead of print]. doi:10.1002/jcp.28261
- Liu Y, Wang DL, Chen S, et al. Oncogene Ras/phosphatidylinositol 3-kinase signaling targets histone H3 acetylation at lysine 56. J Biol Chem. 2012; 287:41469–41480.